The 21st-century business-world is surrounded by millions and trillions of data on all possible sides.
And data has powerful capabilities that can transform your business’s face, especially when the competition is all around.
In such a scenario, the decisions backed by stronger data can only be trusted to maximize your business operations’ outcomes.
But here’s the question: How do companies understand which data is powerful to them to bring on positive results?
One way to go for it is by using a powerful Business Intelligence (BI) tool.
That’s right!
It will help you with valuable insights out of your data and allow you to visualize them closely and understand every bit of it.
Let’s find out about a BI tool and how it can help you.
What is a BI tool?
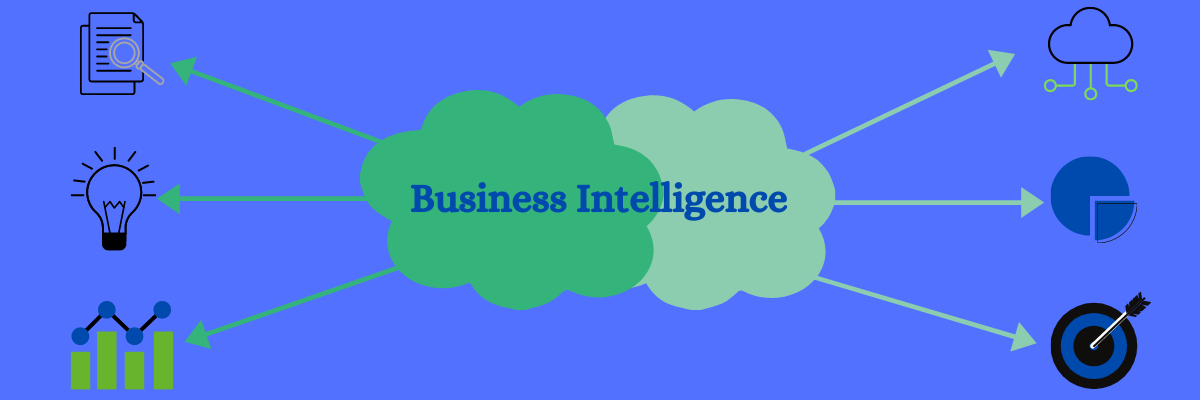
BI tools or platforms are software that you can use to collect past, future, and current data and then process and analyze them. It is done to make actionable insights, build interactive reports, simplify decision-making for your business, and many more functionalities.
These platforms come with key features, including data visualization, KPI scorecards, visual analytics, and interactive dashboards. Apart from this, these tools also enable you to leverage automated reporting along with predictive analysis to understand future trends.
How BI helps businesses to understand data?
The human brain is wired in such a way that it catches visual triggers quickly to get fully immersed in something. This is how we process data in general.
Simply put, when you look at an image or graphic, it becomes much easier for you to understand things instead of scrolling through unending texts or spreadsheets. BI tools are built keeping this aspect of the human brain in mind. The main aim of BI tools is to make data easy to grasp for the user to create valuable insights out of them.
Data visualization through charts, graphs, heat maps, images, videos, and infographics incorporated in visualization helps you understand data better.
How does a BI tool work?

BI tools work in the following steps:
- Accessing and viewing data
- Interacting with them
- Analyzing and discovering meaningful information beneficial for your business
- Sharing that information with your team for further implementation
- Promoting and governing insightful data to make better business decisions, along with future planning.
Benefits of BI tools
- Brings together every relevant data from multiple endpoints such as portals, CRMs, ERPs, databases, flat files, APIs, etc.
- Help businesses to create self-service analytics without any IT support. It’s because these tools make everything clear and concise that users can easily understand. Next, they can effortlessly generate reports that make sense and perform queries as well.
- Predictive analysis can be achieved with these tools to shape future decisions based on trends. If conditions changes at a later phase or an anomaly occur, you can receive intelligent alerts that help you react instantly.
- Due to automation with BI tools, you can save time using drag-and-drop editor from their interactive dashboard.
- Along with time, it saves your business expenditure that otherwise is wasted on inaccurate planning.
Now that you know what it does, let’s explore some of the best business intelligence tools available in the market.
Sisense
Get fast and actionable insights from Sisense’s robust analytics software. This is an API-first, SaaS-based platform built to it easier for you to collect data, create beautiful visualizations, and build analytic applications that you can embed anywhere.
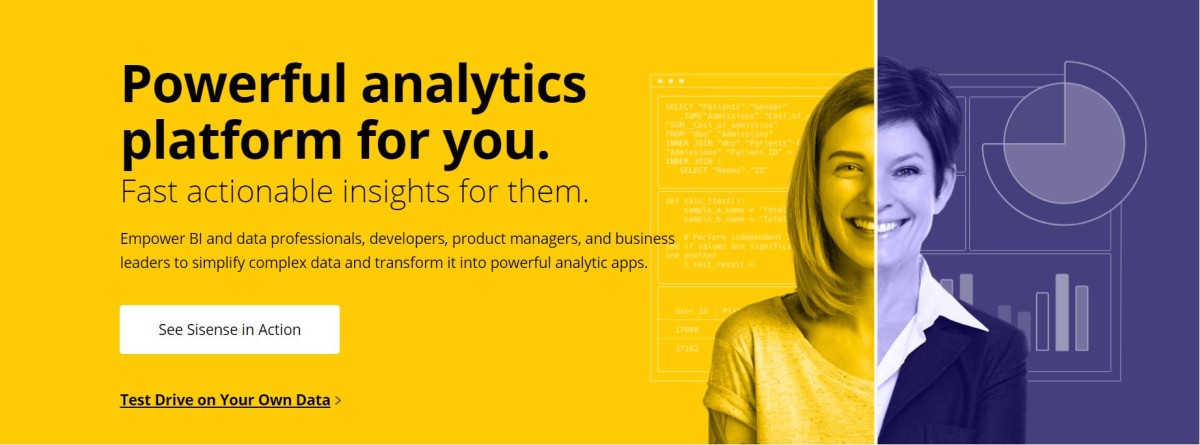
Drive innovation and run a 21st-century business using self-service analytics that utilizes your data irrespective of its location. Sisense offers a cutting-edge, cloud-native data and analytics platform enriched with artificial intelligence and machine learning to build enterprise-grade apps at a lower TCO.
Some of the features of Sisense are:
- Embeddable analytics with white labeling and customization for scalable and secure BI integrations into any product development project
- Powerful AI and ML capabilities for autonomous mapping of connections between datasets, anomaly detection for a triggered response, and natural language query interfaces via chat and voice
- Analyze data from your entire data landscape to convert it into actionable app components and powerful dashboards with interactive visualizations
- Combine live and cached data models for optimizing performance and management of resources
- Use collected insights to make better business decisions and solve complex scenarios
- Control the access of systems, data, objects, process levels such as audit trails and recovery
Sisense is an enterprise-ready solution and does offer software to be deployed on-premises, or you can go with a hybrid model.
Power BI
Deliver insights using Power BI along with the new capabilities of Azure Purview and Azure Synapse Analytics. Enable people of different levels in your organization to make confident business decisions with updated analytics.
Avail enterprise-scale self-service analytics to reduce added cost, security risks, and complexities associated with multiple solutions. The analytic platform of Power BI scales from every individual to the whole organization.
Find meaningful insights and share them with hundreds of built-in artificial intelligence capabilities, data visualizations, excel integrations, custom, and pre-built data connectors. Get major sensitivity classification and prevention capability for data loss to secure your data and maintain compliance even if you export it.

Power BI integrates with Adobe Analytics Cloud to deliver extensive data capabilities by helping you understand how your audience engages with your content. It provides a 360-degree audience view with tools to build, manage, and deliver a digital experience.
Create end-to-end and powerful business solutions by connecting this BI solution across the Microsoft platforms, including Office 365, Azure, Dynamics 365, and other applications to accelerate innovation. It helps you build applications in hours that can easily connect to data, run over the iOS, Android, and web devices, and utilize Excel-like expressions.
Unify data out of multiple sources to build immersive and interactive dashboards and reports providing insights and drive results. Include robust workflow automation directly onto your apps without writing a single line of code to connect to popular services and applications.
You can also create chatbots effortlessly to engage with your audience.
Zoho Analytics
Analyze data, create impressive visualizations, and discover concealed insights in a few minutes using Zoho Analytics. No matter where your data lies in web files, flat files, databases, offline/online apps, cloud services, etc., you can conduct deep analytics and reporting.
Besides, you can schedule data and sync it periodically or automatically, whatever you want. Upload data out of MS Excel, HTML, CSV, XML, JSON, text files, etc. In addition to online storage solutions such as Zoho Docs, Dropbox, Google Drive, Microsoft OneDrive, Box, and web URLs. Connect to relational databases hosted in the cloud or in-house for analytics apart from famous NoSQL databases.
You can also connect with business apps in marketing, sales, help desk, finance, IT, HR, etc., through ready-made connectors. In case your data is stored in an app, you can leverage their data import and integration APIs. Zoho Analytics lets you blend data from multiple sources and merge them to create comprehensive business reports that make sense.
It can auto-blend data out of popular business applications as well. You get an intuitive drag and drop interface that makes the process easier and visualization options with charts, pivot tables, tabular components, and widgets apart from images and formatted texts to create dashboards and reports and track KPIs.
Utilize various interaction options such as viewing underlying data, contextual filters, drill-downs, and more to execute the ad-hoc analysis. Analyze geographical data using map charts to measure and compare crucial metrics across countries, states, regions, counties, longitudes, latitudes, and even postal codes.
Zoho Analytics has a spreadsheet-like interface that’s easy to work with and has a wide library of statistical and mathematical functions to extract business metrics. They introduce you to Zia – their intelligent analytical assistant that tells you suitable answers to your typed questions to present in the form of KPI widgets and reports.
Zia uses machine learning and natural language processing (NLP) to help you with insights. Get ready for future events with smart and accurate forecasting of trends based on previous data. Stay updated with alerts in case of any anomaly, changes, or spike in data.
Zoho Analytics allows you to collaborate with your team by sharing reports. Control the access of reports through options including read-only, report authoring, read-write, export, drill-down, and more. You can add contextual comments, annotate images, and see comment history anytime.
You can publish reports, embed them into blogs, websites, and apps for extensive consumption. Include white labeling and create a reporting website or portal under your brand. You get powerful HTTP-based APIs for data integration and Metadata control. Don’t worry about security as they have you covered with redundancy, confidentiality, backups, and privacy to secure your data.
Qlik
Qlik is envisioned to make the world a data-literate place where people can leverage information and associated analytics to solve their challenging problems while enhancing decision-making. It offers end-to-end data integration in real-time to close wider gaps between insights, data, and action.
Qlik has already served 50k customers residing in 100 countries and uses DataOps to enhance your business with trusted collaborative analysis. It produces accurate insights that are easy to access through their cloud or any other cloud you may wish.
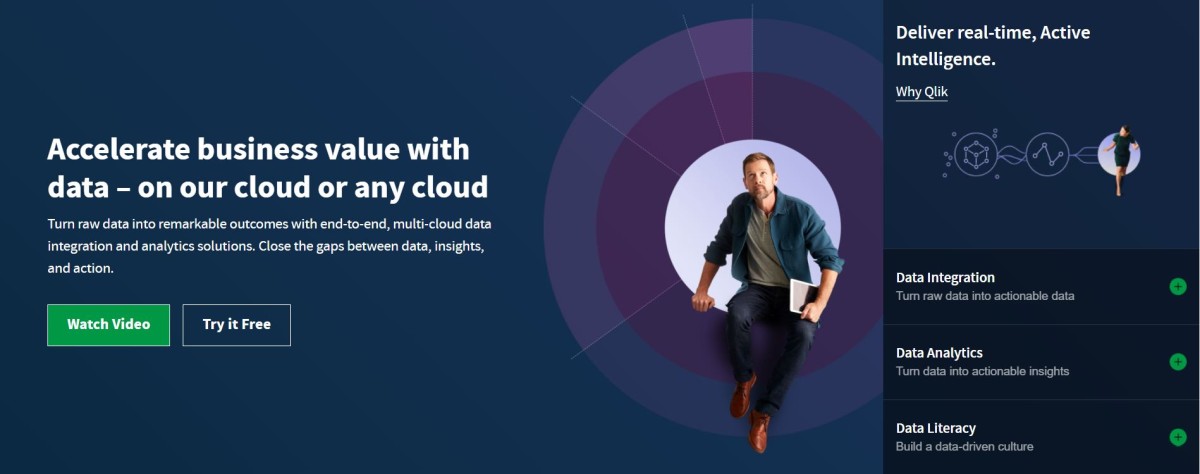
Move data instantly at scale with no tasking sources to efficiently deliver data to the cloud. You can automate the overall process right from when your data is raw to when it is analytics-ready. Gain scalability and agility by automation that eliminates errors and complex scripting to build trust.
Qlik Sense is a technology that benchmarks the new generation’s data analytics and empowers users irrespective of their skill sets through a unique Associative Engine featuring a powerful AI. This engine indexes data relationships while AI increases data literacy and accelerates innovation while surfacing in-context insights.
Dundas BI
Gaining data-driven insights in real-time is simplified with Dundas BI due to its exceptional end-to-end business intelligence for analyzing and visualizing data.
It helps software vendors and enterprises by converting raw data into intelligent, actionable insights through reports, dashboards, visual analytics, etc. Unlike other BI platforms that are one-dimensional and restrictive, Dundas BI is comprehensive and offers much-needed flexibility and speed while removing roadblocks.
You don’t need multiple tools for the entire process; unlike others, only one product can suffice for preparation, analysis, and visualization. As everything is under a single platform, it results in improved effectiveness and greater efficiency.
Dundas BI can adapt to any user type that allows you to personalize it to a great extent. With this self-service analytics approach, developers and analysts get empowered to analyze data quickly with meaningfulness.
Running ad-hoc queries, performing visual analytics, and creating relevant content is easy and quick with minimal IT assistance. Dundas BI is crafted with open APIs and HTML5 to allow better customization and improve dashboards, interactions, labels, scorecards, etc., that can meet unique design needs.
Realize your data’s business value with advanced prediction and on-the-go data analysis represented in a personalized format. Manage and deploy analytics solutions securely based on your IT standards. You can connect it to relational databases, file-based data, web-based data, OLAP, etc. Leverage multiple storage types in the data cube layer of Dundas BI, like warehouse and in-memory.
GoodData
Already empowered 100s of customers, partners, and teams with a cost-efficient, easily controllable, and fully customizable BI platform, GoodData is a great option for you. Embed analytics directly onto your product/service, which helps you make decisions without an IT or analytics expert’s assistance.
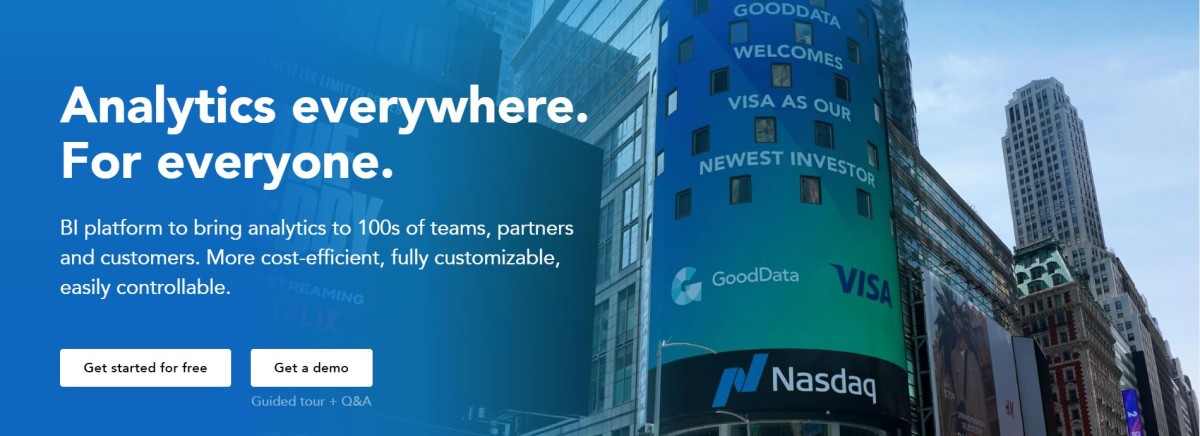
You can help your eCommerce partners utilize your platform efficiently to gather essential insights instantly. With GoodData by your side, you can transform your employees’ skills and make them experts who can make better and reliable decisions, even in critical business moments.
This BI analytics is in the cloud, which reduces your IT headaches associated with installation, management, etc. You get fast and flexible services from GoodData no matter you build it yourself or go for a service package.
Looker
Discover the true power of your data with the help of Looker to drive sensible outcomes through intelligent data-driven experiences. It combines with the data analysis of Google Cloud to offer more options and increase your deliverability through fresh and strong insights.
Looker offers a real-time dashboard to get consistent analysis and easy access to genuine data that enables your teams to garner accurate results and reporting. Integrate the tools you love to increase productivity and make data-informed decisions.
Accelerate your workflows using unified answers, and create custom applications to deliver unique data experiences. Looker has embedded analytics services from healthcare to retail and more to serve a wider range of customers.
It supports different data sources and deployment methods to provide more flexibility, with no compromise on security, privacy, and transparency. Looker can seamlessly connect with Snowflake, Redshift, BigQuery, etc., apart from more than 50 SQL dialects.
As a result of this, you can link to various databases, maintain multi-cloud environments, and prevent database lock-in. As Looker understands that you expect technology stack freedom, it supports public cloud hosting services such as GCP and AWS in multi-cloud and hybrid environments.
IBM’s Cognos Analytics
Let Cognos Analytics help drive confident decisions through automated data discovery, preparation, and visualization. You can import data out of spreadsheets and CSV files, connect to on-premises or cloud sources such as Google BigQuery, SQL database, Redshift, Amazon, and more.
It saves your time spent on data cleaning by incorporating AI-assisted preparation. Apart from this, you can join data, include calculated fields, create tables, etc. Create compelling and interactive dashboards quickly, drag-and-drop data to build auto-generated visualizations, carry deep detailing, and share them through Slack or email.
You can ask their AI assistant certain questions in simple language to find answers and predict trends with time-series modeling. Update your stakeholders automatically, craft and share personalized, dynamic, and multi-page reports presented in your stakeholder’s preferred format.
Gain deep insights even with no background in data science necessarily. You can also validate the information and identify things new to you with pinpoint patterns and accurate forecasting. Stay in the loop with their mobile application to access data while getting real-time alerts directly on your phone all the time.
Conclusion
Data has a huge role in shaping present-day businesses. So, it depends on you how you utilize the available data around you to make better decisions. This is why using a business intelligence tool can help you big-time in running your business with better planning and execution using insightful data.
If you need something light, then alternatively, you can leverage Google Data Studio with these powerful data connectors to visualize your data.


