About Us
-

Our Humble Beginnings
We – Al Qayser Company- was one of the first founded companies in the Egyptian fruits market in in 30th of the past century (precisely, in year 1921) as a private proprietorship for fruit trade in Alexandria fruit market, current shareholders are the third generation. Later on, the Company started to import some exotic fruits to Egypt and distribute to markets and whole sellers all over Egypt. The company then Built its first cold store warehouse consisting of four chilled rooms to preserve our products and our company kept growing until today it is one of Egypt’s largest fruit trade companies.
-

An Agency is Born
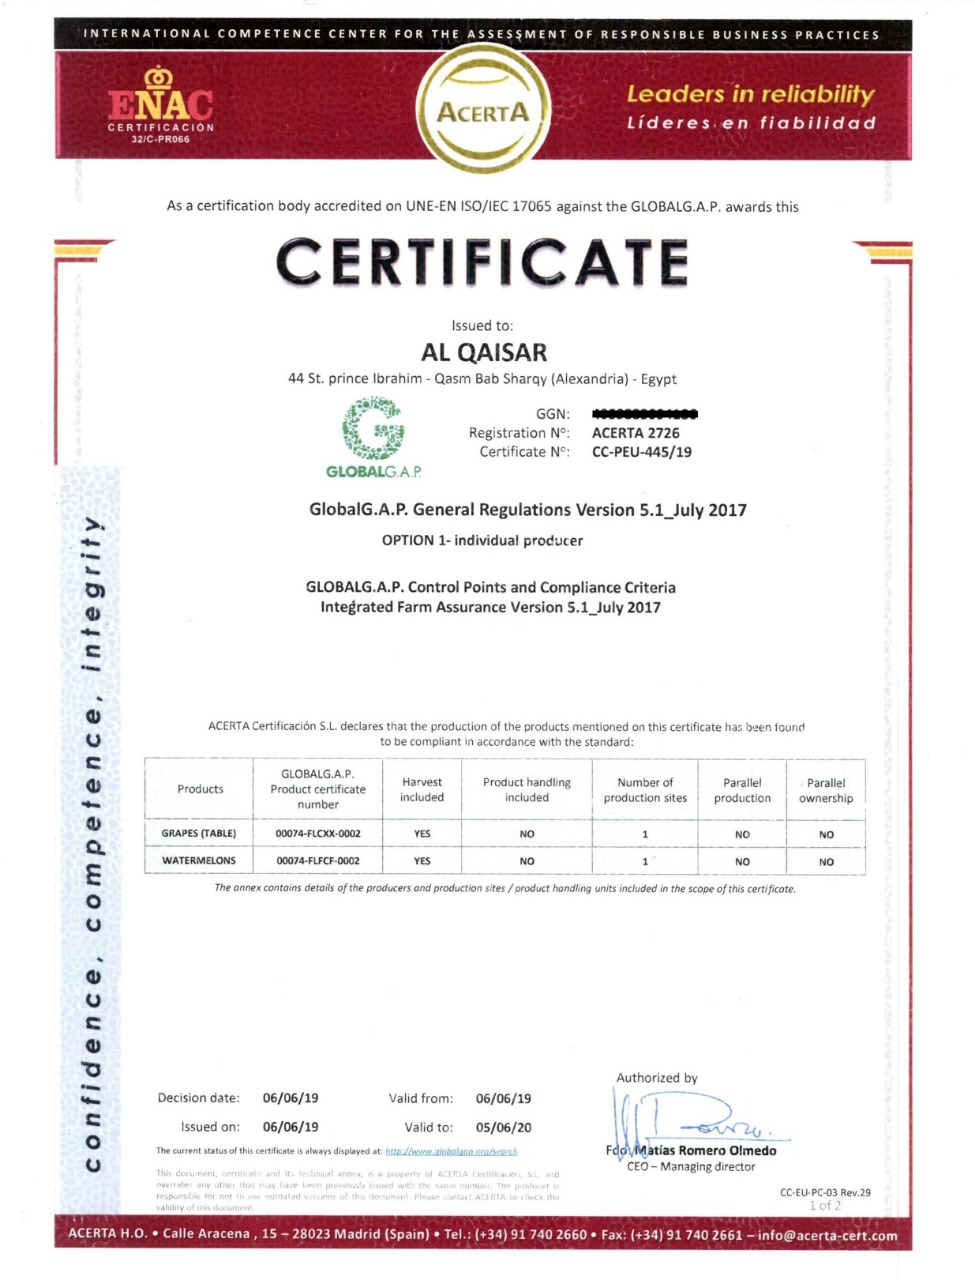
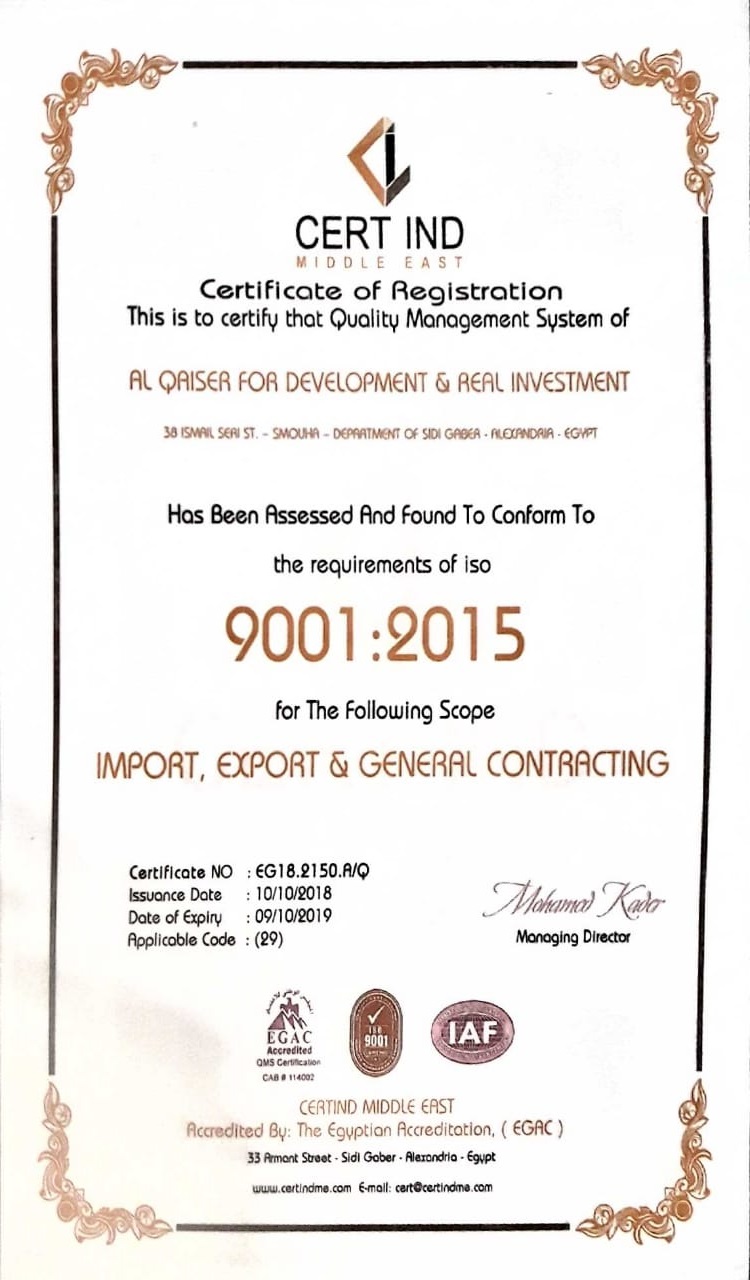
Later on Mr. Ahmed Etman and Mr. Mahmoud Etman took over the family business to grow on what their grandfathers achieved. They founded Al Qayser Company to import, export and distribute the different fruit and vegetables varieties in Egypt and world around. Our farms are managed by our operations department through an integrated food safety and quality management system that complies with the international food industries’ standards. Now, are selling over 1,500 containers per year and steadily increasing each year.
-

Transition to Full Service
Currently Al Qayser Company becomes one of the leading Egyptian producers and exporters of fresh fruit and vegetables. We do business with many countries all over the world. By ensuring the best quality of our Goods, Packaging, Supply, Sale, Cold Storage facilities etc.… we are maintaining all our suppliers and customers satisfaction and trust. We provide flexible services to our valuable clients by providing satisfaction in terms of quality, quantity and services we do. We earned trusts of many global clients.
-

Our Vision
Striving to achieve excellence in enhancing the healthy lifestyle of human being through making healthy food available for every place in the world. In doing so we address creating value to all our partners we provide family environment to our employees’ partnership to our suppliers and distribution channels value to our customers’ profits and stock value to our shareholders.
-
Our Mission
Providing our customers, the offers that perfectly fits their needs through applying the latest technologies and techniques in our field for continues improvement in services and products’ quality. Ensuring customers’ satisfaction by offering very competitive prices for the best quality delivered at the right time with an excellent customer service that exceeds their expectation.
-
Be Part
Of Our
Story!