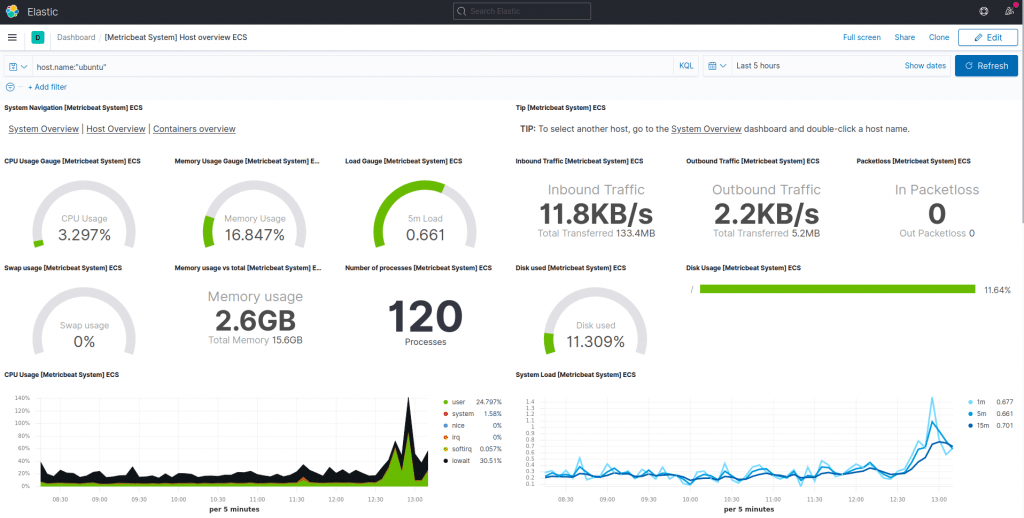
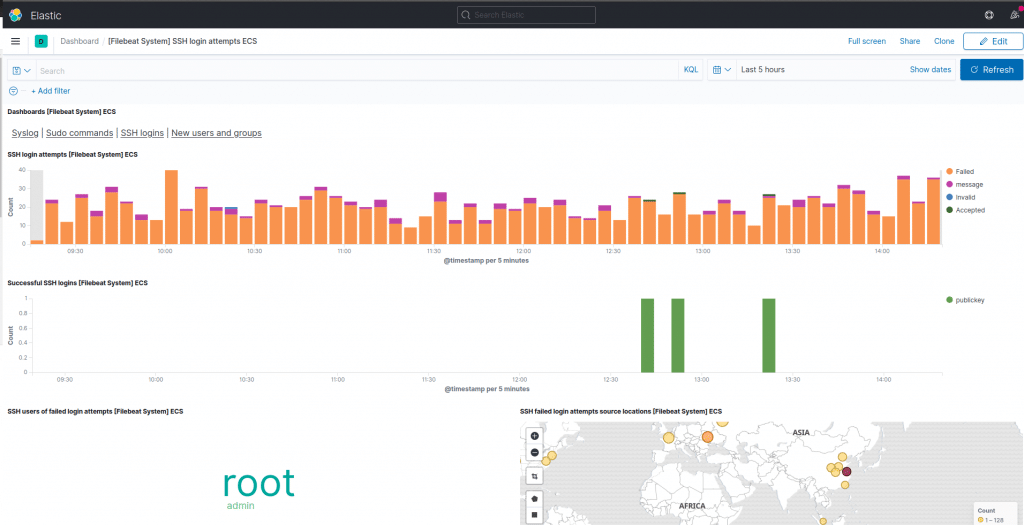
Elasticsearch is a log analytics engine that enables users to store, index, analyse and visualize logs and metrics on a dashboard. Elastic search uses Kibana for visualizing the data on a dashboard. In this guide we shall cover how to install ElasticSearch, Kibana and how to ship logs to Elastic search instance using Beats.
Beats are the shippers that are used to send the logs to Elastic search from different endpoints. They are installed as agents on the clients so they can ship the logs to Elastic search instance.
There are different types of Beats as briefly discussed below:
- Filebeat – Analyse log files
- Packetbeat – Analyse network packets
- Winlogbeat – Used to analyse Windows events
- Metricbeat – Used to ship metrics of your cloud environment
- Auditbeat – used to ship information about system audit data
- Heartbeat – used to monitor infrastructure availability
Install ElasticSearch on Ubuntu / Debian
In this guide, we shall be installing ElasticSearch on Ubuntu / Debian by following the steps below :
Update system
sudo apt update && sudo apt upgrade -yInstall Open-JDK 11 (recommended)
sudo apt install default-jdk -yImport Elastic search GPG key
wget -qO - https://artifacts.elastic.co/GPG-KEY-elasticsearch --no-check-certificate | sudo apt-key add -Add ElasticSearch repository
echo "deb https://artifacts.elastic.co/packages/7.x/apt stable main" | sudo tee -a /etc/apt/sources.list.d/elastic-7.x.listInstall ElasticSearch
sudo apt update
sudo apt install elasticsearch
Configure Elasticsearch to allow remote connections by changing the network.host IP to 0.0.0.0 in the /etc/elasticsearch/elasticsearch.yml file
$ sudo nano /etc/elasticsearch/elasticsearch.yml

# ---------------------------------- Network -----------------------------------
#
# Set the bind address to a specific IP (IPv4 or IPv6):
#
network.host: 0.0.0.0
#
# Set a custom port for HTTP:
#
#http.port: 9200
#
# For more information, consult the network module documentation.
#
Start and enable Elasticsearch
sudo /etc/init.d/elasticsearch start
sudo systemctl enable --now elasticsearch
Check that Elasticsearch is up and running:
$ curl http://127.0.0.1:9200Sample output:
$ curl http://127.0.0.1:9200
{
  "name" : "ubuntu",
  "cluster_name" : "computingforgeeks",
  "cluster_uuid" : "EVzpAqUUSV6wQhO7yiPeKw",
  "version" : {
    "number" : "7.10.1",
    "build_flavor" : "default",
    "build_type" : "deb",
    "build_hash" : "1c34507e66d7db1211f66f3513706fdf548736aa",
    "build_date" : "2020-12-05T01:00:33.671820Z",
    "build_snapshot" : false,
    "lucene_version" : "8.7.0",
    "minimum_wire_compatibility_version" : "6.8.0",
    "minimum_index_compatibility_version" : "6.0.0-beta1"
  },
  "tagline" : "You Know, for Search"
Install Kibana on Ubuntu / Debian
Kibana provides the web interface where we can visually analyse the collected data.
Use the steps below to install Kibana on the same host:
sudo apt install kibanaConfigure Kibana to allow external IP connections. Edit the /etc/kibana/kibana.yaml file and change the server.host option to your external IP or 0.0.0.0.
$ sudo nano /etc/kibana/kibana.yaml
# Kibana is served by a back end server. This setting specifies the port to use.
server.port: 5601

...
# To allow connections from remote users, set this parameter to a non-loopback address.
server.host: "0.0.0.0"
Since we are installing Kibana and Elasticsearch on the same host, we don’t need to change the elasticsearch.hosts field.
Start and enable Kibana
sudo systemctl enable --now kibanaYou can now access Kibana dashboard using your server’s IP on port 5601, i.e http://server-IP:5601.
You may need to allow the port through the firewall:
sudo ufw allow 5601/tcp
Install Metricbeat
Once you have configured Elasticsearch and Kibana, you will need to setup Beats on the client servers.
In this post we shall cover how to install Filebeat and Metricbeats on client server.
Install Metricbeat
You can download Metricbeat from APT and YUM repositories:
APT
- Setup GPG key for elasticsearch
wget -qO - https://artifacts.elastic.co/GPG-KEY-elasticsearch | sudo apt-key add -2. Install Metricbeat repository
sudo apt-get install apt-transport-https
echo "deb https://artifacts.elastic.co/packages/7.x/apt stable main" | sudo tee -a /etc/apt/sources.list.d/elastic-7.x.list
3. Install Metricbeat
sudo apt-get update && sudo apt-get install metricbeatYUM
- Download GPG key
sudo rpm --import https://packages.elastic.co/GPG-KEY-elasticsearch2. Create a repo file in /etc/yum.repos.d/ with the following content:
sudo tee /etc/yum.repos.d/elastic.repo<<EOF
[elastic-7.x]
name=Elastic repository for 7.x packages
baseurl=https://artifacts.elastic.co/packages/7.x/yum
gpgcheck=1
gpgkey=https://artifacts.elastic.co/GPG-KEY-elasticsearch
enabled=1
autorefresh=1
type=rpm-md
EOF
3. Install Metricbeat
sudo yum -y install metricbeatShip system metrics to Elasticsearch with Metricbeat
- Enable system modules
sudo metricbeat modules enable system2. Link Metricbeat to the remote Elastic search server. Edit the /etc/metricbeat/metricbeat.yml file and edit the hosts details for Kibana and Elasticsearch Output
$ sudo vim /etc/metricbeat/metricbeat.ymlAdd the IP of the instance where Elasticsearch and kibana is running in the host option. In our case, Elasticsearch is running on 172.16.56.5 host:
# =================================== Kibana ===================================

# Starting with Beats version 6.0.0, the dashboards are loaded via the Kibana API.
# This requires a Kibana endpoint configuration.

setup.kibana:

  # Kibana Host
  # Scheme and port can be left out and will be set to the default (http and 5601)
  # In case you specify and additional path, the scheme is required: http://localhost:5601/path
  # IPv6 addresses should always be defined as: https://[2001:db8::1]:5601
  host: "172.16.56.5:5601"

  # Kibana Space ID
  # ID of the Kibana Space into which the dashboards should be loaded. By default,
  # the Default Space will be used.
  #space.id:
Do the same for Elasticsearch# ---------------------------- Elasticsearch Output ----------------------------
output.elasticsearch:
# Array of hosts to connect to.
hosts: ["172.16.56.5:9200"]
3. Setup initial environment – This loads Kibana dashboards, if they are already setup, you can omit the -e flag.
sudo metricbeat setup -eYou should see an attempt to connect to to the Elasticsearch host and Kibana dashboard creation.
$ sudo metricbeat setup -e
......

2020-12-19T09:56:50.585Z	INFO	[index-management]	idxmgmt/std.go:184	Set output.elasticsearch.index to 'metricbeat-7.10.1' as ILM is enabled.
2020-12-19T09:56:50.585Z	INFO	eslegclient/connection.go:99	elasticsearch url: http://172.16.56.5:9200
2020-12-19T09:56:50.586Z	INFO	[publisher]	pipeline/module.go:113	Beat name: master
2020-12-19T09:56:50.612Z	INFO	add_kubernetes_metadata/kubernetes.go:71	add_kubernetes_metadata: kubernetes env detected, with version: v1.18.9 k3s1
2020-12-19T09:56:50.620Z	INFO	eslegclient/connection.go:99	elasticsearch url: http://172.16.56.5:9200
2020-12-19T09:56:50.622Z	INFO	[kubernetes]	kubernetes/util.go:138	kubernetes: Using node master discovered by machine-id matching	{"libbeat.processor": "add_kubernetes_metadata"}
2020-12-19T09:56:50.625Z	INFO	[esclientleg]	eslegclient/connection.go:314	Attempting to connect to Elasticsearch version 7.10.1
Overwriting ILM policy is disabled. Set `setup.ilm.overwrite: true` for enabling.

2020-12-19T09:56:50.681Z	INFO	[index-management]	idxmgmt/std.go:261	Auto ILM enable success.
2020-12-19T09:56:50.683Z	INFO	[index-management.ilm]	ilm/std.go:139	do not generate ilm policy: exists=true, overwrite=false
2020-12-19T09:56:50.683Z	INFO	[index-management]	idxmgmt/std.go:274	ILM policy successfully loaded.
2020-12-19T09:56:50.683Z	INFO	[index-management]	idxmgmt/std.go:407	Set setup.template.name to '{metricbeat-7.10.1 {now/d}-000001}' as ILM is enabled.
2020-12-19T09:56:50.683Z	INFO	[index-management]	idxmgmt/std.go:412	Set setup.template.pattern to 'metricbeat-7.10.1-*' as ILM is enabled.
2020-12-19T09:56:50.683Z	INFO	[index-management]	idxmgmt/std.go:446	Set settings.index.lifecycle.rollover_alias in template to {metricbeat-7.10.1 {now/d}-000001} as ILM is enabled.
2020-12-19T09:56:50.683Z	INFO	[index-management]	idxmgmt/std.go:450	Set settings.index.lifecycle.name in template to {metricbeat {"policy":{"phases":{"hot":{"actions":{"rollover":{"max_age":"30d","max_size":"50gb"}}}}}}} as ILM is enabled.
2020-12-19T09:56:50.686Z	INFO	template/load.go:183	Existing template will be overwritten, as overwrite is enabled.
2020-12-19T09:56:51.231Z	INFO	template/load.go:117	Try loading template metricbeat-7.10.1 to Elasticsearch
2020-12-19T09:56:52.677Z	INFO	template/load.go:109	template with name 'metricbeat-7.10.1' loaded.
2020-12-19T09:56:52.677Z	INFO	[index-management]	idxmgmt/std.go:298	Loaded index template.
2020-12-19T09:56:52.681Z	INFO	[index-management]	idxmgmt/std.go:309	Write alias successfully generated.
Index setup finished.
Loading dashboards (Kibana must be running and reachable)
2020-12-19T09:56:52.681Z	INFO	kibana/client.go:119	Kibana url: http://172.16.56.5:5601
2020-12-19T09:56:53.517Z	INFO	[add_cloud_metadata]	add_cloud_metadata/add_cloud_metadata.go:89	add_cloud_metadata: hosting provider type not detected.
2020-12-19T09:56:53.518Z	INFO	kibana/client.go:119	Kibana url: http://172.16.56.5:5601
2020-12-19T09:58:43.294Z	INFO	instance/beat.go:815	Kibana dashboards successfully loaded.
Loaded dashboards
3. Start and enable Metricbeat
sudo service metricbeat start
sudo systemctl enable metricbeat
You can now visualize your data on Kibana dashboard by navigating to Dashboard.

Setup Filebeat
You can use APT and YUM repositories for Filebeat setup.
APT
#Download GPG key
wget -qO - https://artifacts.elastic.co/GPG-KEY-elasticsearch | sudo apt-key add -

#Install apt-transport-https
sudo apt-get install apt-transport-https

#Add repository
echo "deb https://artifacts.elastic.co/packages/7.x/apt stable main" | sudo tee -a /etc/apt/sources.list.d/elastic-7.x.list

#Install Filebeat
sudo apt-get update && sudo apt-get install filebeat
YUM
##Download GPG key
sudo rpm --import https://packages.elastic.co/GPG-KEY-elasticsearch

##create repo file
sudo tee /etc/yum.repos.d/elastic.repo<<EOF
[elastic-7.x]
name=Elastic repository for 7.x packages
baseurl=https://artifacts.elastic.co/packages/7.x/yum
gpgcheck=1
gpgkey=https://artifacts.elastic.co/GPG-KEY-elasticsearch
enabled=1
autorefresh=1
type=rpm-md
sudo tee /etc/yum.repos.d/elasticsearch.repo<<EOF


##Install filebeat
sudo yum install filebeat
Connect Filebeat to Elastic Stack
Edit the /etc/filebeat/filebeat.yml file and add the remote host and port for Elasticsearch. You can also add the username andpassword of authorized user.
output.elasticsearch:
  hosts: ["elasticsearch-IP:9200"]
  username: "filebeat_internal"
  password: "YOUR_PASSWORD"
Also setup Kibana details on the same file to connect to the host that has Kibana installed:
setup.kibana:
    host: "mykibanahost:5601"
Replace elasticsearch-IP and mykibanahost with the IP of the server Elasticsearch server.
Enable Filebeat modules
List and identify the modules that you want to enable:
filebeat modules listEnable selected modules
filebeat modules enable Setup filebeat environment
filebeat setup -eStart Filebeat service
systemctl start filebeatYou should see a confirmation that dashboars have been created sucsessfully
2020-12-19T11:11:55.731Z	INFO	template/load.go:183	Existing template will be overwritten, as overwrite is enabled.
2020-12-19T11:11:58.580Z	INFO	[add_cloud_metadata]	add_cloud_metadata/add_cloud_metadata.go:89	add_cloud_metadata: hosting provider type not detected.
2020-12-19T11:11:59.711Z	INFO	template/load.go:117	Try loading template filebeat-7.10.1 to Elasticsearch
2020-12-19T11:12:00.075Z	INFO	template/load.go:109	template with name 'filebeat-7.10.1' loaded.
2020-12-19T11:12:00.075Z	INFO	[index-management]	idxmgmt/std.go:298	Loaded index template.
2020-12-19T11:12:00.077Z	INFO	[index-management]	idxmgmt/std.go:309	Write alias successfully generated.
Index setup finished.
Loading dashboards (Kibana must be running and reachable)
2020-12-19T11:12:00.078Z	INFO	kibana/client.go:119	Kibana url: http://172.16.56.5:5601
2020-12-19T11:12:03.995Z	INFO	kibana/client.go:119	Kibana url: http://172.16.56.5:5601
2020-12-19T11:13:13.600Z	INFO	instance/beat.go:815	Kibana dashboards successfully loaded.
Loaded dashboards
Navigate to kibana dashboard to visualize your data.

Conclusion
We have installed Elastic Stack and configured Beats to fetch the metrics and logs. There are other Beats that can be configured using the same process as what has been described above.
Check out these other articles for interesting monitoring tools:
How To Install Netdata on Kubernetes using Helm
Automate Icinga2 Configurations with Icinga Director on CentOS | RHEL 8


