Let’s learn the fundamentals of Grafana Tempo, a distributed tracing backend.
Distributed tracing is the way to get fine-grained information about system performance. It is a way to visualize the lifecycle of a request passing through the application. The application could consist of multiple services present on a single node or distributed across nodes.
So, by using distributed tracing, you can get a consolidated view of all the services. And Grafana Tempo is all about that.
What is Grafana Tempo?
There were some major updates from Grafana Labs at the ObservabilityCon conference this year, and Grafana Tempo was one of them. Grafana Labs has added one more project, “Grafana Tempo,” to their open-source portfolio.
Grafana Tempo is an open-source distributed tracing backend that is highly scalable and easy to use. Tempo is completely compatible with other tracing protocols such as Zipkin, Jaeger, OpenTelemetry, and OpenCensus. Currently, it supports the Tempo data discovery engine in Loki, monitoring platforms such as Prometheus and Grafana. Grafana 7.3 offers a seamless experience between Grafana and Tempo.
Why use Tempo?
Tempo is used to correlate the metrics, traces, and logs. There are situations where a user is getting the same kind of error multiple times. If I want to understand what is happening, I will need to look at the exact traces. But because of downsampling, some valuable information which I might be looking for would have got lost. With Tempo, now we need not downsample distributed tracing data. We can store the complete trace in object storage like S3 or GCS, making Tempo very cost-efficient.
Also, Tempo enables you for faster debugging/troubleshooting by quickly allowing you to move from metrics to the relevant traces of the specific logs which have recorded some issues.
Below are the configuration options used in Tempo.
- Distributor: These are used to configure receiving options to receive spans and then send them to the ingesters.
- Ingester: These are used to create batches of traces and sends them to TempoDB for storage.
- Compactor: It streams blocks from the storage such as S3 or GCS, combines them, and writes them back to the storage.
- Storage: This is used to configure TempoDB. You need to mention the storage backend name (S3 or GCS) with other parameters in this configuration.
- Memberlist: It is used for coordination between Tempo components.
- Authentication/Server: Tempo uses Weaveworks/Common server. It is used to set server configurations.
Tempo Architecture
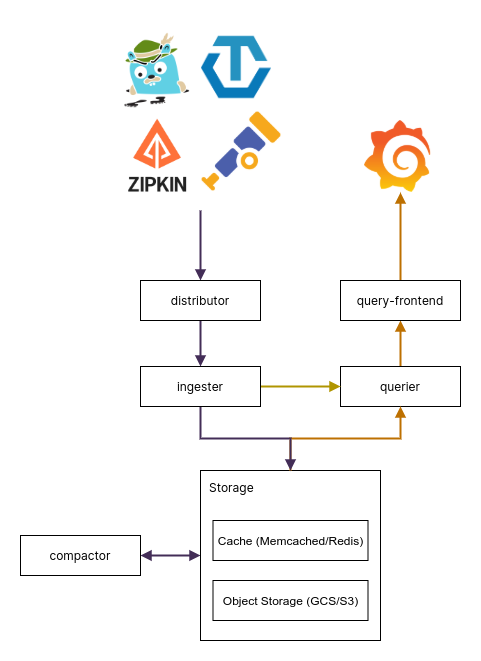
The above diagram shows the working architecture of Grafana Tempo.
Firstly, the distributor receives spans in different formats from Zipkin, Jaeger, OpenTelemetry, OpenCensus and sends these spans to ingesters by hashing the trace ID. Ingester then creates batches of traces which are called blocks.
Then it sends those blocks to the backend storage (S3/GCS). When you have a trace ID that you want to troubleshoot, you will use Grafana UI and put the trace ID in the search bar. Now querier is responsible for getting the details from either ingester or object storage about the trace ID you entered.
Firstly, it checks if that trace ID is present in the ingester; if it doesn’t find it, it then checks the storage backend. It uses a simple HTTP endpoint to expose the traces. Meanwhile, the compactor takes the blocks from the storage, combines them, and sends them back to the storage to reduce the number of blocks in the storage.
Setup Tempo using Docker
In this section, I will set up Grafana Tempo step-by-step using Docker. Firstly, you need a Tempo backend, so set up a docker network.
[[email protected] ~]$ docker network create docker-tempoDownload the Tempo configuration file.
[[email protected] ~]$ curl -o tempo.yaml https://raw.githubusercontent.com/grafana/tempo/master/example/docker-compose/etc/tempo-local.yamlBelow is the list of protocol options you get:
| Protocol | Port |
| Open Telemetry | 55680 |
| Jaeger – Thrift Compact | 6831 |
| Jaeger – Thrift Binary | 6832 |
| Jaeger – Thrift HTTP | 14268 |
| Jaeger – GRPC | 14250 |
| Zipkin | 9411 |
Using the tempo configuration file, run a docker container. Here I am choosing Jaeger – Thrift Compact format (port 6831) to send the traces.
[[email protected] ~]$ docker run -d --rm -p 6831:6831/udp --name tempo -v $(pwd)/tempo-local.yaml:/etc/tempo-local.yaml --network docker-tempo grafana/tempo:latest -config.file=/etc/tempo-local.yamlNow you need to run a Tempo query container. So first, download the tempo query configuration file.
[[email protected] ~]$ curl -o tempo-query.yaml https://raw.githubusercontent.com/grafana/tempo/master/example/docker-compose/etc/tempo-query.yamlUsing the tempo query configuration file, run a docker container.
[[email protected] ~]$ docker run -d --rm -p 16686:16686 -v $(pwd)/tempo-query.yaml:/etc/tempo-query.yaml --network docker-tempo grafana/tempo-query:latest --grpc-storage-plugin.configuration-file=/etc/tempo-query.yamlNow the Jaeger UI will be accessible at http://localhost:16686, as shown below.
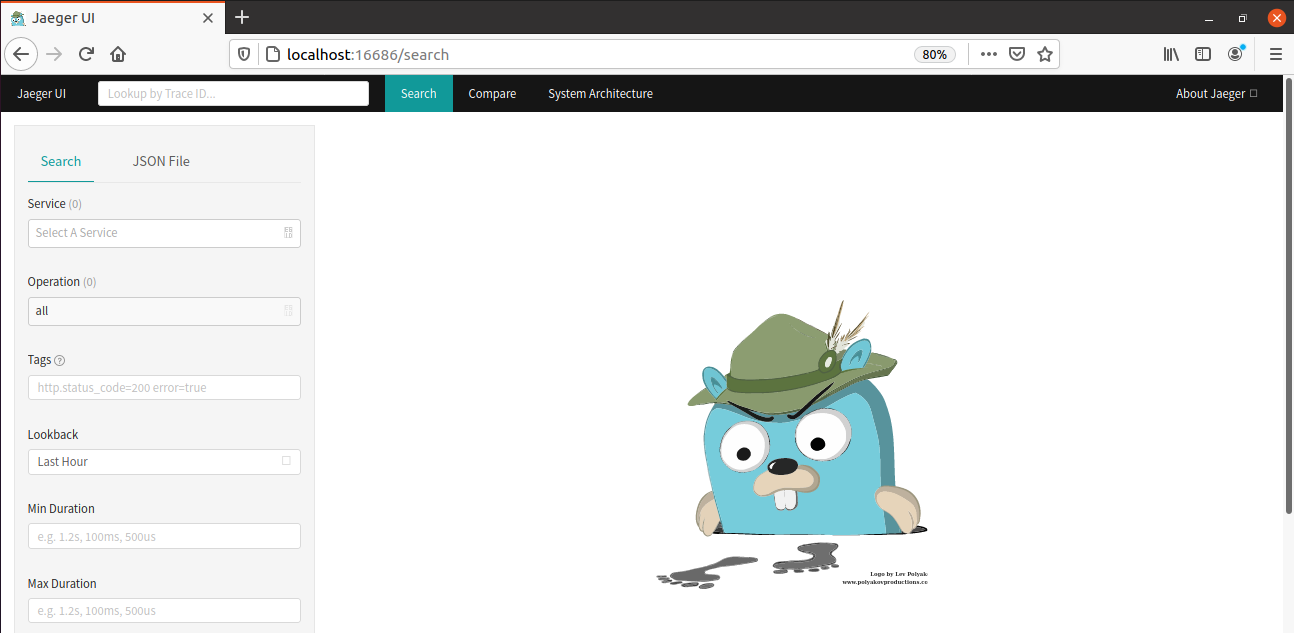
In the search bar, you can add the trace ID from a log that you want to troubleshoot, and it will generate the traces for you.

Running a Demo Application on Tempo
It’s time to run a demo example given by Grafana Tempo. I will run a docker-compose example, so if you are trying the same, you must have docker-compose installed on your machine.
Download the Grafana Tempo zip file: https://github.com/grafana/tempo
Extract it into the home folder and go to the docker-compose directory. You will find multiple examples of docker-compose; I am using the example where an application’s data is stored locally.
[[email protected] ~]$ cd tempo-master/example/docker-compose/
[[email protected] docker-compose]$ ls
docker-compose.loki.yaml docker-compose.s3.minio.yaml docker-compose.yaml etc
example-data readme.md tempo-link.png
Run the command below to start the stack.
[[email protected] docker-compose]$ docker-compose up -d
Starting docker-compose_prometheus_1 ... done
Starting docker-compose_tempo_1 ... done
Starting docker-compose_grafana_1 ... done
Starting docker-compose_tempo-query_1 ... done
Starting docker-compose_synthetic-load-generator_1 ... done
You can see, it has started containers for Grafana, Loki, Tempo, Tempo-query, and Prometheus.
[[email protected] docker-compose]$ docker ps
CONTAINER ID   IMAGE                                      COMMAND                  CREATED          STATUS         PORTS                                                                                                      NAMES
84cd557ce07b   grafana/tempo-query:latest                 "https://geekflare.com/go/bin/query-linux…"   10 minutes ago   Up 4 seconds   0.0.0.0:16686->16686/tcp                                                                                   docker-compose_tempo-query_1
f7cd9cf460d9   omnition/synthetic-load-generator:1.0.25   "./start.sh"             10 minutes ago   Up 4 seconds                                                                                                              docker-compose_synthetic-load-generator_1
6d9d9fbdb8f1   grafana/grafana:7.3.0-beta1                "https://geekflare.com/run.sh"                10 minutes ago   Up 6 seconds   0.0.0.0:3000->3000/tcp                                                                                     docker-compose_grafana_1
d8574ea25028   grafana/tempo:latest                       "https://geekflare.com/tempo -config.file…"   10 minutes ago   Up 6 seconds   0.0.0.0:49173->3100/tcp, 0.0.0.0:49172->14268/tcp                                                          docker-compose_tempo_1
5f9e53b5a09c   prom/prometheus:latest                     "https://geekflare.com/bin/prometheus --c…"   10 minutes ago   Up 6 seconds   0.0.0.0:9090->9090/tcp                                                                                     docker-compose_prometheus_1
You can also go to your browser and verify if Grafana, Jaeger UI, Prometheus are running.
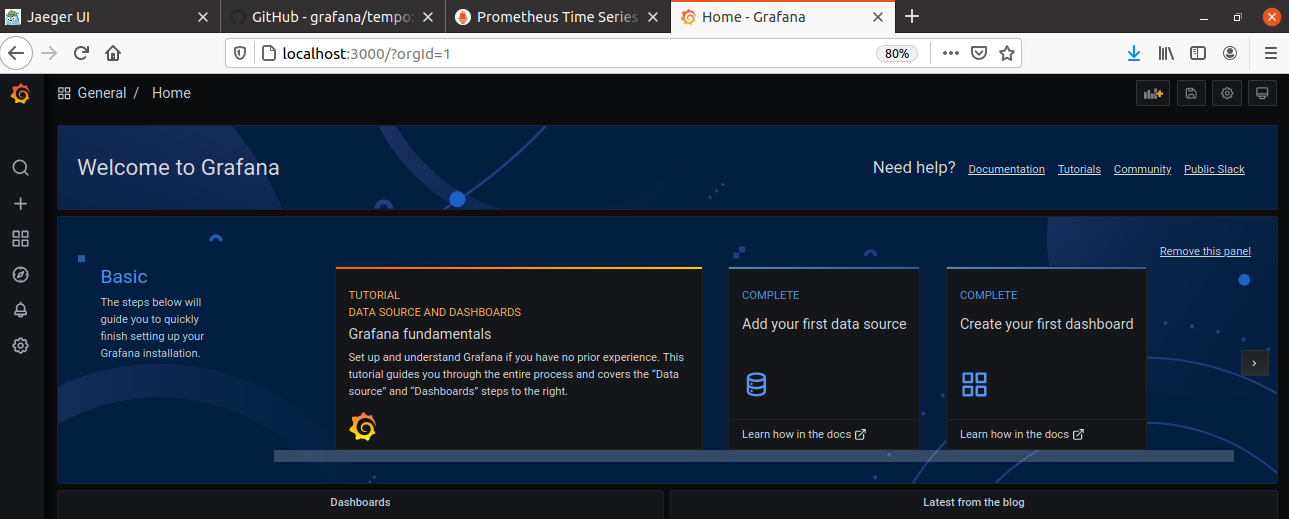

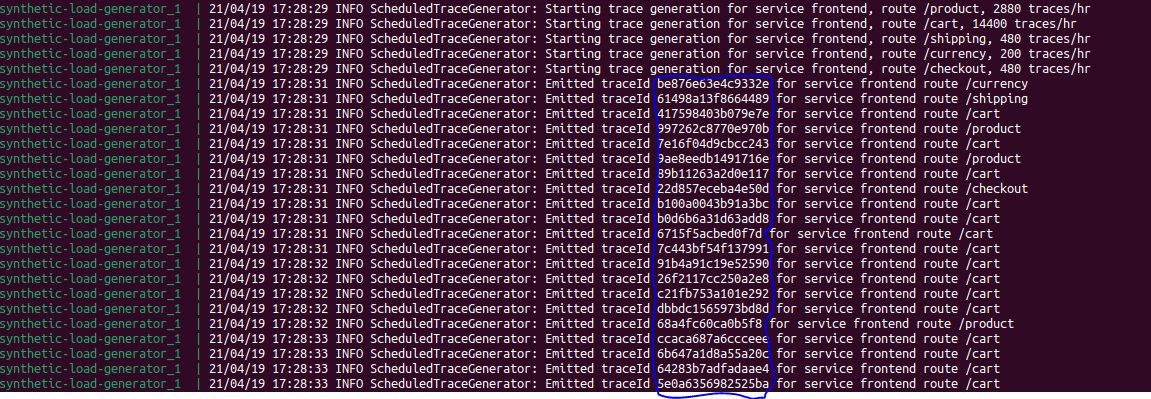
Now synthetic-load-generator running inside a container is generating trace ids which it is putting inside tempo. Run the command below, and you can view the logs.
[[email protected] docker-compose]$ docker-compose logs -f synthetic-load-generator
Attaching to docker-compose_synthetic-load-generator_1
synthetic-load-generator_1
| using params:
--jaegerCollectorUrl http://tempo:14268
synthetic-load-generator_1
| 21/04/17 14:24:34 INFO ScheduledTraceGenerator: Starting trace generation for service frontend, route /product, 2880 traces/hr
synthetic-load-generator_1
| 21/04/17 14:24:34 INFO ScheduledTraceGenerator: Starting trace generation for service frontend, route /cart, 14400 traces/hr
synthetic-load-generator_1
| 21/04/17 14:24:34 INFO ScheduledTraceGenerator: Starting trace generation for service frontend, route /checkout, 480 traces/hr
synthetic-load-generator_1
| 21/04/17 14:24:37 INFO ScheduledTraceGenerator: Emitted traceId 17867942c5e161f2 for service frontend route /currency
synthetic-load-generator_1
| 21/04/17 14:24:37 INFO ScheduledTraceGenerator: Emitted traceId 3d9cc23c8129439f for service frontend route /shipping
synthetic-load-generator_1
These are the trace ids which you need to pass to generate traces.
I am copying one of the trace ids and putting it in the Jaeger UI search bar.

You can see it has successfully generated the traces related to the trace id I provided.
Conclusion
So that was all about Grafana Tempo. Go ahead and start using Tempo to generate traces to understand the metrics and issues in your logs in detail.
Everything is getting captured in Tempo, and you won’t miss out on any detail because of downsampling, which used to happen earlier. Tempo is straightforward for a developer or production team to understand the root cause of the errors or warnings that might occur in the logs.


