Monit is a free, open-source, handy monitoring program that allows you to manage and monitor server processes, files, directories, checksums, etc. Monit also monitors various services such as Apache, Nginx, MySQL, FTP, SSH, Sendmail, etc. It offers a web-based interface and a command-line program to monitor all processes and services. It can perform automatic maintenance and repairs and take appropriate action in the event of a service failure. You can also use it to monitor TCP/IP ports of remote hosts, server protocols, and ping.
This article will show you how to install and configure the Monit monitoring tool under Debian.
Requirements
- A server running Debian Linux.
- A root password is set up on the server.
Install Monit on Debian
By default, the Monit package is in the standard Debian repository. You can install it with the following command:
apt-get install monit -y
Once Monit is installed, start the Monit service and enable it so that it starts when the system reboots:
systemctl start monit
systemctl enable monit
You can also check the status of Monit with the following command:
systemctl status monit
You will get the following output:
? monit.service - LSB: service and resource monitoring daemon
     Loaded: loaded (/etc/init.d/monit; generated)
     Active: active (running) since Mon 2021-11-01 03:14:11 UTC; 36s ago
       Docs: man:systemd-sysv-generator(8)
    Process: 1007 ExecStart=/etc/init.d/monit start (code=exited, status=0/SUCCESS)
      Tasks: 1 (limit: 2341)
     Memory: 1.7M
        CPU: 24ms
     CGroup: /system.slice/monit.service
             ??1012 /usr/bin/monit -c /etc/monit/monitrc

Nov 01 03:14:11 debian11 systemd[1]: Starting LSB: service and resource monitoring daemon...
Nov 01 03:14:11 debian11 monit[1007]: Starting daemon monitor: monit.
Nov 01 03:14:11 debian11 systemd[1]: Started LSB: service and resource monitoring daemon.
Configure Monit
Next, edit Monit’s default configuration file and set the admin password and port. You can do this with the following command:
nano /etc/monit/monitrc
Change the following lines:
set httpd port 2812 and
allow admin:monit # require user 'admin' with password 'monit'
Save and close the file and restart the Monit service to apply the changes:
systemctl restart monit
By default, Monit listens on port 2812, you can check this with the following command:
ss -antpl | grep monit
You should see the following output:
LISTEN 0      1024         0.0.0.0:2812      0.0.0.0:*    users:(("monit",pid=1324,fd=6))
LISTEN 0      1024            [::]:2812         [::]:*    users:(("monit",pid=1324,fd=7))
You can also check your system status with the following command:
monit status
You will get the following output:
Monit 5.27.2 uptime: 0m

System 'debian11'
  status                       OK
  monitoring status            Monitored
  monitoring mode              active
  on reboot                    start
  load average                 [0.14] [0.11] [0.04]
  cpu                          0.0%usr 0.0%sys 0.0%nice 0.0%iowait 0.0%hardirq 0.0%softirq 0.0%steal 0.0%guest 0.0%guestnice
  memory usage                 195.9 MB [9.9%]
  swap usage                   0 B [0.0%]
  uptime                       2m
  boot time                    Mon, 01 Nov 2021 03:13:35
  filedescriptors              512 [0.0% of 9223372036854775807 limit]
  data collected               Mon, 01 Nov 2021 03:15:35
Add monitoring services
Next, you need to add the services you want to monitor with Monit. In this section, we’ll add the Apache and ProFTP services to Monit.
Add Apache monitoring service
Monit provides a default predefined template for some processes and services. All these templates are located in the /etc/monit/conf-available/ directory. By default, the Apache template is available, so you only need to activate it with the following command:
ln -s /etc/monit/conf-available/apache2 /etc/monit/conf-enabled/
Then restart the Monit service to apply the changes:
systemctl restart monit
Adding the ProFTP monitoring service
By default, the template for the ProFTP service is not available. Therefore, you need to create it with your favorite editor.
nano /etc/monit/conf-available/proftpd
Add the following lines:
check process proftpd with pidfile /var/run/proftpd.pid
   start program = "https://vitux.com/etc/init.d/proftpd start"
   stop  program = "https://vitux.com/etc/init.d/proftpd stop"
if failed port 21 protocol ftp then restart
Save and close the file and activate the ProFTP service with the following command:
ln -s /etc/monit/conf-available/proftpd /etc/monit/conf-enabled
You can check the template for syntax errors with the following command:
monit -t
You will receive the following output:
Control file syntax OK
Then restart the Monit service to apply the changes:
systemctl restart monit
Accessing the Monit web interface
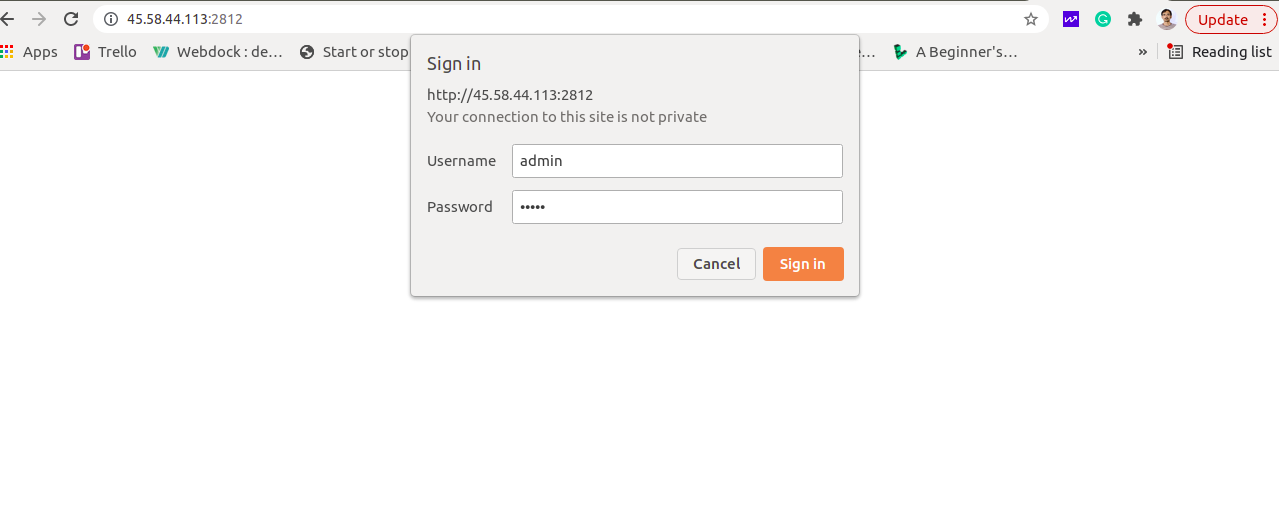
Now open your web browser and call up the Monit web interface via the URL http://your-server-ip-2812. You will be prompted to enter a Monit admin username and password (see below):

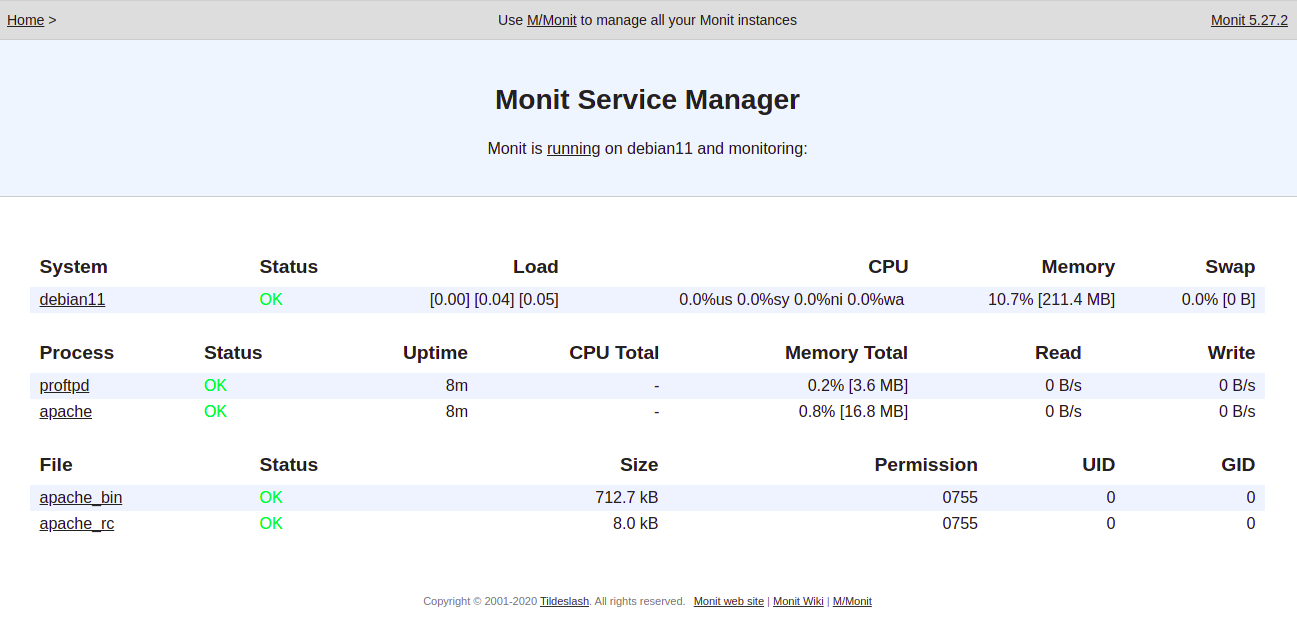
Enter your admin username and password and click the Log In button. On the following screen you should see all your services:

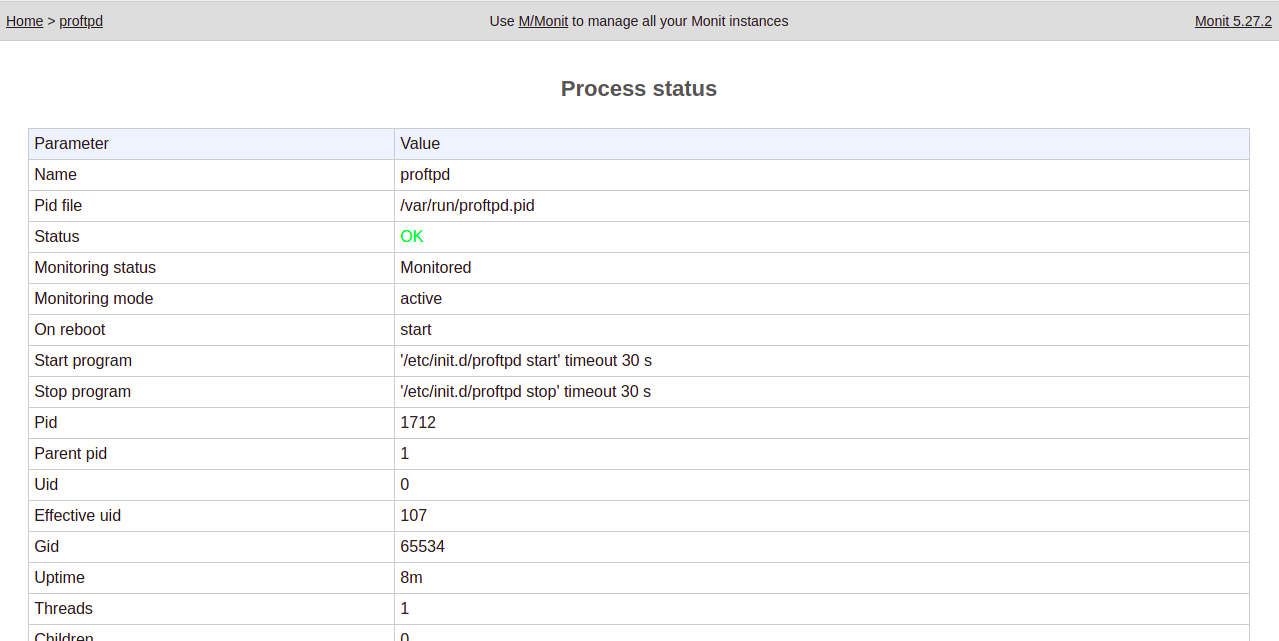
Click on the Apache service. You should see the detailed information about Apache on the following screen:

Monitoring Monit from the command line
Monit allows you to monitor all configured services via the command line interface.
You can see a summary of monit by running the following command:
monit summary
You should see the following output:
Monit 5.27.2 uptime: 0m
????????????????????????????????????????????????????????????????????????????????
? Service Name                    ? Status                     ? Type          ?
????????????????????????????????????????????????????????????????????????????????
? debian11                        ? OK                         ? System        ?
????????????????????????????????????????????????????????????????????????????????
? proftpd                         ? OK                         ? Process       ?
????????????????????????????????????????????????????????????????????????????????
? apache                          ? OK                         ? Process       ?
????????????????????????????????????????????????????????????????????????????????
? apache_bin                      ? OK                         ? File          ?
????????????????????????????????????????????????????????????????????????????????
? apache_rc                       ? OK                         ? File          ?
????????????????????????????????????????????????????????????????????????????????
You can also view the status of all services with the following command:
monit status
You can get detailed information about all services in the following output:
Monit 5.27.2 uptime: 0m

Process 'proftpd'
  status                       OK
  monitoring status            Monitored
  monitoring mode              active
  on reboot                    start
  pid                          1712
  parent pid                   1
  uid                          0
  effective uid                107
  gid                          65534
  uptime                       8m
  threads                      1
  children                     0
  cpu                          -
  cpu total                    -
  memory                       0.2% [3.6 MB]
  memory total                 0.2% [3.6 MB]
  security attribute           unconfined
  filedescriptors              5 [0.5% of 1024 limit]
  total filedescriptors        5
  read bytes                   0 B/s [11.6 kB total]
  disk read bytes              0 B/s [0 B total]
  disk read operations         0.0 reads/s [55 reads total]
  write bytes                  0 B/s [5.8 kB total]
  disk write bytes             0 B/s [4 kB total]
  disk write operations        0.0 writes/s [17 writes total]
  port response time           3.279 ms to localhost:21 type TCP/IP protocol FTP
  data collected               Mon, 01 Nov 2021 03:25:03

Process 'apache'
  status                       OK
  monitoring status            Monitored
  monitoring mode              active
  on reboot                    start
  pid                          2021
  parent pid                   1
  uid                          0
  effective uid                0
  gid                          0
  uptime                       8m
  threads                      1
  children                     2
  cpu                          -
  cpu total                    -
  memory                       0.2% [4.4 MB]
  memory total                 0.8% [16.8 MB]
  security attribute           unconfined
  filedescriptors              9 [0.1% of 8192 limit]
  total filedescriptors        33
  read bytes                   0 B/s [71.5 kB total]
  disk read bytes              0 B/s [0 B total]
  disk read operations         0.0 reads/s [26 reads total]
  write bytes                  0 B/s [458 B total]
  disk write bytes             0 B/s [4 kB total]
  disk write operations        0.0 writes/s [4 writes total]
  port response time           1.233 ms to localhost:80/server-status type TCP/IP protocol HTTP
  data collected               Mon, 01 Nov 2021 03:25:03

File 'apache_bin'
  status                       OK
  monitoring status            Monitored
  monitoring mode              active
  on reboot                    start
  permission                   755
  uid                          0
  gid                          0
  size                         712.7 kB
  access timestamp             Mon, 01 Nov 2021 03:16:32
  change timestamp             Mon, 01 Nov 2021 03:16:33
  modify timestamp             Thu, 07 Oct 2021 17:49:44
  checksum                     a2bdd395ebb85b5781d0caa869abd07d (MD5)
  data collected               Mon, 01 Nov 2021 03:25:03

File 'apache_rc'
  status                       OK
  monitoring status            Monitored
  monitoring mode              active
  on reboot                    start
  permission                   755
  uid                          0
  gid                          0
  size                         8.0 kB
  access timestamp             Mon, 01 Nov 2021 03:16:32
  change timestamp             Mon, 01 Nov 2021 03:16:38
  modify timestamp             Sat, 08 Aug 2020 07:47:06
  checksum                     9d22fb30358e61a6f190a0d09c5120bf (MD5)
  data collected               Mon, 01 Nov 2021 03:25:03

System 'debian11'
  status                       OK
  monitoring status            Monitored
  monitoring mode              active
  on reboot                    start
  load average                 [0.00] [0.04] [0.05]
  cpu                          0.0%usr 0.0%sys 0.0%nice 0.0%iowait 0.0%hardirq 0.0%softirq 0.0%steal 0.0%guest 0.0%guestnice
  memory usage                 211.4 MB [10.7%]
  swap usage                   0 B [0.0%]
  uptime                       12m
  boot time                    Mon, 01 Nov 2021 03:13:35
  filedescriptors              640 [0.0% of 9223372036854775807 limit]
  data collected               Mon, 01 Nov 2021 03:25:03
Conclusion
Congratulations! You have successfully installed and configured the monitoring tool Monit under Debian. You can now add more services to Monit and monitor them via the web-based interface. If you have any questions, please feel free to contact me.


