Monitor your site uptime, latency with Google Cloud Monitoring from multiple locations and get notified when there is an issue.
Google Cloud Operations suite is a collection of tools to monitor, troubleshoot, and enhance the performance of your cloud infrastructure or application. Previously, you may have known it as “Stackdriver.”
As a part of its offering, it provides end-to-end monitoring solutions using the Google Cloud Monitoring toolset. You can choose to use it for free or pay for it if you want to get rid of the limits to the uptime-check configurations added.
The cost will depend on your usage. So, you may want to head to its official pricing page to explore more about it.
While there are several configuration options and advanced monitoring capabilities that you get with Google’s Cloud monitoring tools, here, we focus on monitoring website uptime and latency.
Of course, you can try out other monitoring solutions available like StatusCake; however, if you are already using GCP, then you don’t need a third-party service for uptime checks. Furthermore, you get to utilize advanced functionalities that may not be available with different website monitoring services.
Getting Started with Google Cloud Monitoring
For starters, we assume that you have a Google Cloud account; if not, you can get it started with a FREE trial. You will have to add a payment method at the end of the trial to continue using the services.
Now, all you have to do is:
- Log in to the Google Cloud Monitoring console.
- Head to the sidebar and click on “Uptime checks.”
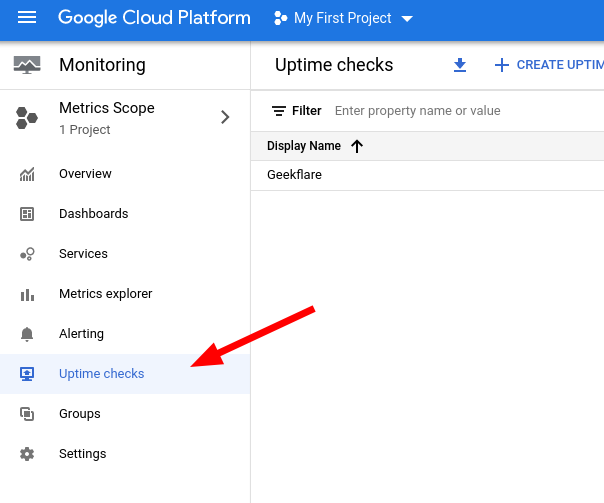
Next, you need to add an uptime check configuration.
Add an Uptime Check Configuration
You need to proceed through four steps to add an uptime monitor for your website successfully.
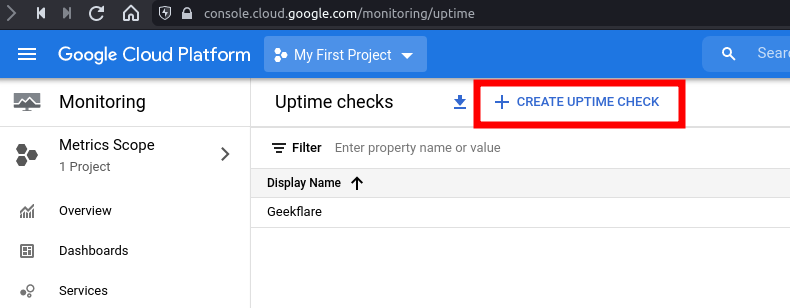
1. In the Uptime check section, click on “CREATE UPTIME CHECK” to get started.
2. You need to add a name to your configuration and the target information to specify what you need to monitor.
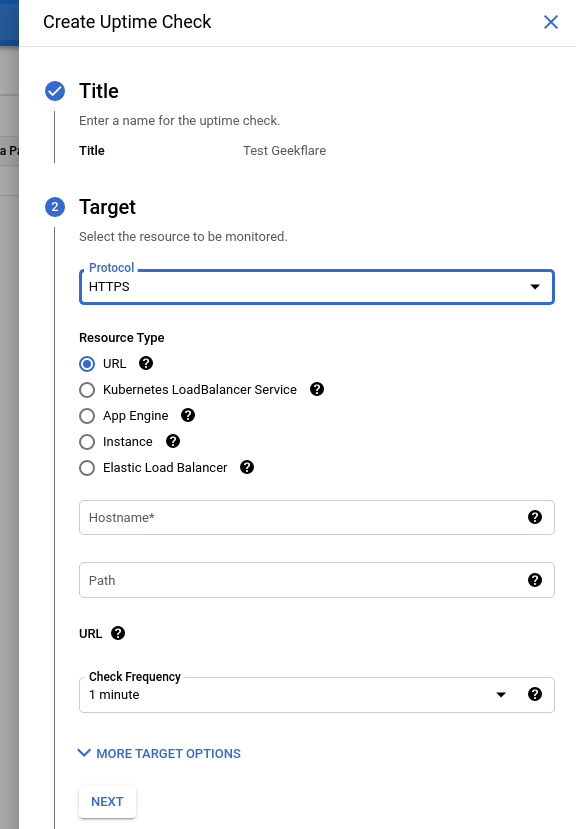
Here, we focus on a website. So, most likely, we will need to use the HTTPS protocol with the homepage URL as the hostname.
For this example, I added geekflare.com as the hostname without specifying a path. If you want to monitor a specific directory or sub-page, you can do that by entering the path for it.
It also lets you customize the frequency of the uptime check, 1 minute being the default (and the fastest), with the option to use up to 15 minute time intervals.
You can choose to utilize the advanced target options to monitor from a specific location and a port, along with enabling SSL validation and specifying custom headers.
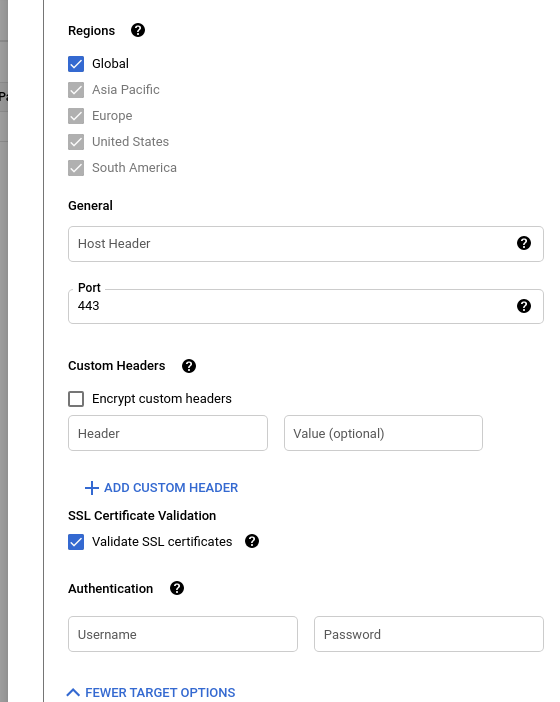
Some of the options that you notice in the image include:
- HTTP host header
- Port number (default is 443)
- Response content validation
- Check uptime from (Global is selected default)
- Custom header validation
- Authentication
3. Next, you can choose to tweak the validation settings. In other words, you can set a custom response timeout for the request to wait and check if the website is up.
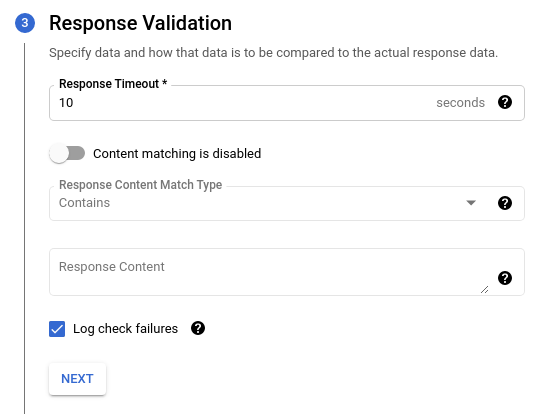
If you want to look for a specific HTML tag or similar, you can enable content matching. But, this isn’t required for most of the primary website uptime monitoring needs.
By default, if there’s a failure in the uptime check, it will be stored in Cloud Logging, which has a free limit and could cost you if you want to keep track of unlimited logs.
You may want to keep it enabled to check your previous activities. But, you can choose to disable it if you see fit.
Now, all the vital options to create an uptime service have been configured, proceed to the next step to create an alert and notification service.
Create Google Monitoring Alert & Notification
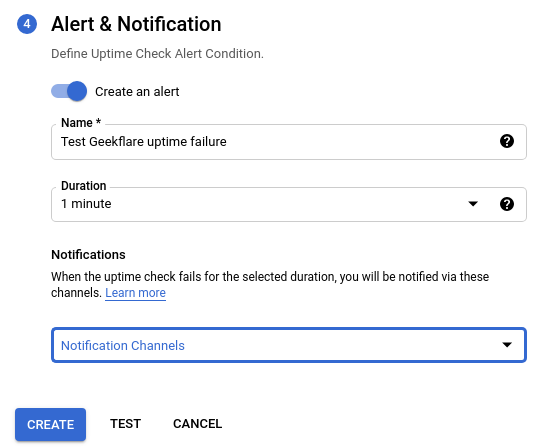
To get notified of a failure, you will have to set up alerts. You need to specify a name and the duration of notifications (between 1 minute to 23 hours 30 minutes) which you will receive upon a failure.
However, it would help if you had a notification channel set up before proceeding with the alert. If you haven’t created any, head to the notification channel manager page separately to explore the options available and set them up as needed.
You have a variety of options that include:
- Slack
- Google Cloud Mobile App
- Webhooks
- SMS
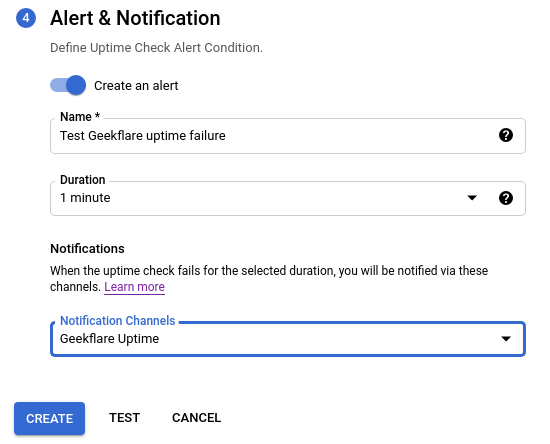
Once that is set up, you will have to select the notification channel to complete the uptime check configuration.
You can test it to see if you have your configurations right. If everything’s good, you will receive a “Responded with “200 (OK)” in xx ms.” message with a green tick.
And, then you can proceed to add the configuration by clicking on “CREATE.” This is how it should look like:
Once you create it, the monitoring will take a few minutes to start. You can notice the green check marks on all the regions (or a specific region) as per your uptime configuration:

Checking URL Latency
You just have to click on the uptime check you created to see the data collected about the latency and uptime.
You can look at the detailed historical latency graph to analyze the uptime and performance of your website.
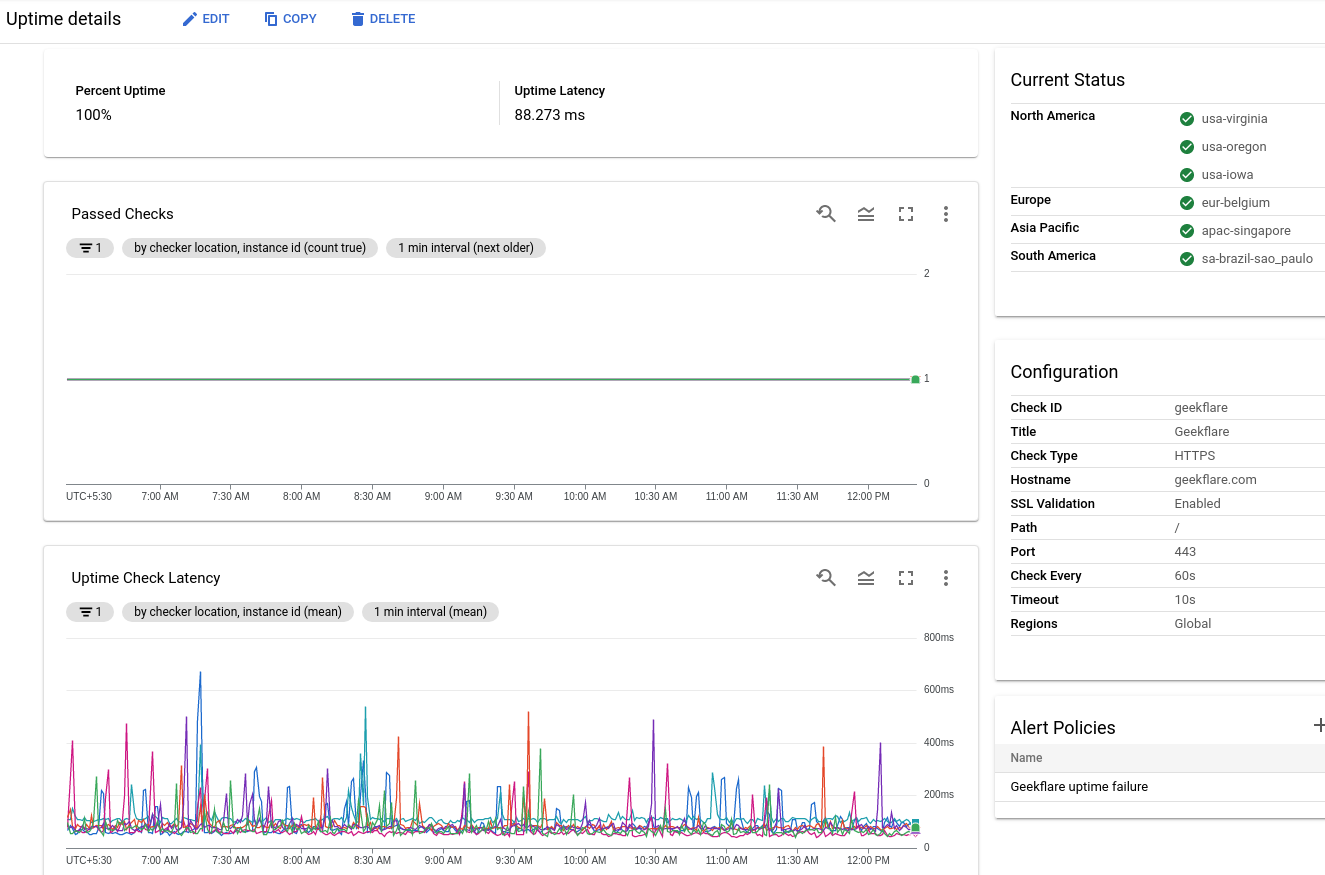
You can use fine-grained latency information to troubleshoot and optimize the site performance as well.
This should give you a good idea of performing checks using Google Cloud Monitoring.
Interested in learning Google Cloud? You may check out this fantastic course to get Google Cloud certified.

