
CloudWatch metrics for SQS queues are collected and pushed to CloudWatch at one-minute intervals automatically. These metrics are provided at no charge in CloudWatch for both standard and FIFO queues. Following are the metrics available in Cloudwatch to view and analyze SQS queues.
- ApproximateAgeOfOldestMessage: This metric returns the approximate age of the oldest non deleted message in the queue.
- ApproximateNumberOfMessagesDelayed: This gives the number of messages in the queue that are not available for reading immediately and delayed.
- ApproximateNumberOfMessagesNotVisible: It is the number of messages that are in flight, i.e. they have been sent to a client but not yet deleted or not yet reached to the client.
- ApproximateNumberOfMessagesVisible: It is the number of messages available in the queue for retrieval.
- NumberOfEmptyReceives: It is the count of ReceiveMessage API calls that did not return a message.
- NumberOfMessagesDeleted: This returns the number of messages deleted from the queue.
- NumberOfMessagesReceived: It is the number of messages returned by calls to the ReceiveMessage action.
- NumberOfMessagesSent: It is the number of messages added to a queue.
- SentMessageSize: This gives the size of messages added to a queue.
For more details on the available metrics, click here to visit the official documentation.
In this article, we will create an alarm for the “NumberOfMessagesSent” metric. Before we proceed, it is assumed that you have some basic understanding of SQS queues, SNS Topics. It is also assumed that you at least have 1 active SQS queue and an SNS topic with a subscription.
Pre-requisites
- AWS Account(Create if you don’t have one).
- SQS Queue.
- SNS Topic(Click here to learn to create an SNS Topic using Cloudformation)
What will we do?
- Login to AWS.
- Create an alarm for the SQS queue.
Login to AWS
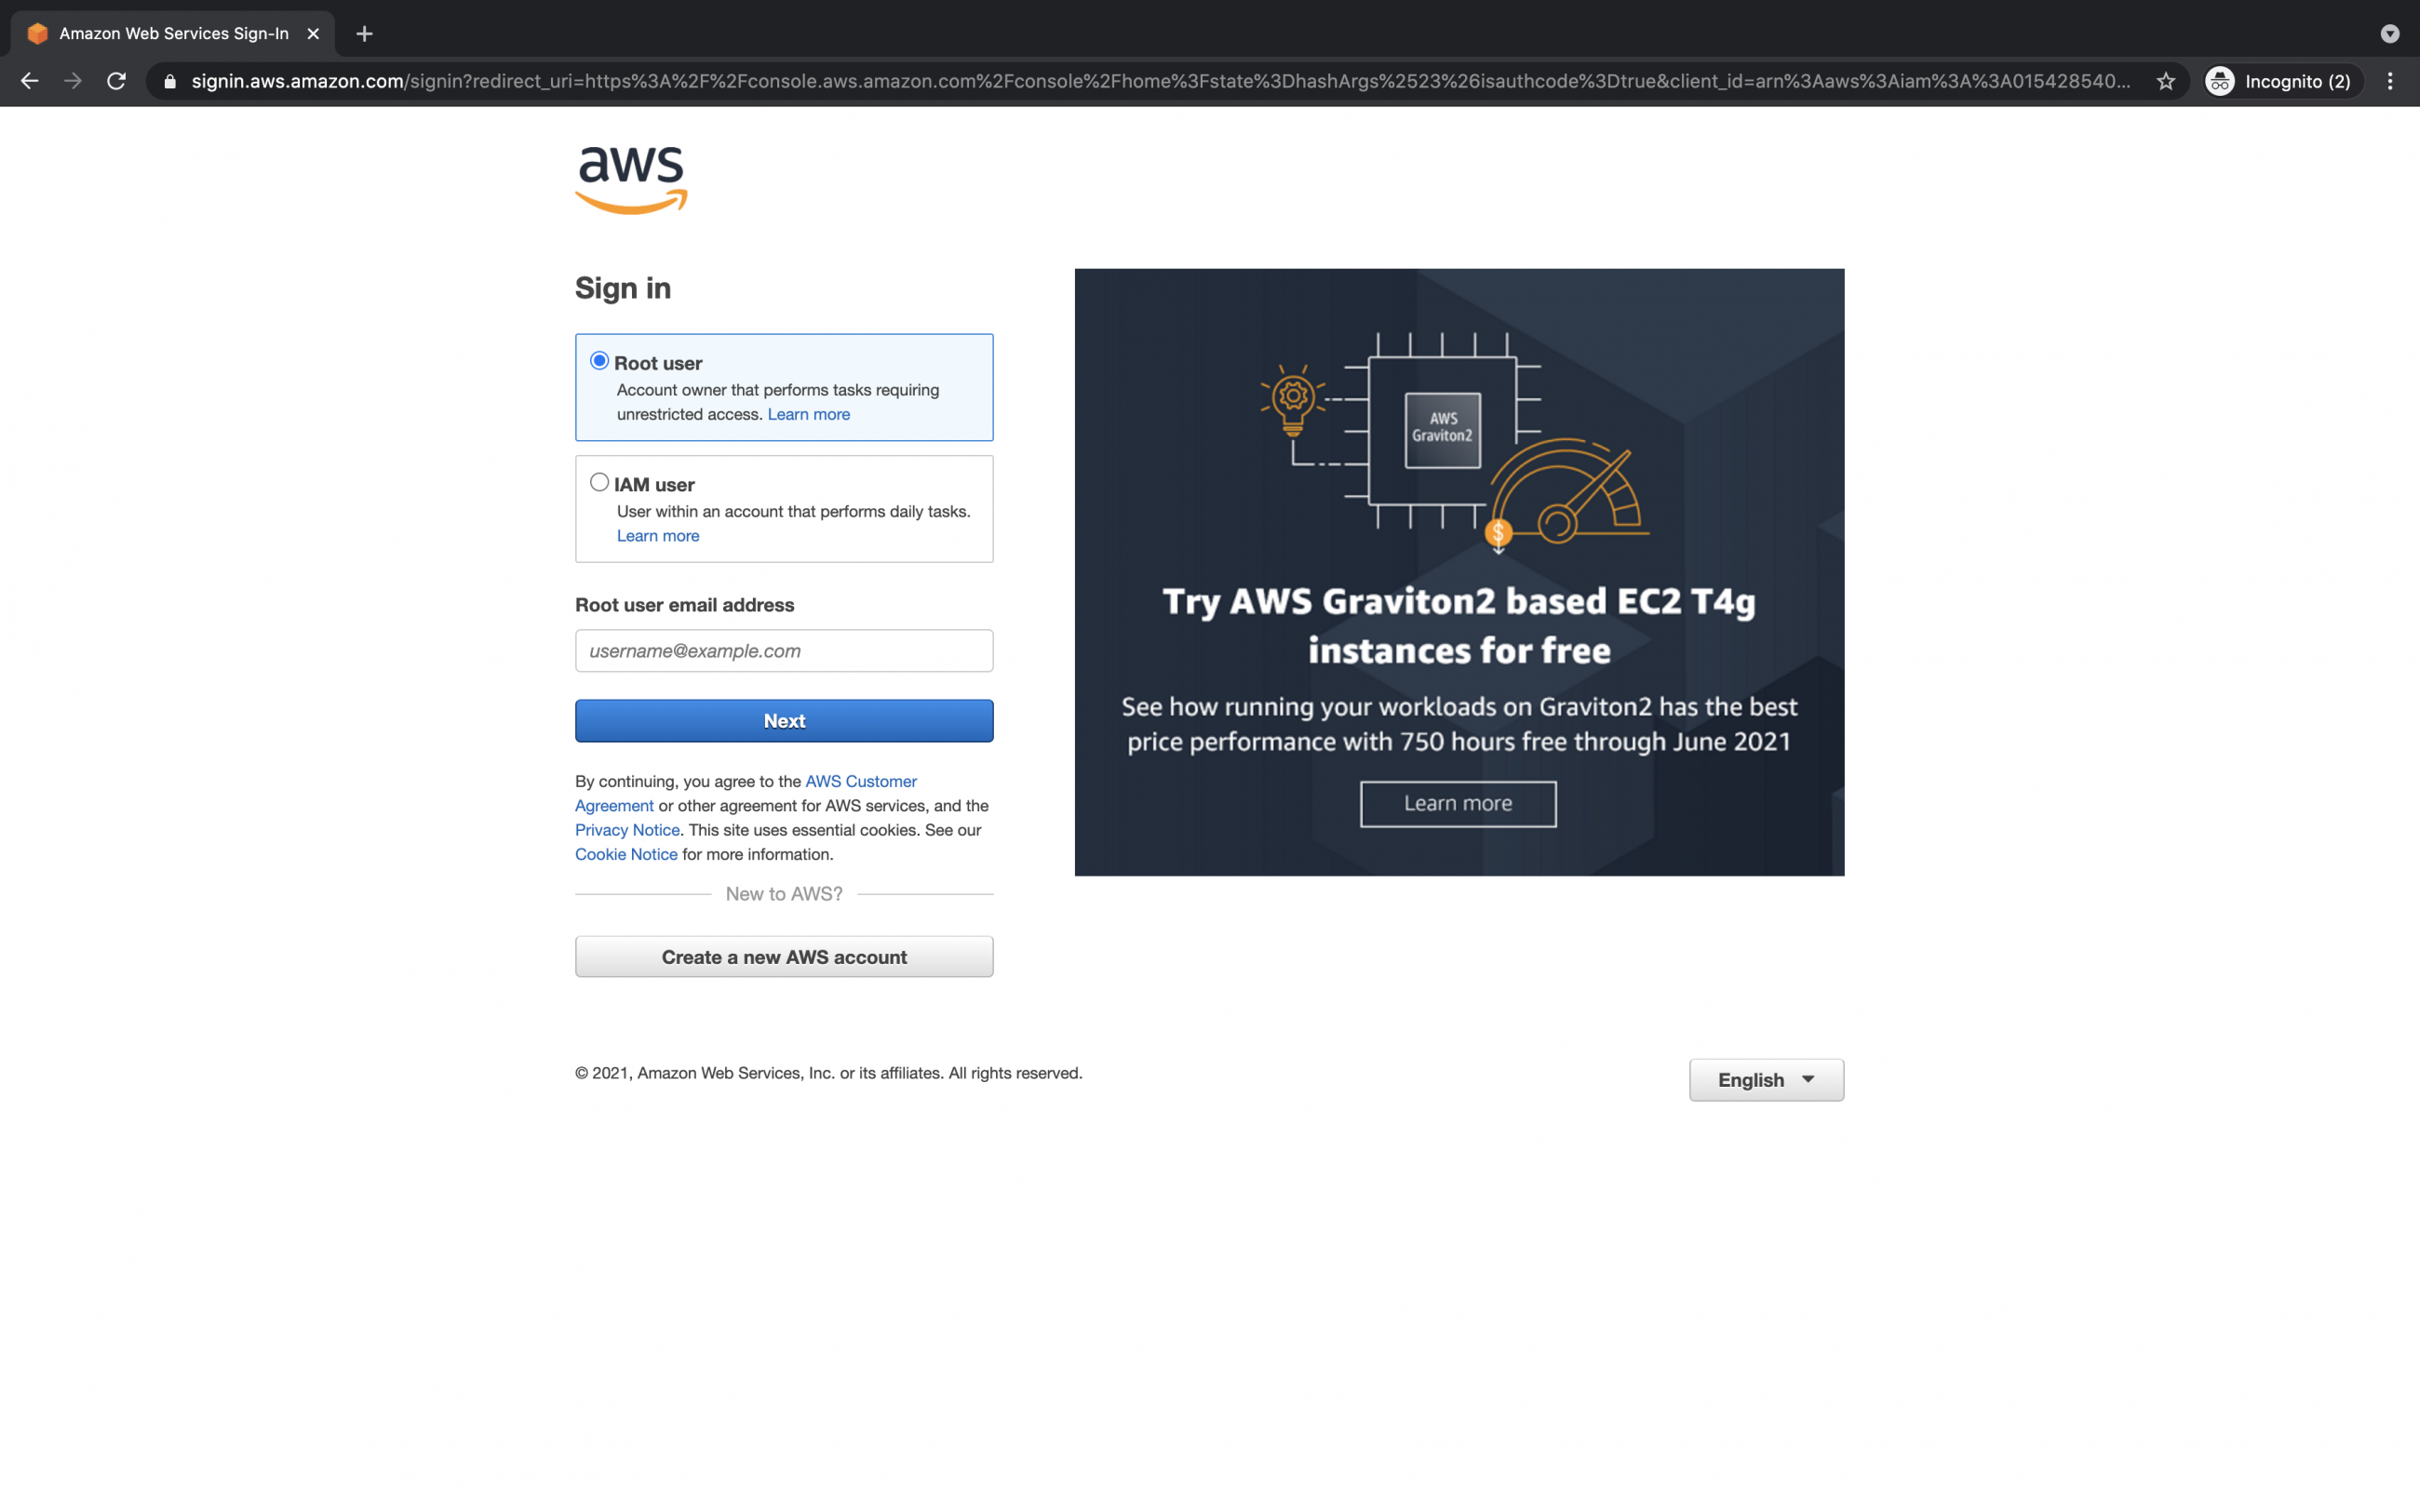
Click here to go to AWS Login Page.
You will see the login page as follows when you hit the above link. Enter your credentials to login into your AWS account.
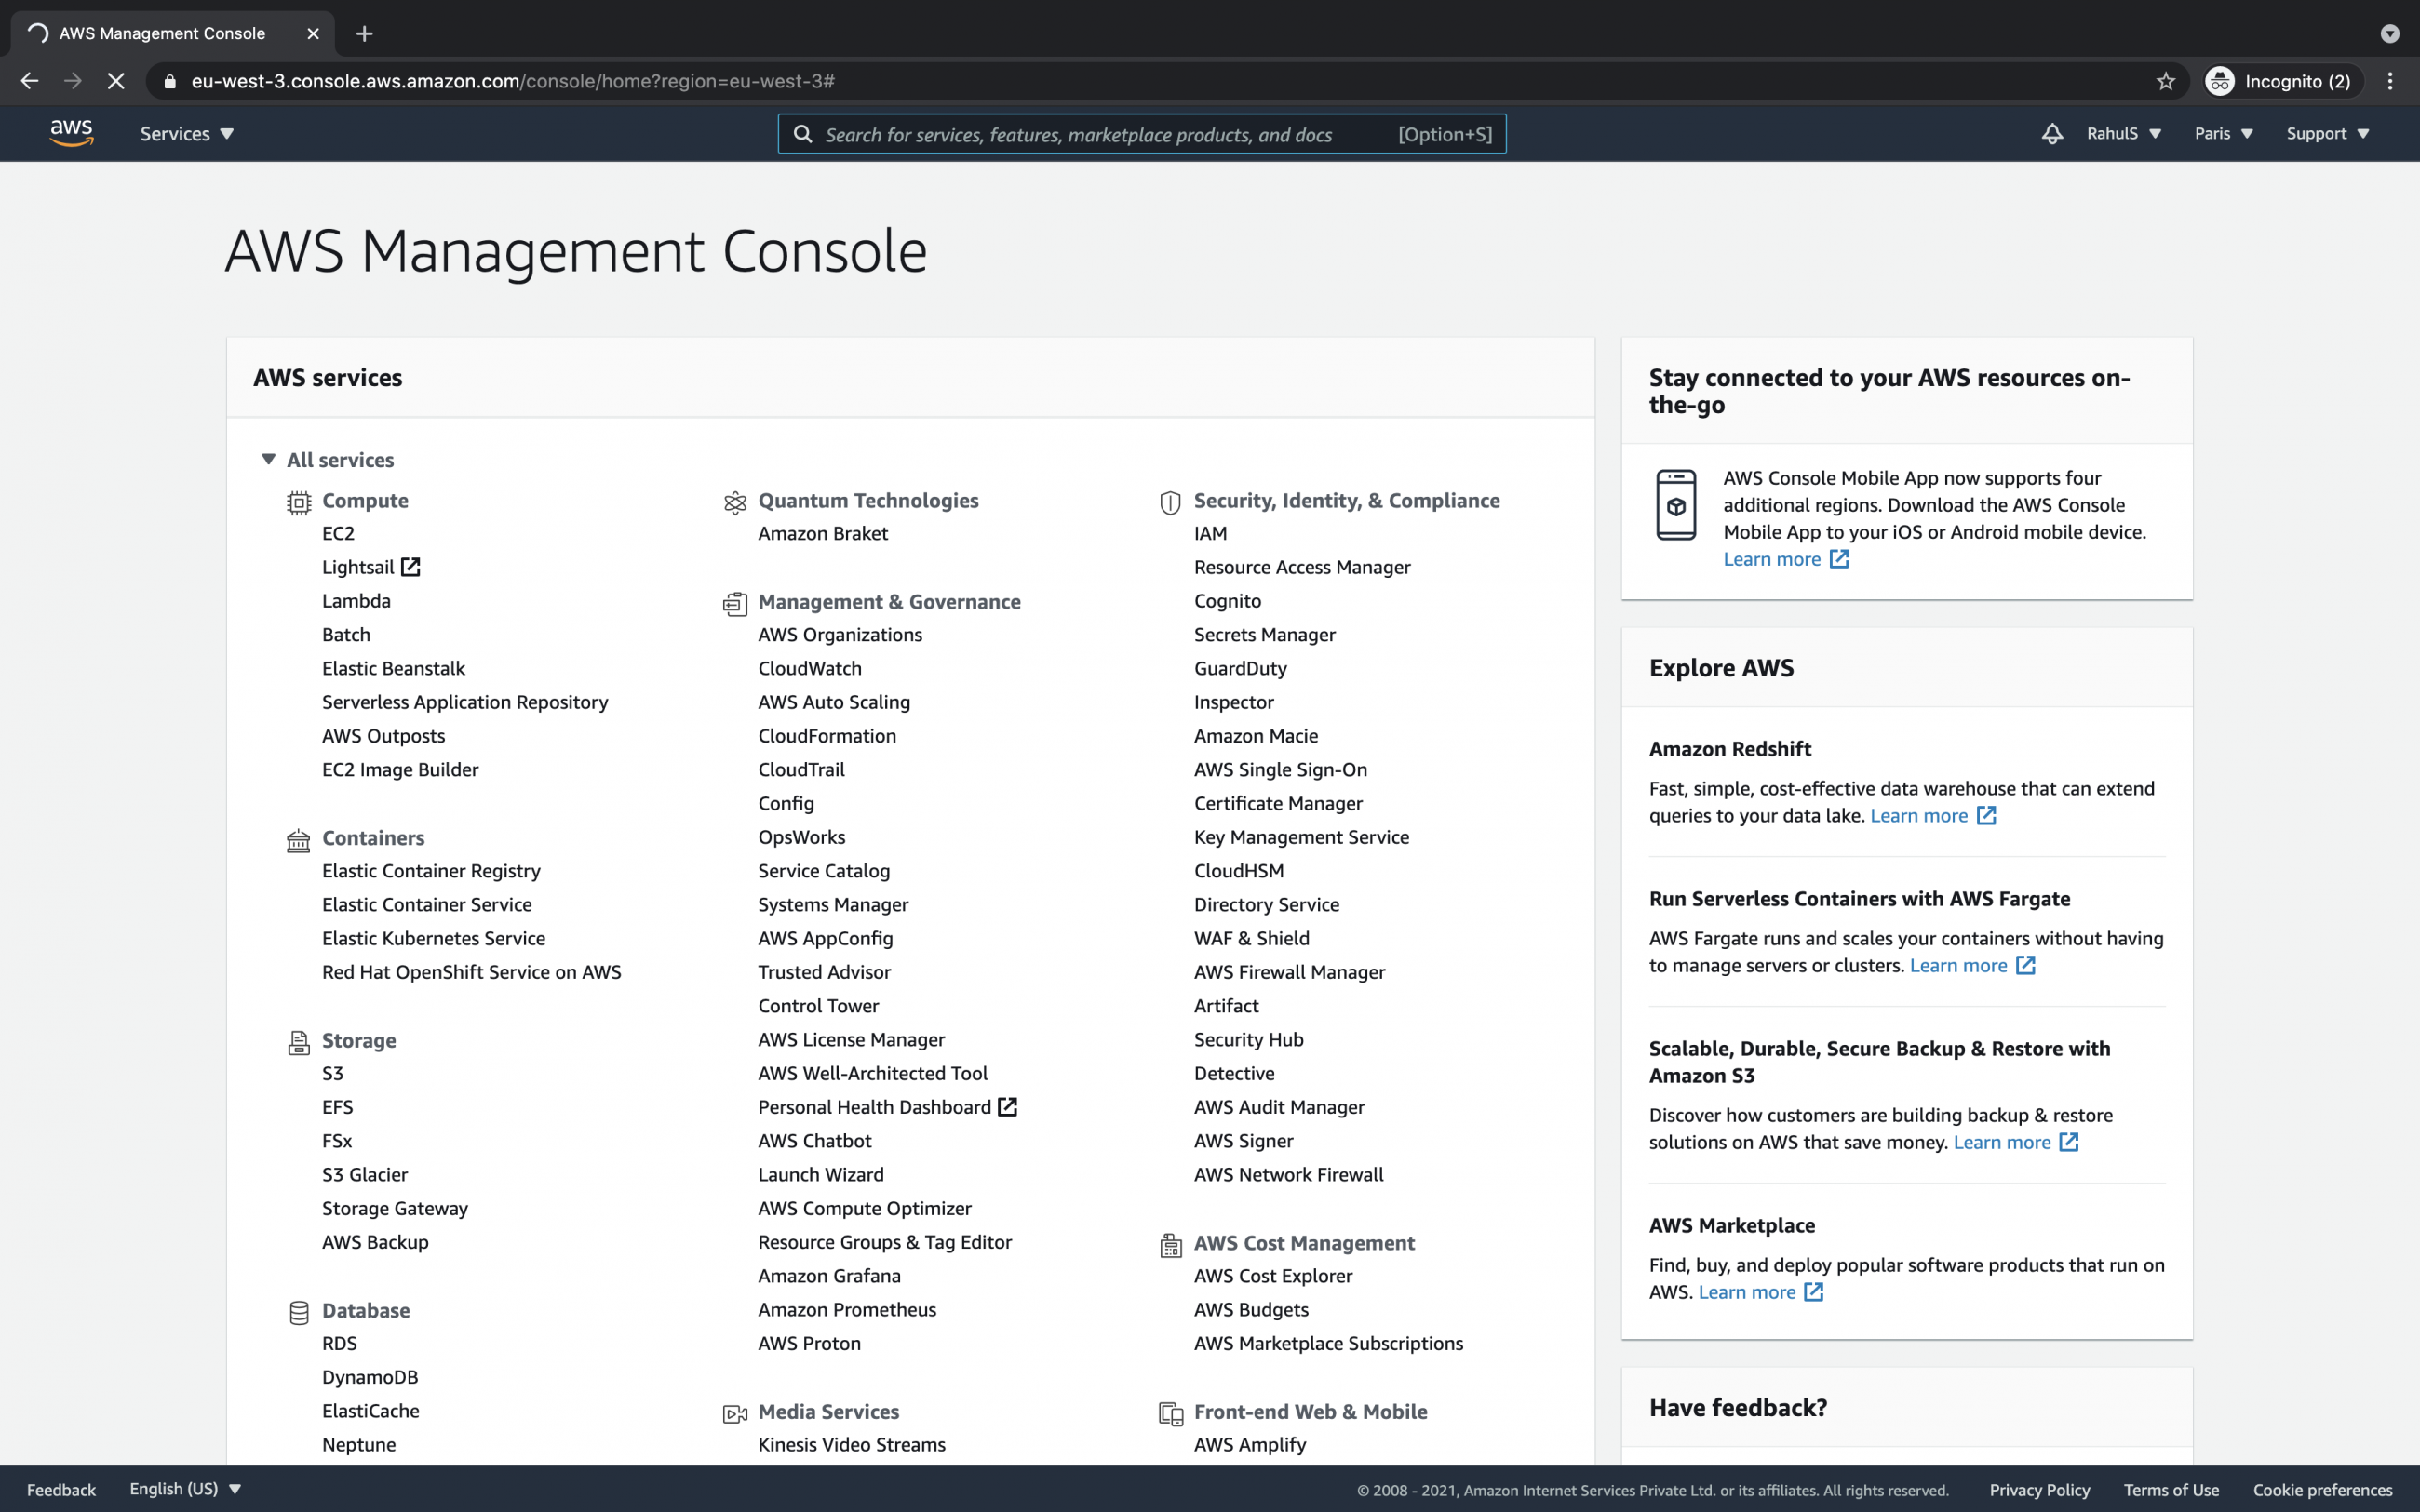
Once you log in successfully into your account, you will see the main AWS Management Console as follows. Here, you can choose the desired region.
Create an alarm for the SQS queue.
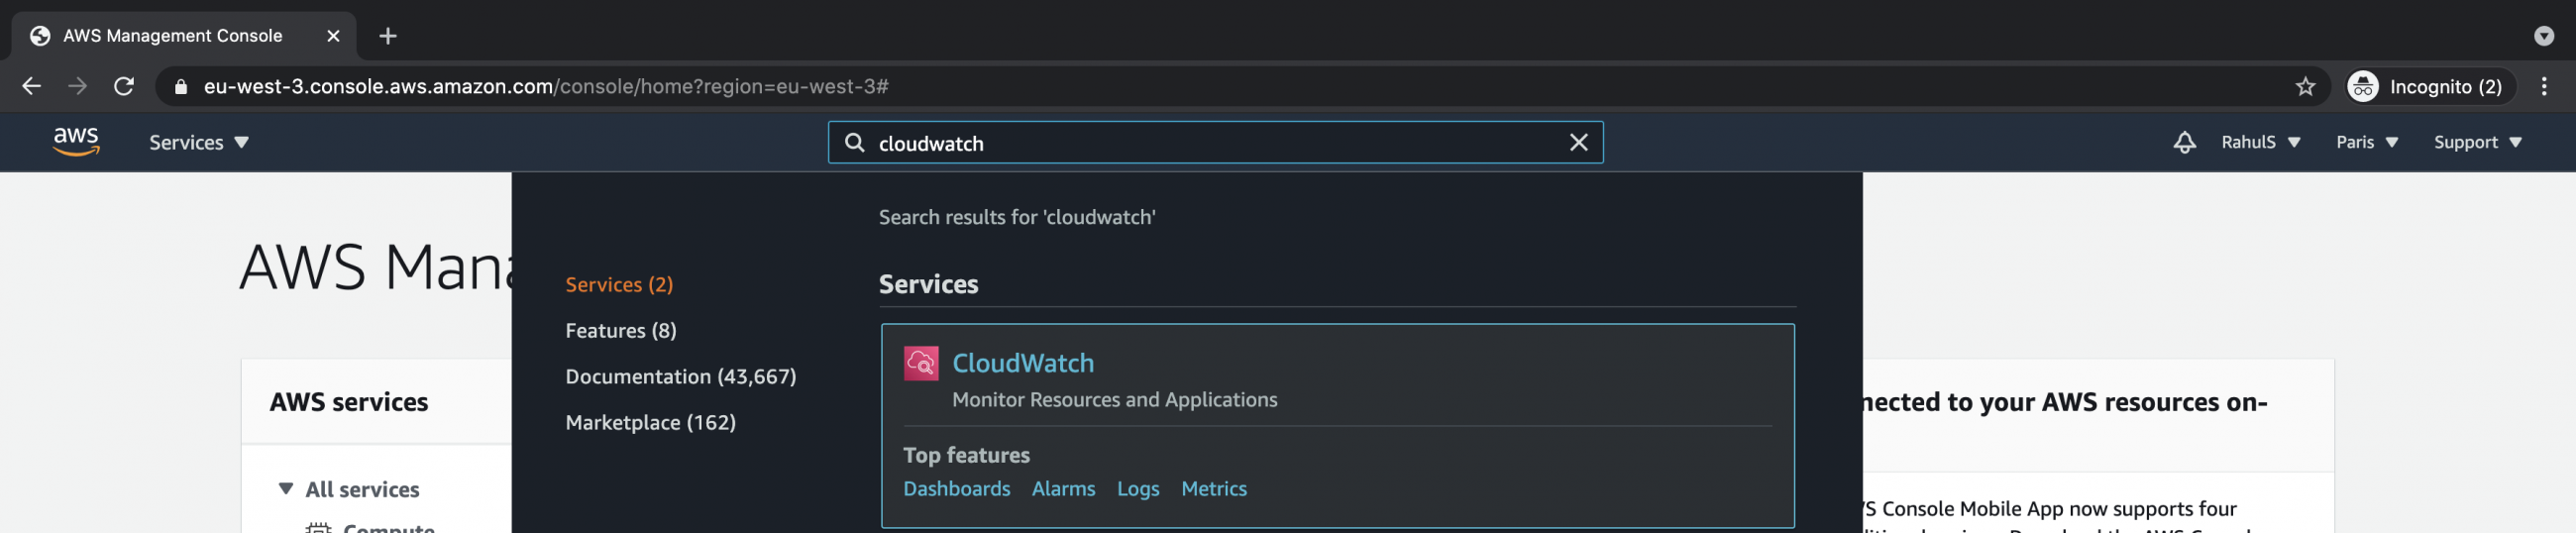
Search for “Cloudwatch” in the search box at the top of the screen.
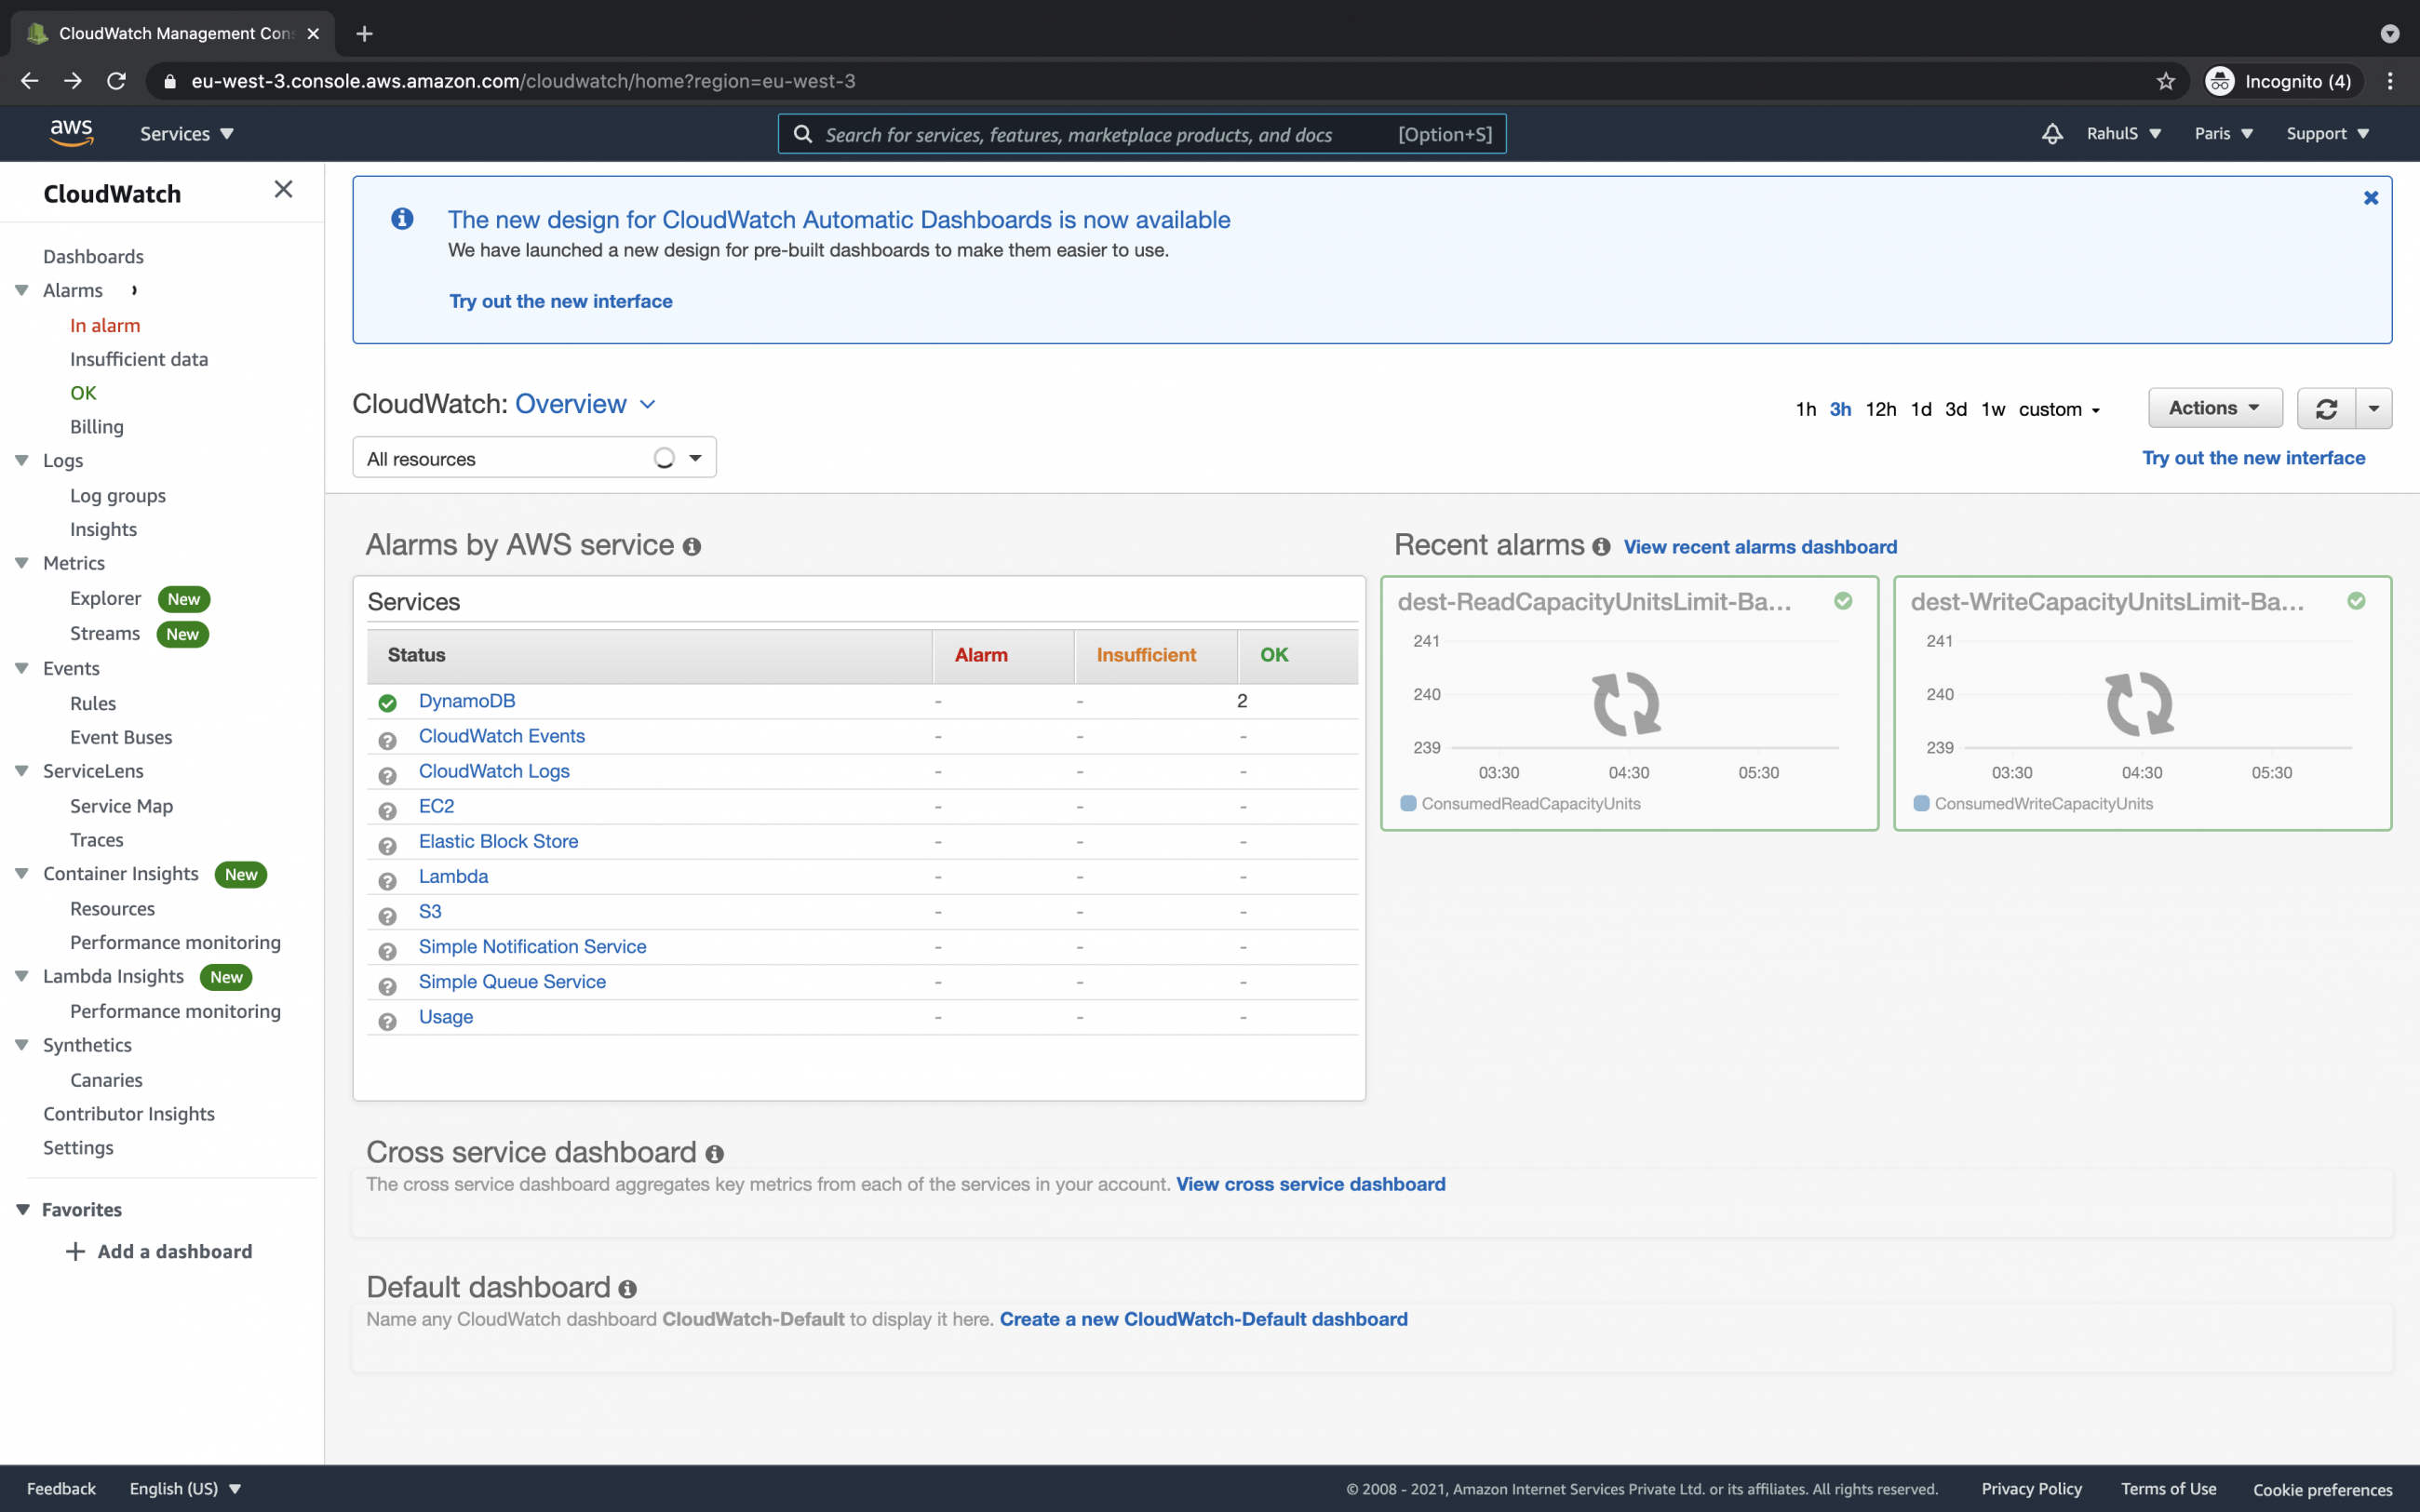
You will see the Cloudwatch dashboard as follows. This dashboard gives you an overview of Cloudwatch. You can give it a try and explore on your own as this is not in the scope of this article.
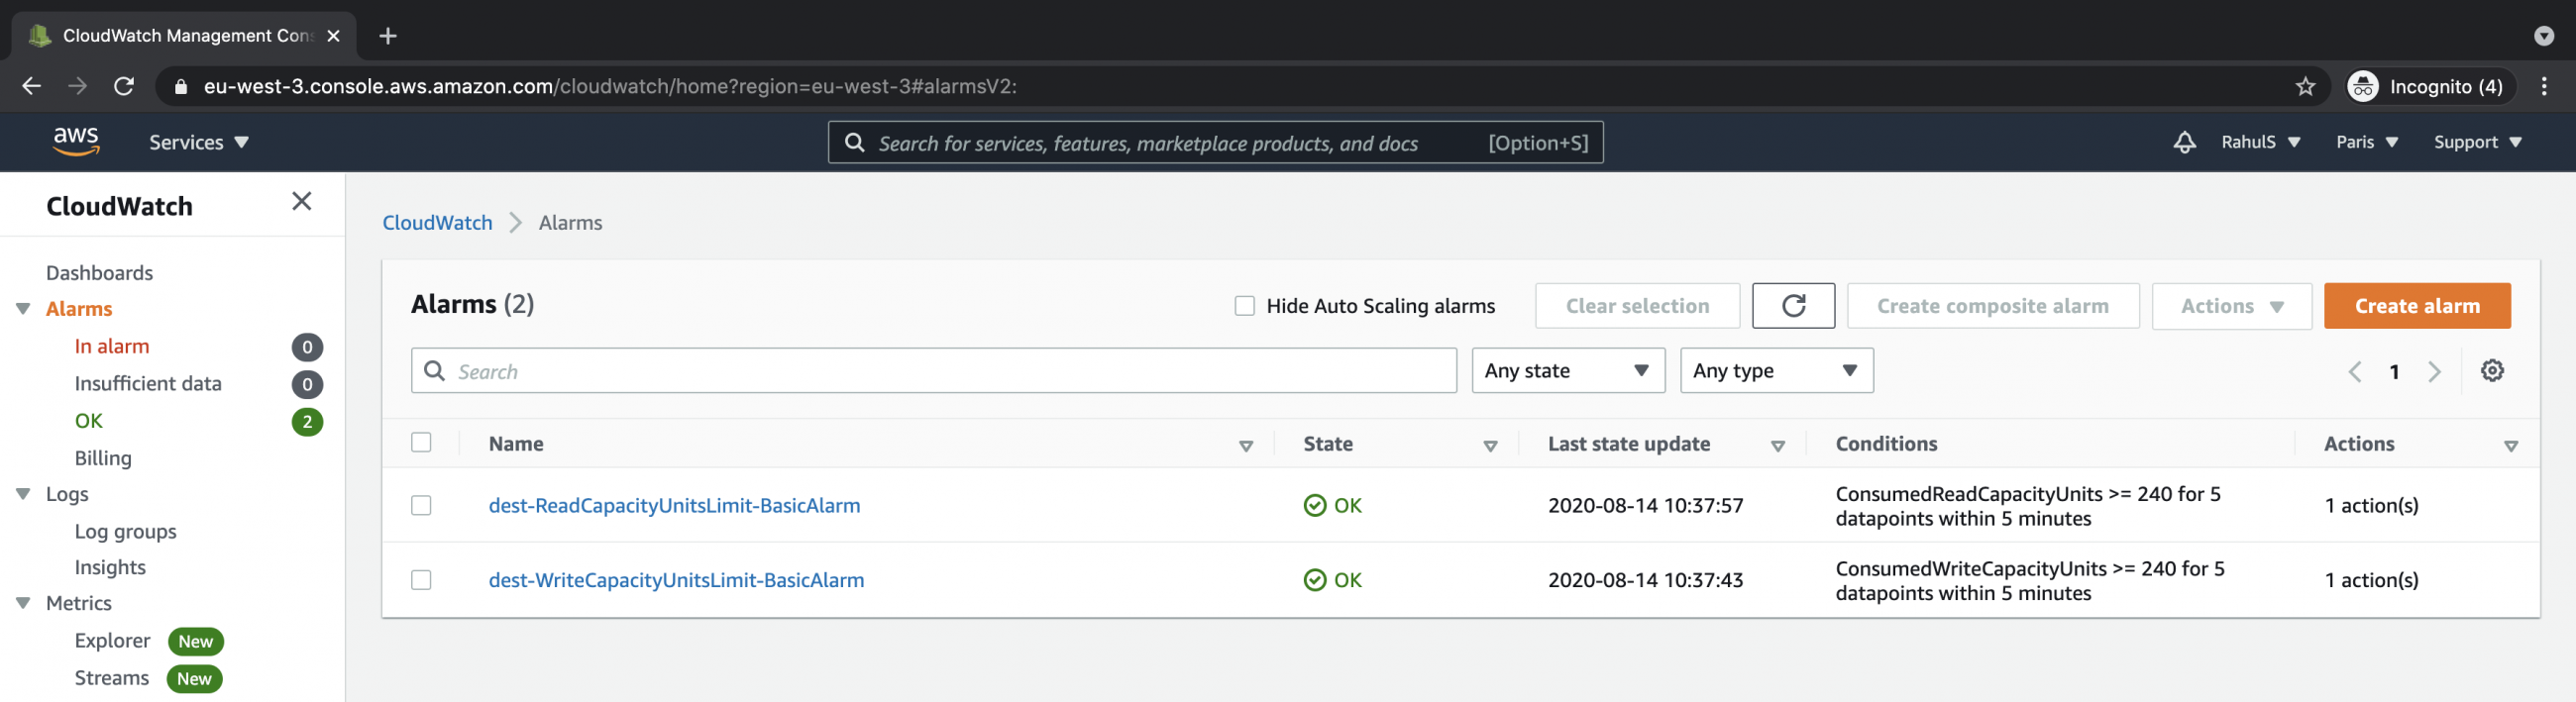
Click on “Alarms” in the left panel.
If you have any existing alarms you will see them here. Make sure you are in the desired region.
To create a new alarm for an existing SQS Queue click on the “Create alarm” button.
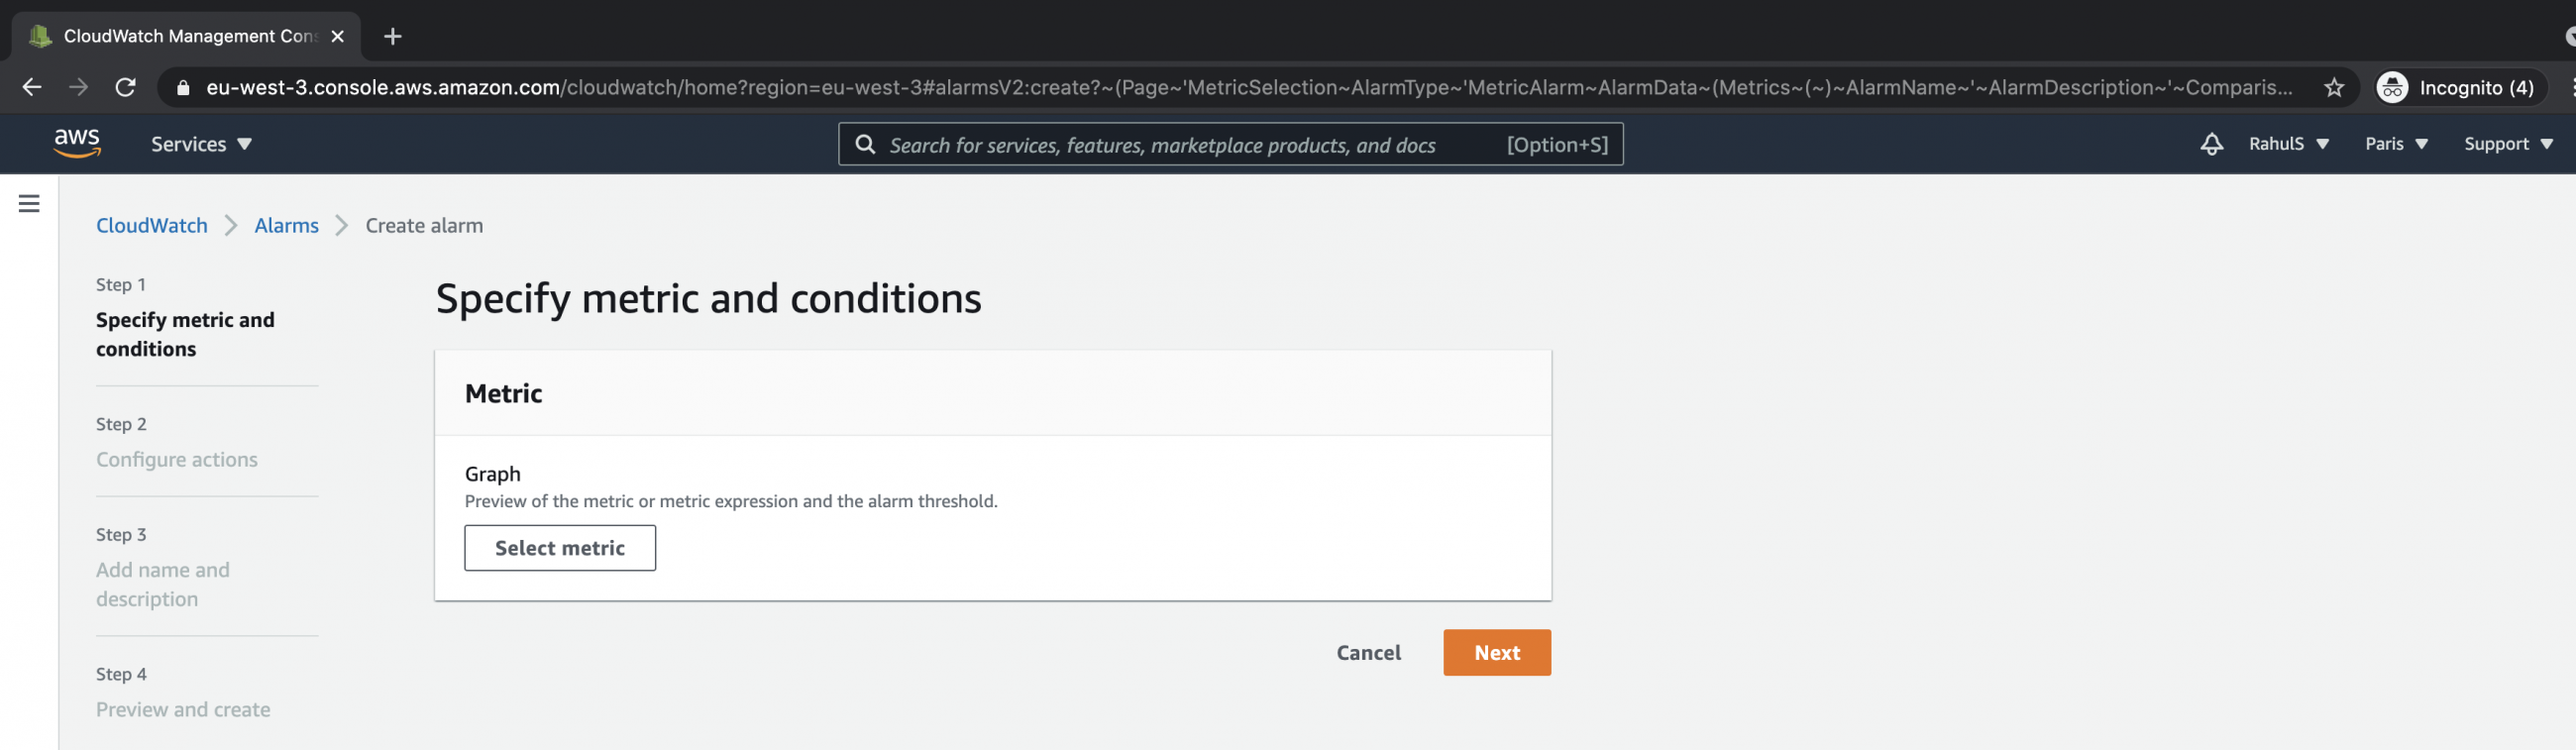
You will get a screen to specify a metric and conditions for the alarm to be created. Click on the “Select metric” button.
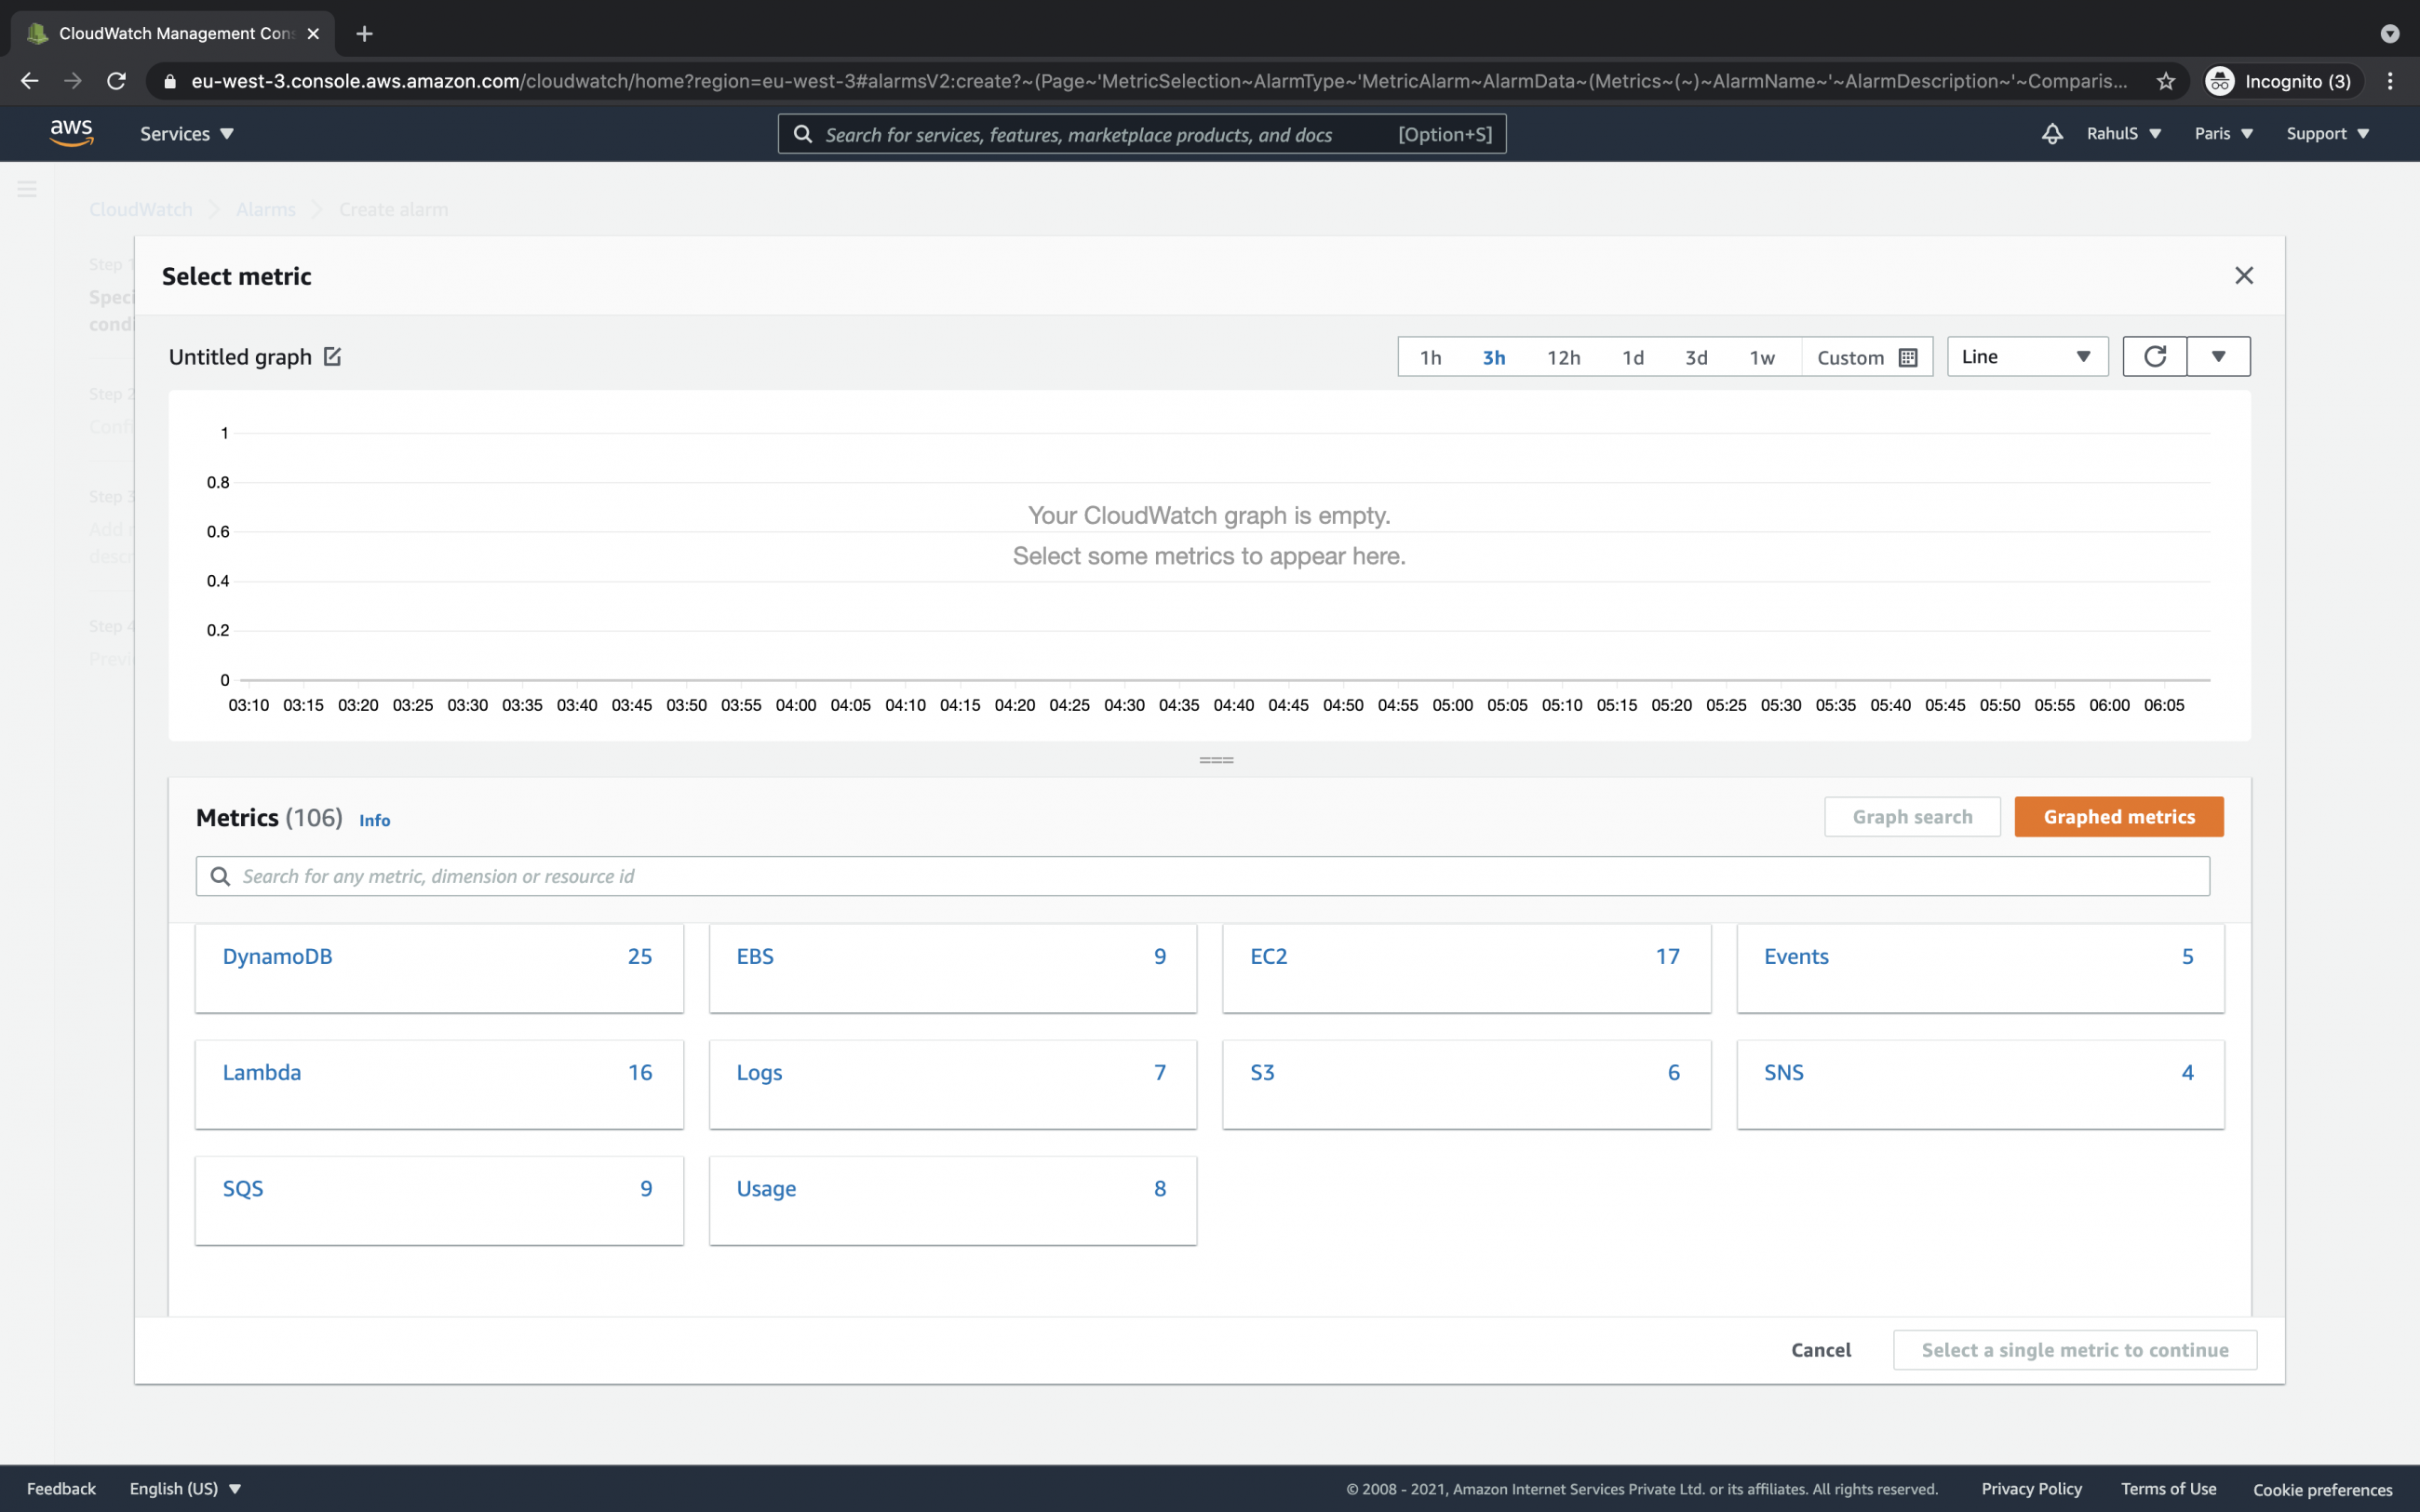
You’ll get a list of services with metrics available for them.
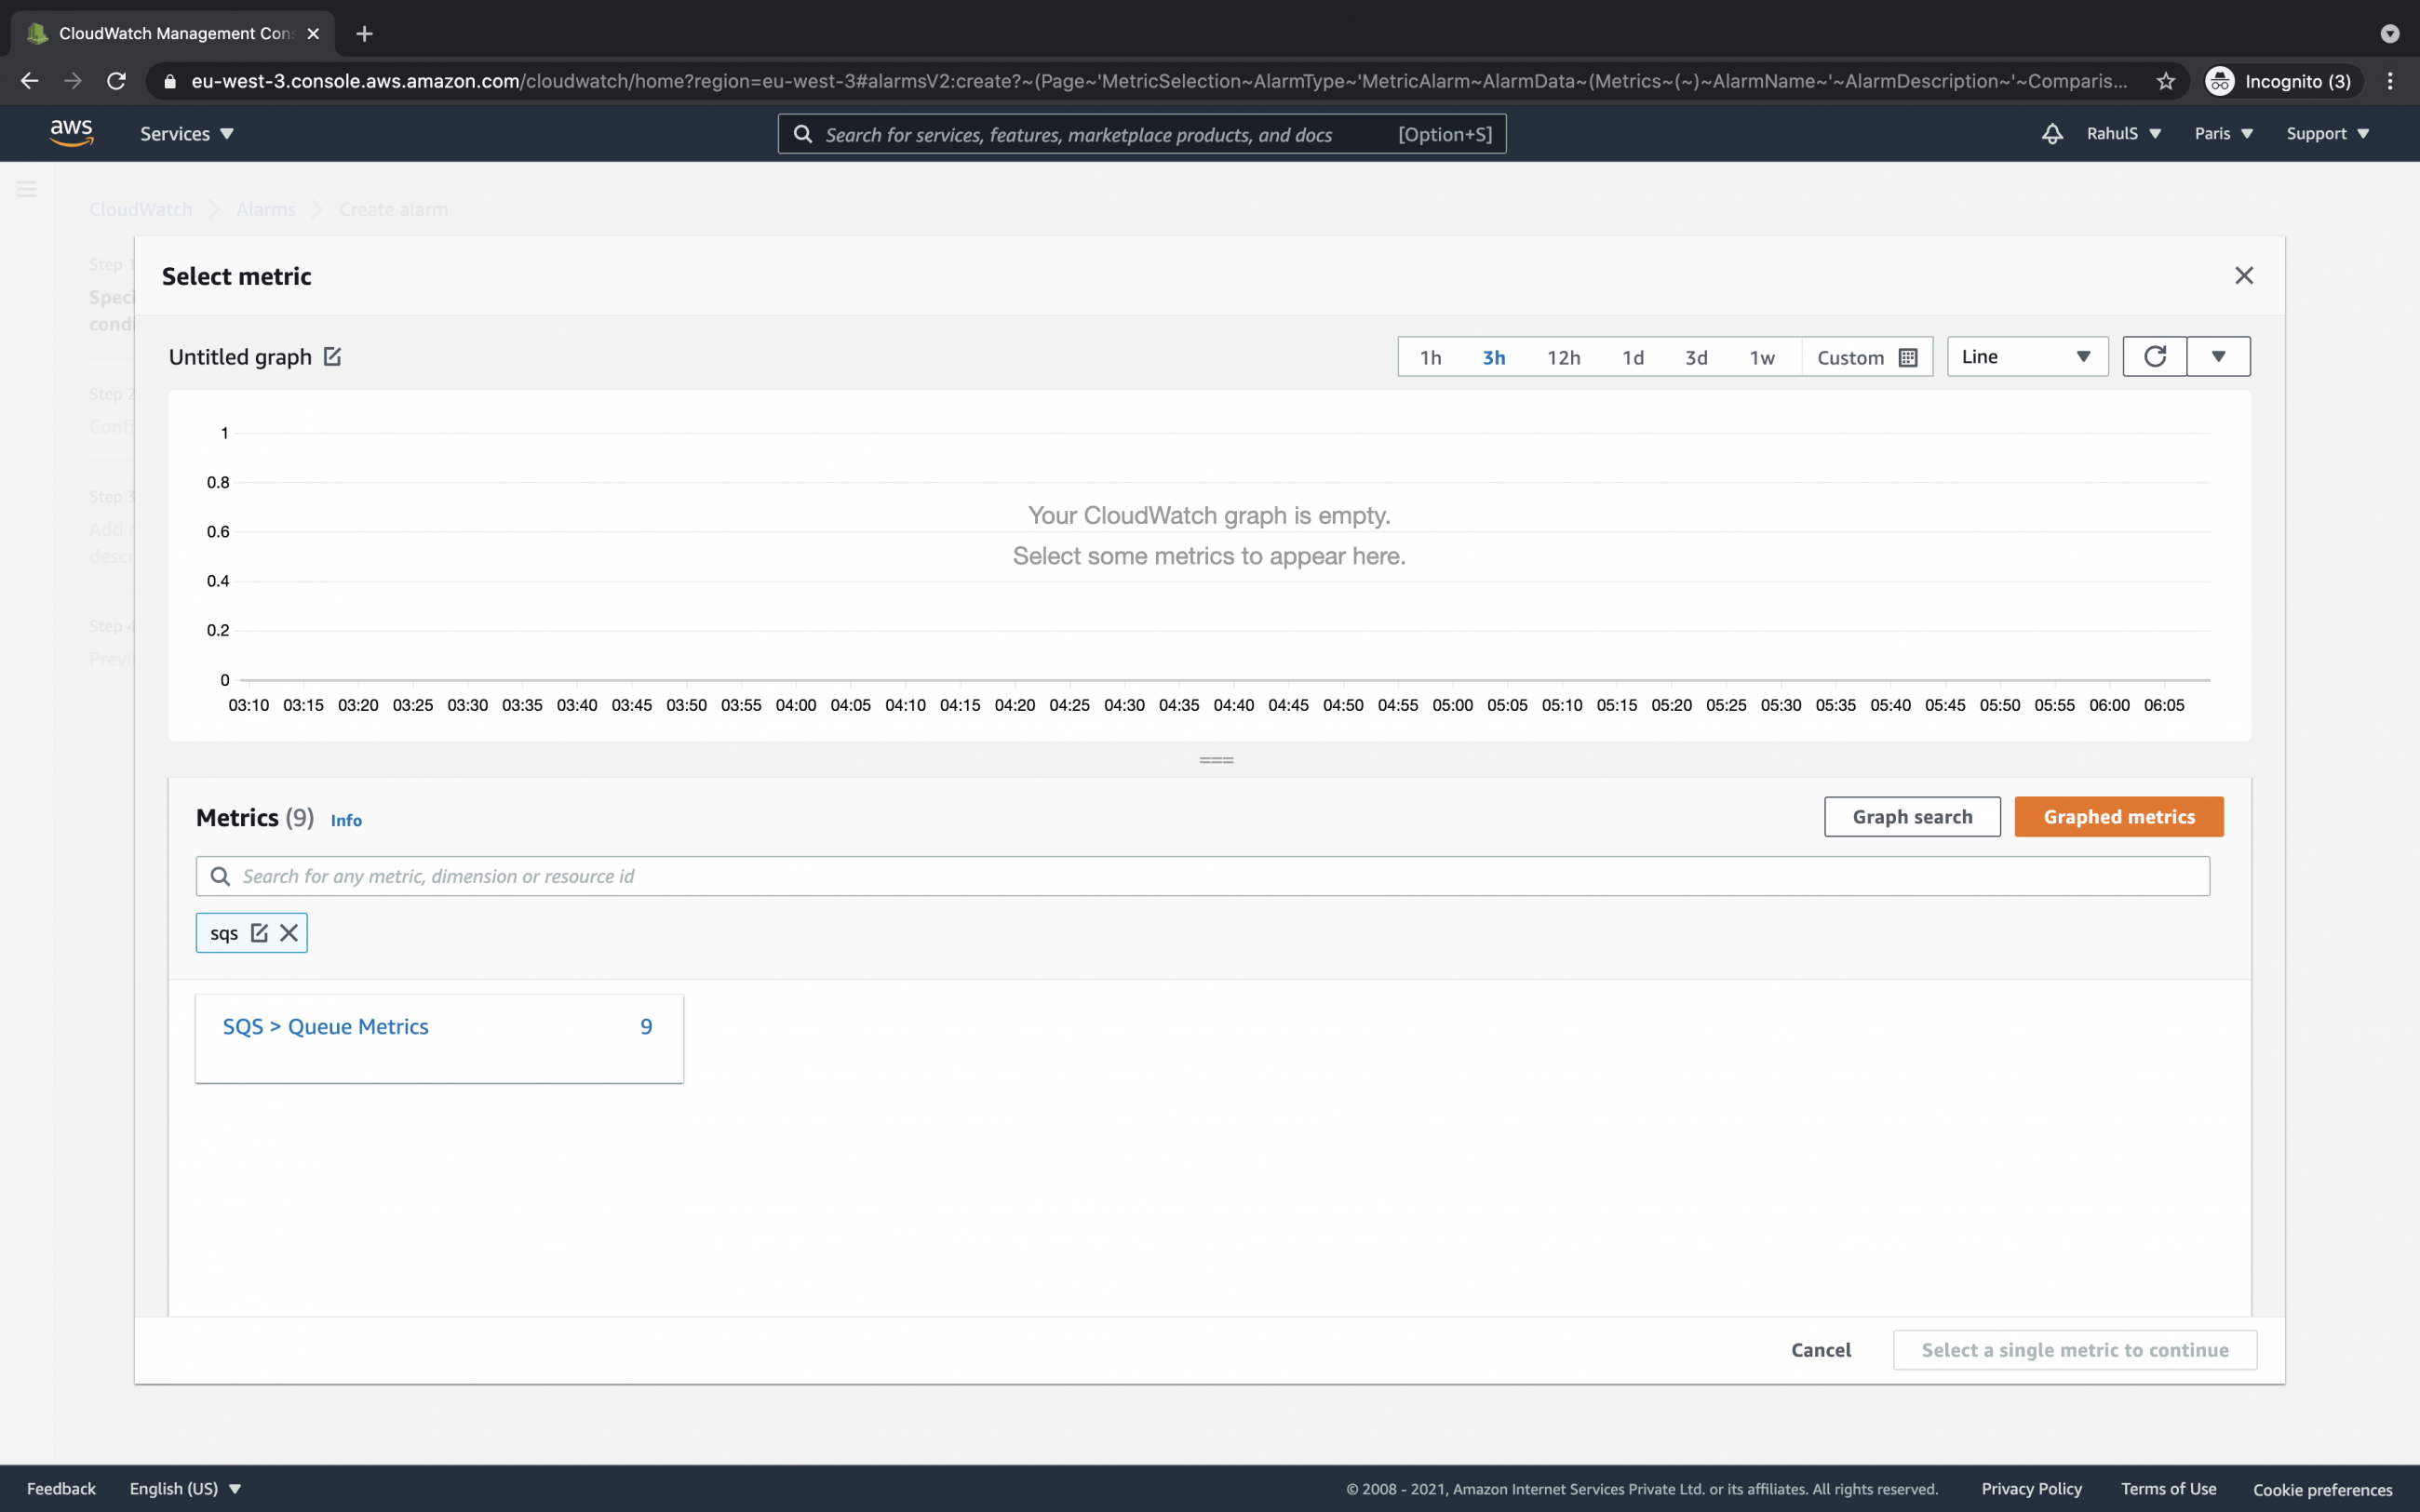
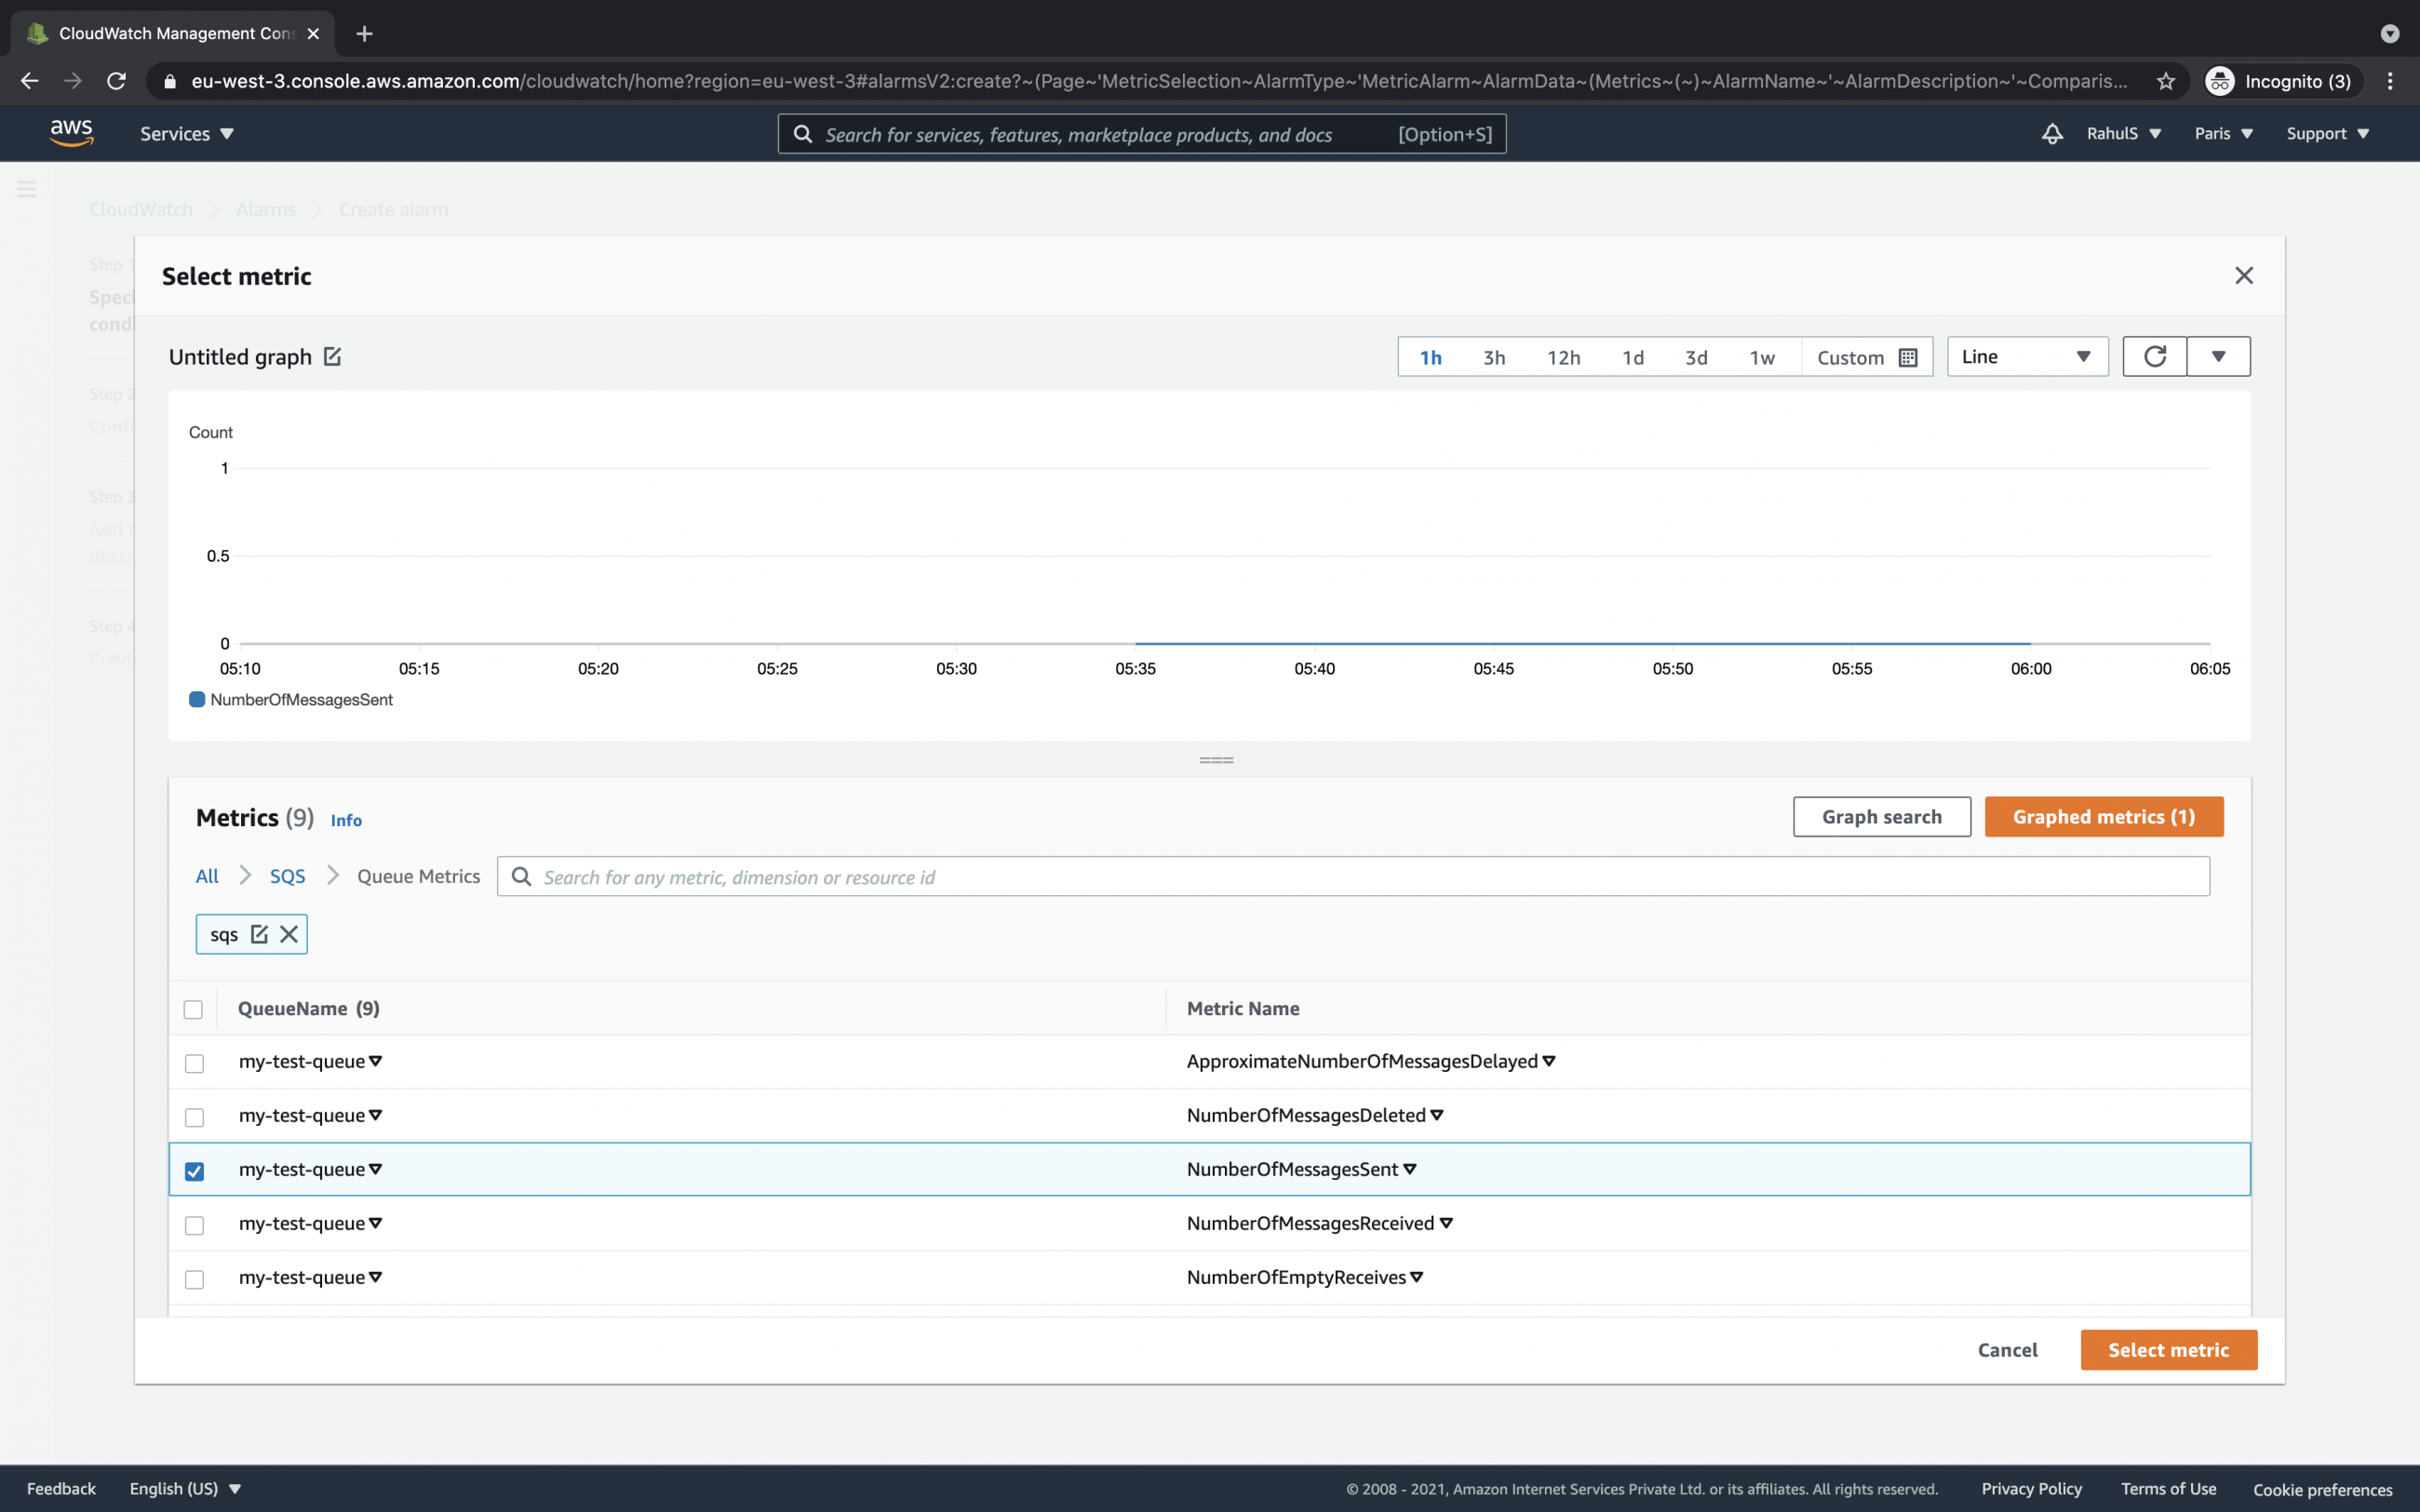
In the search box, search for SQS and you’ll get the filtered result as “SQS> Queue metrics”. Click on the SQS result.
On this screen, you will see available metrics for the queues you have in your account. Let’s select any one of these to create an alarm for it. Here, let’s proceed with the “NumberofMessagesSent” metric. Click on the “Select metric” button to proceed.
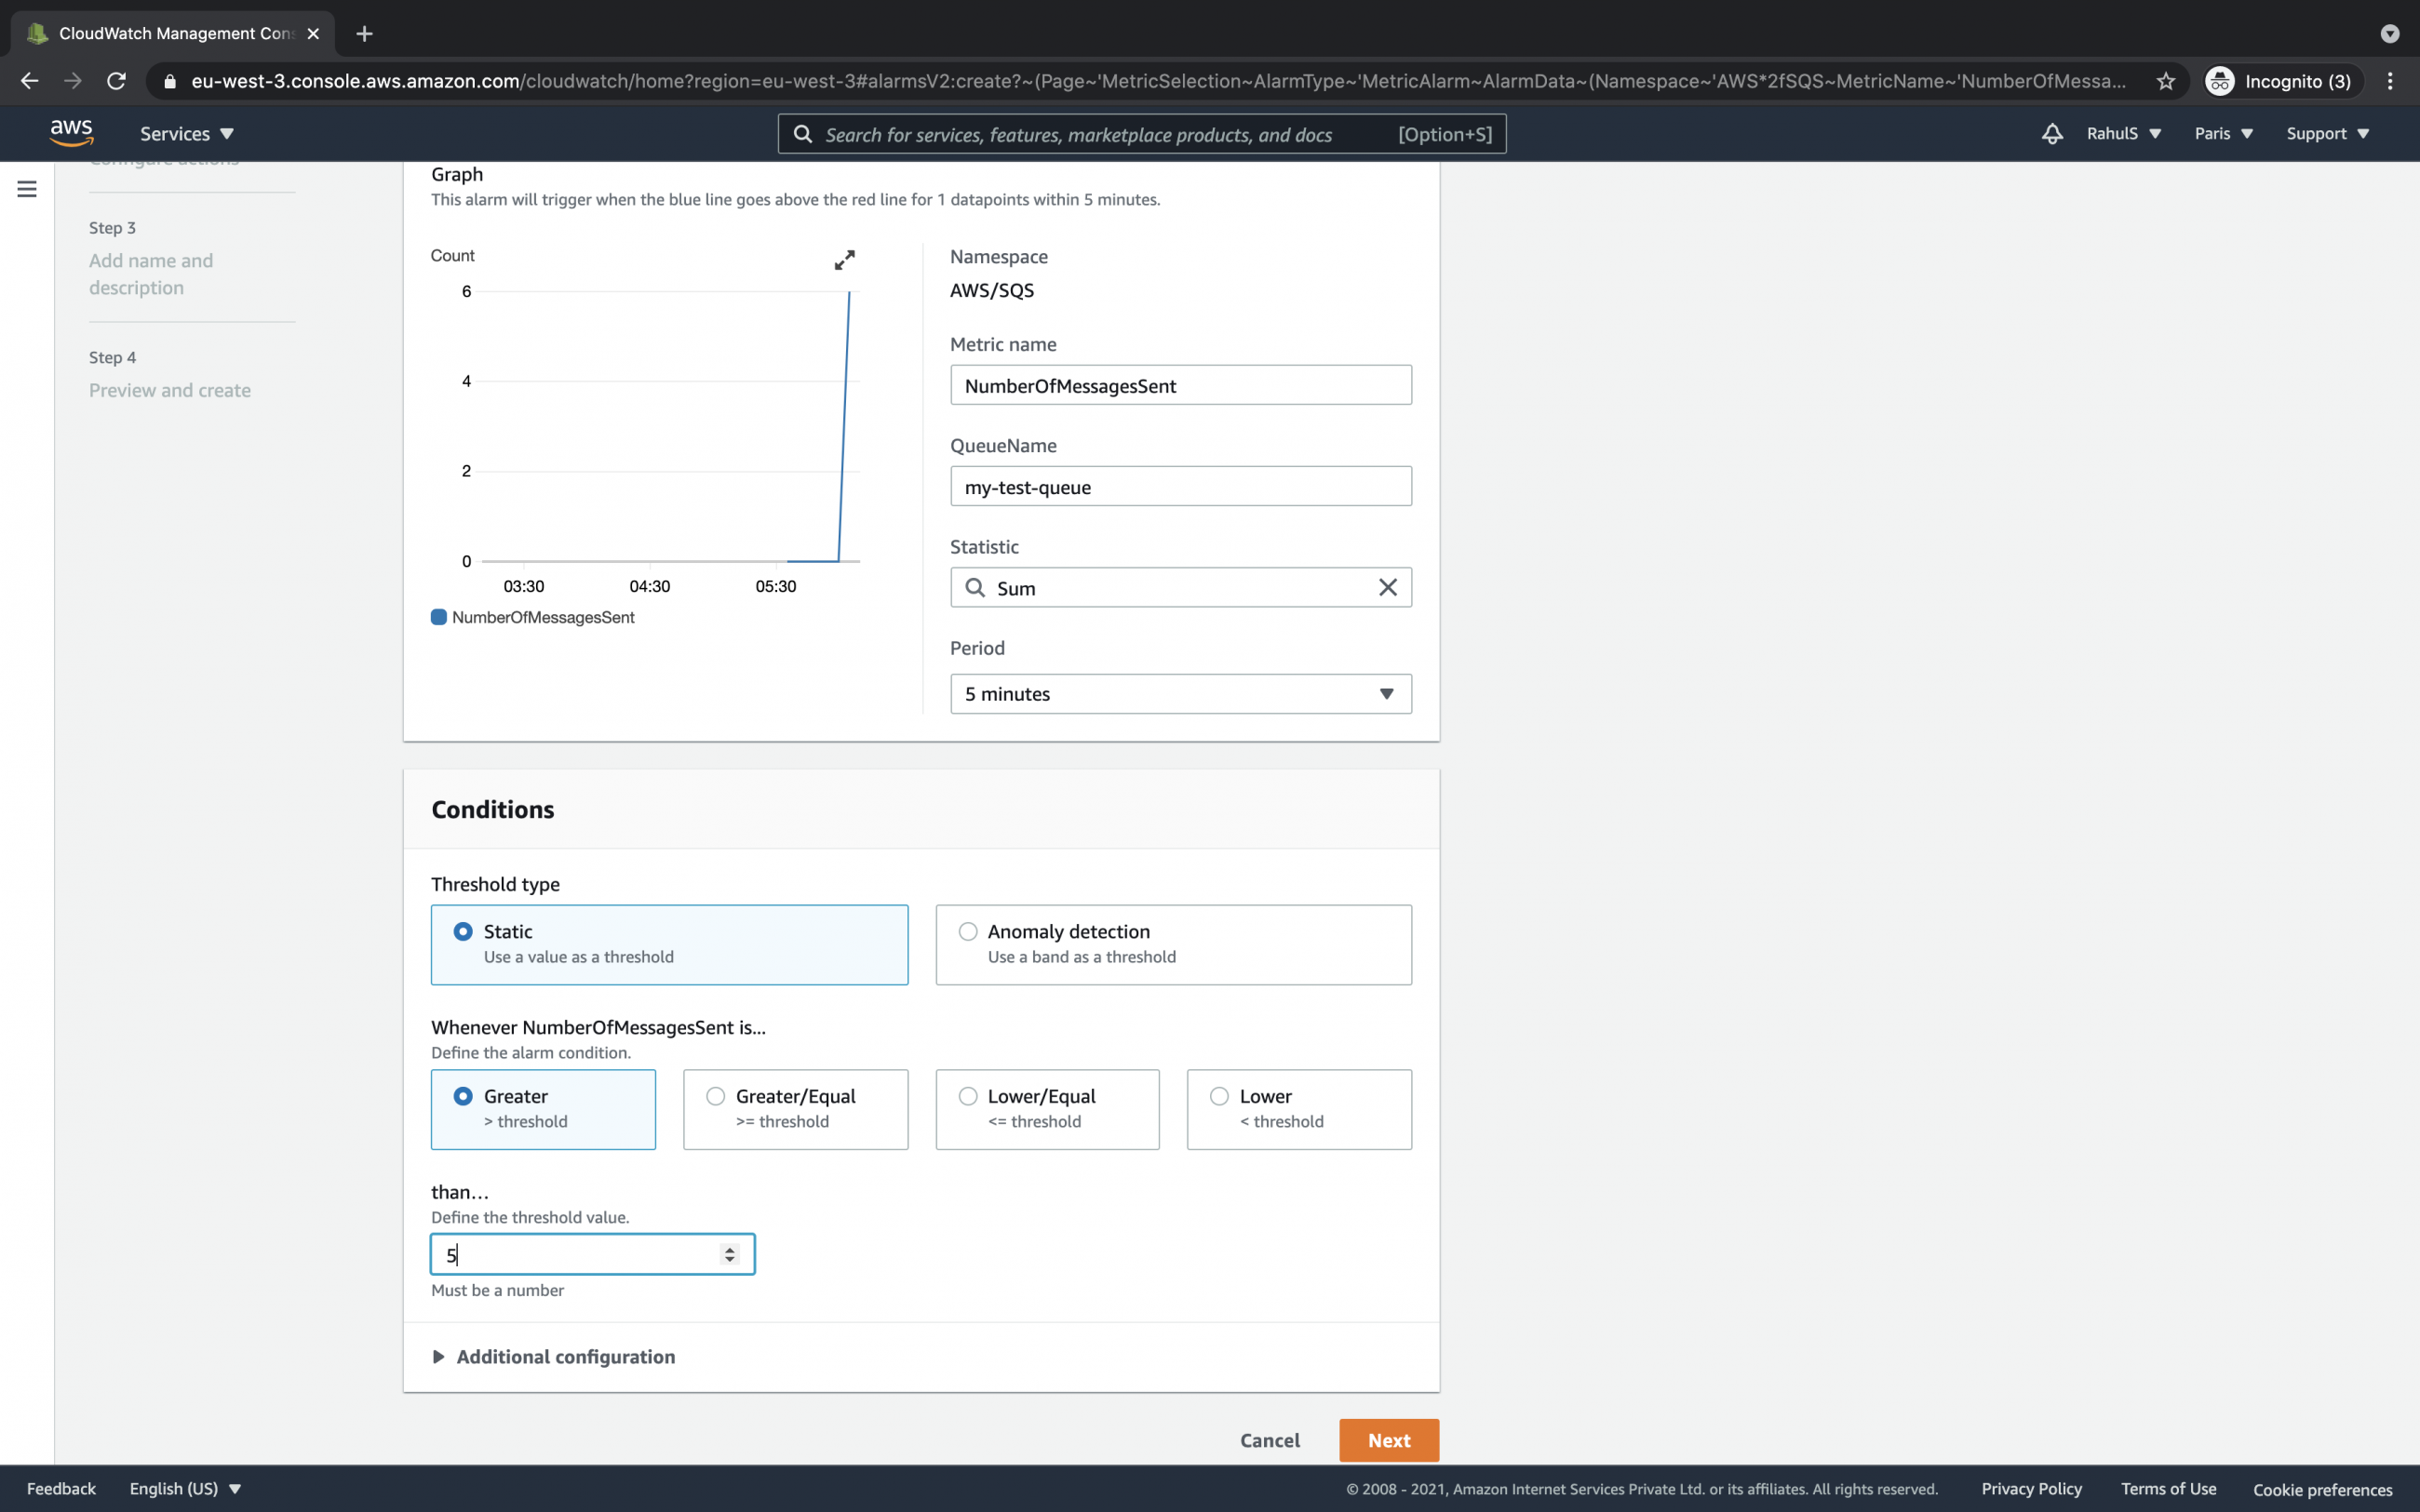
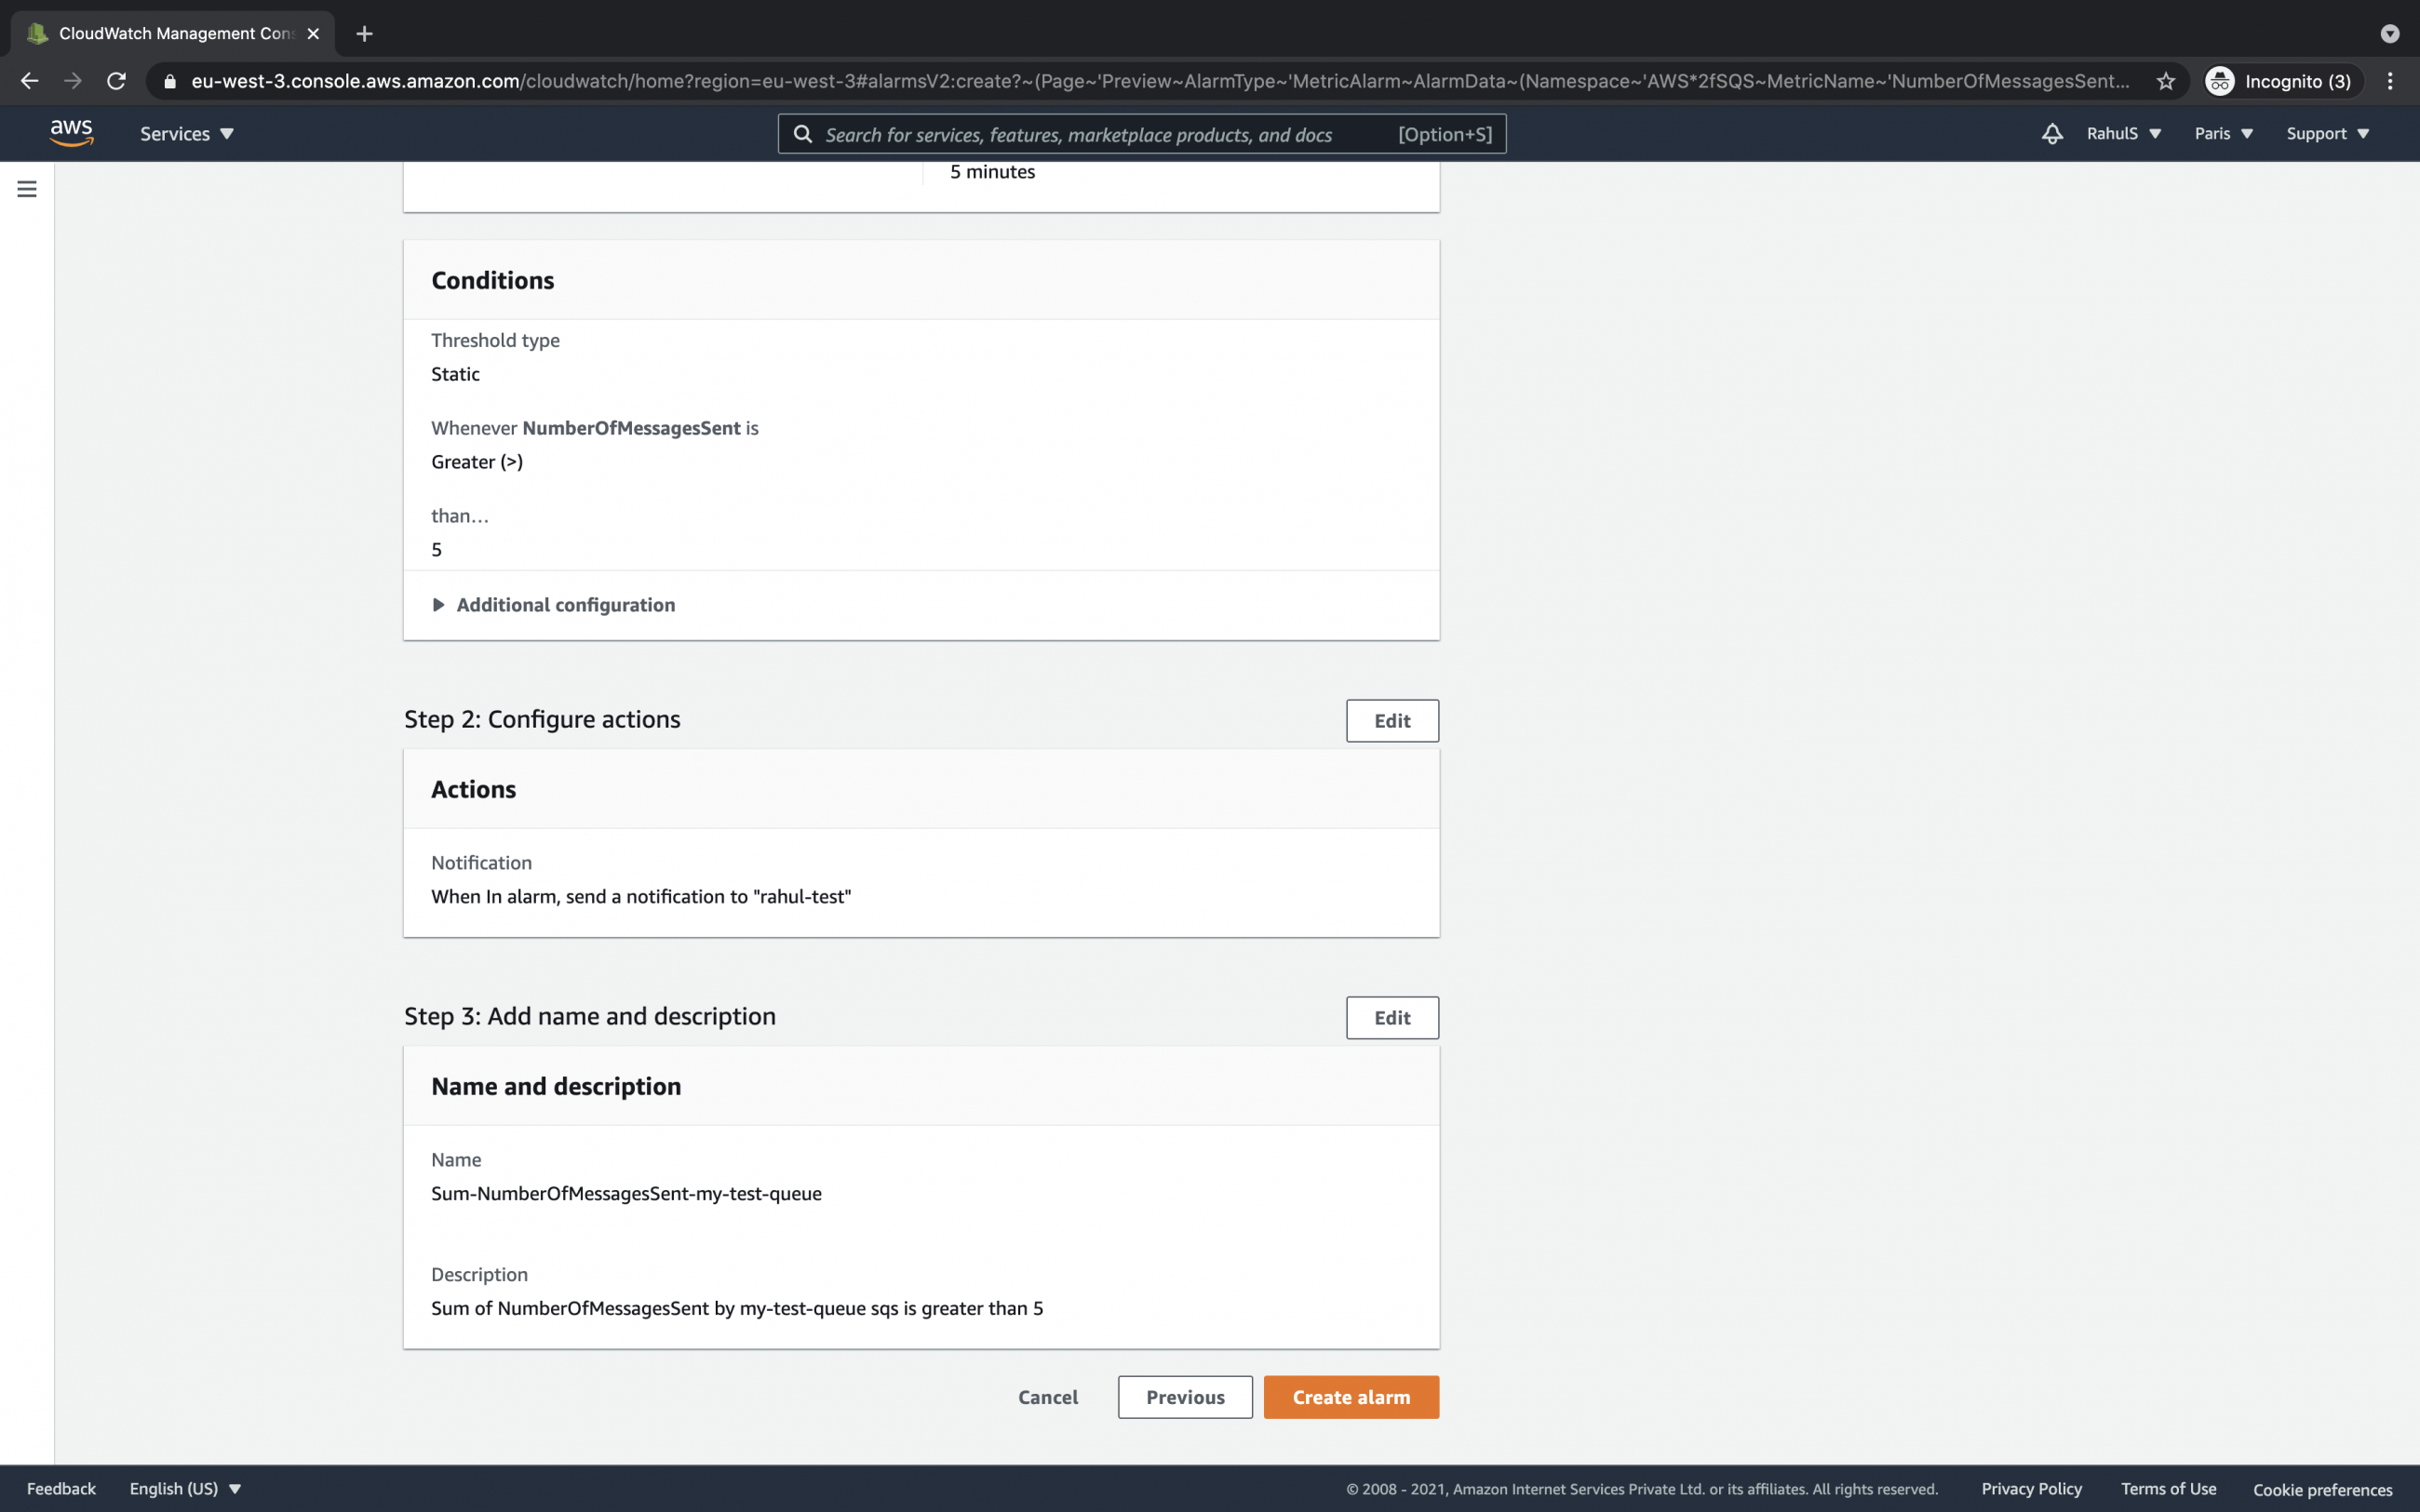
Choose the Statistics, Threshold type, Condition, and Threshold value as per your choice. Here, the alarm will be triggered if the sum of the number of messages sent is greater than 5 for 5 minutes.
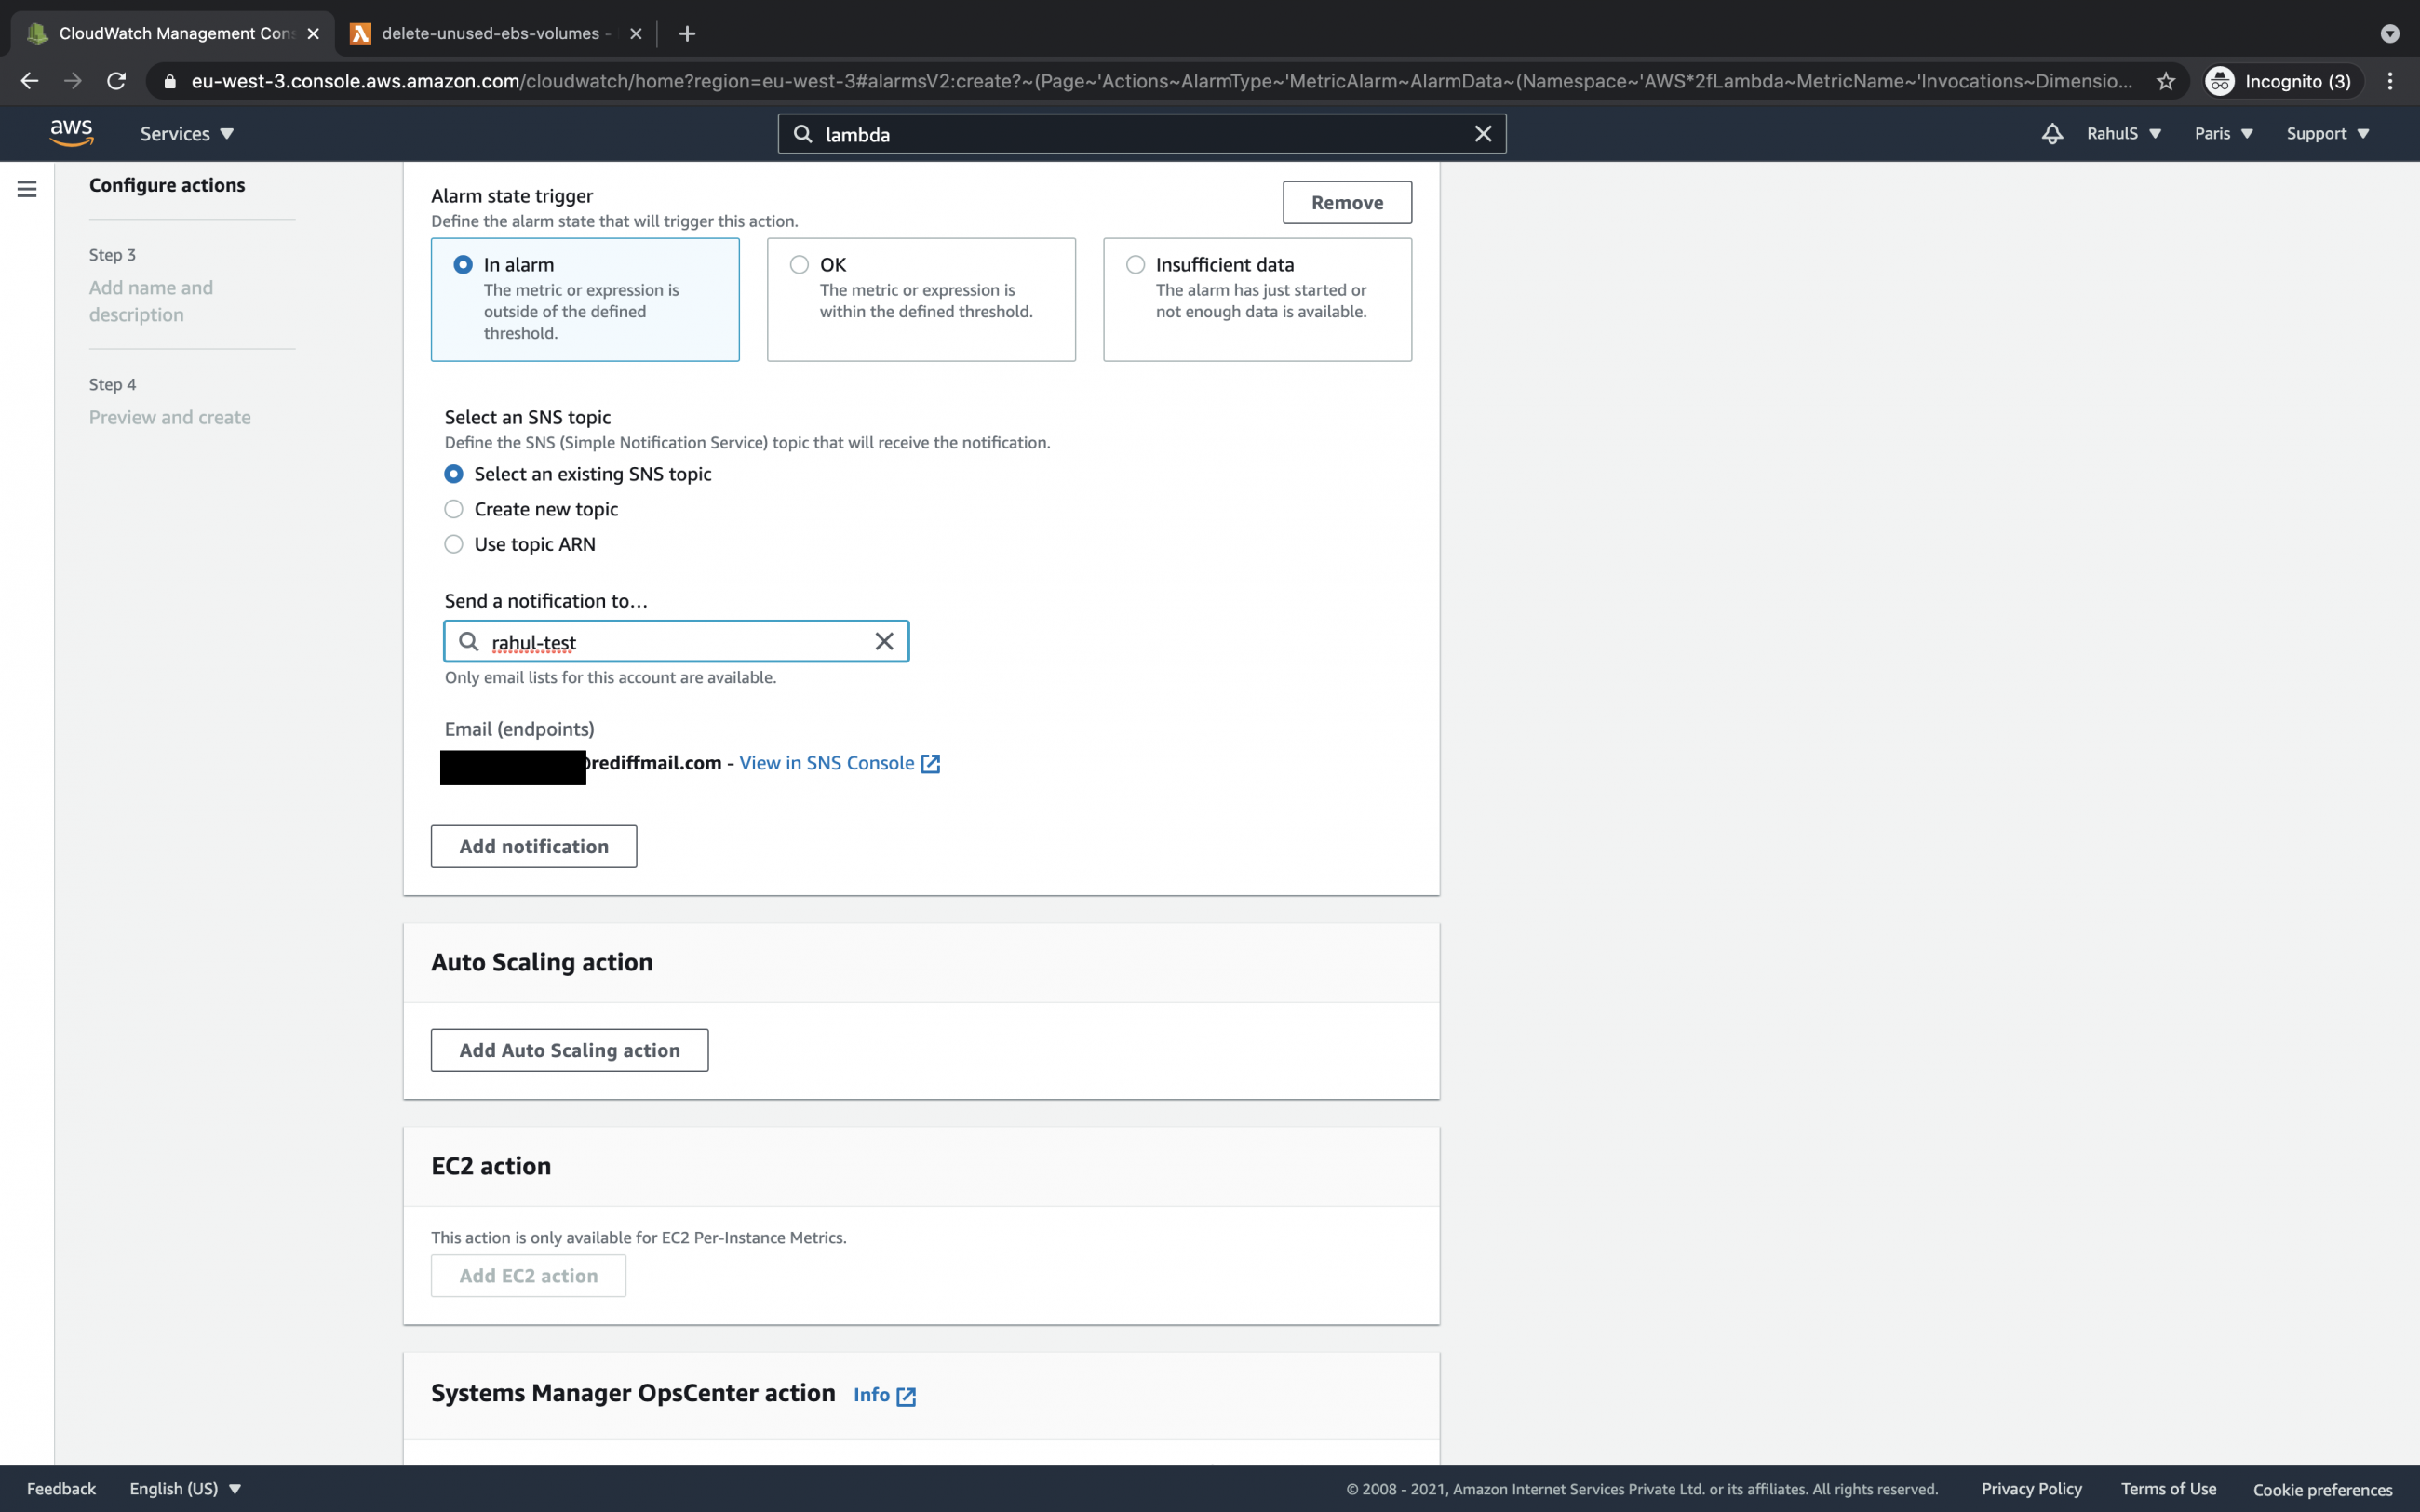
Choose the Alarm state Trigger, SNS Topic. When the alarm is triggered it will send a notification to the specified SNS topic.
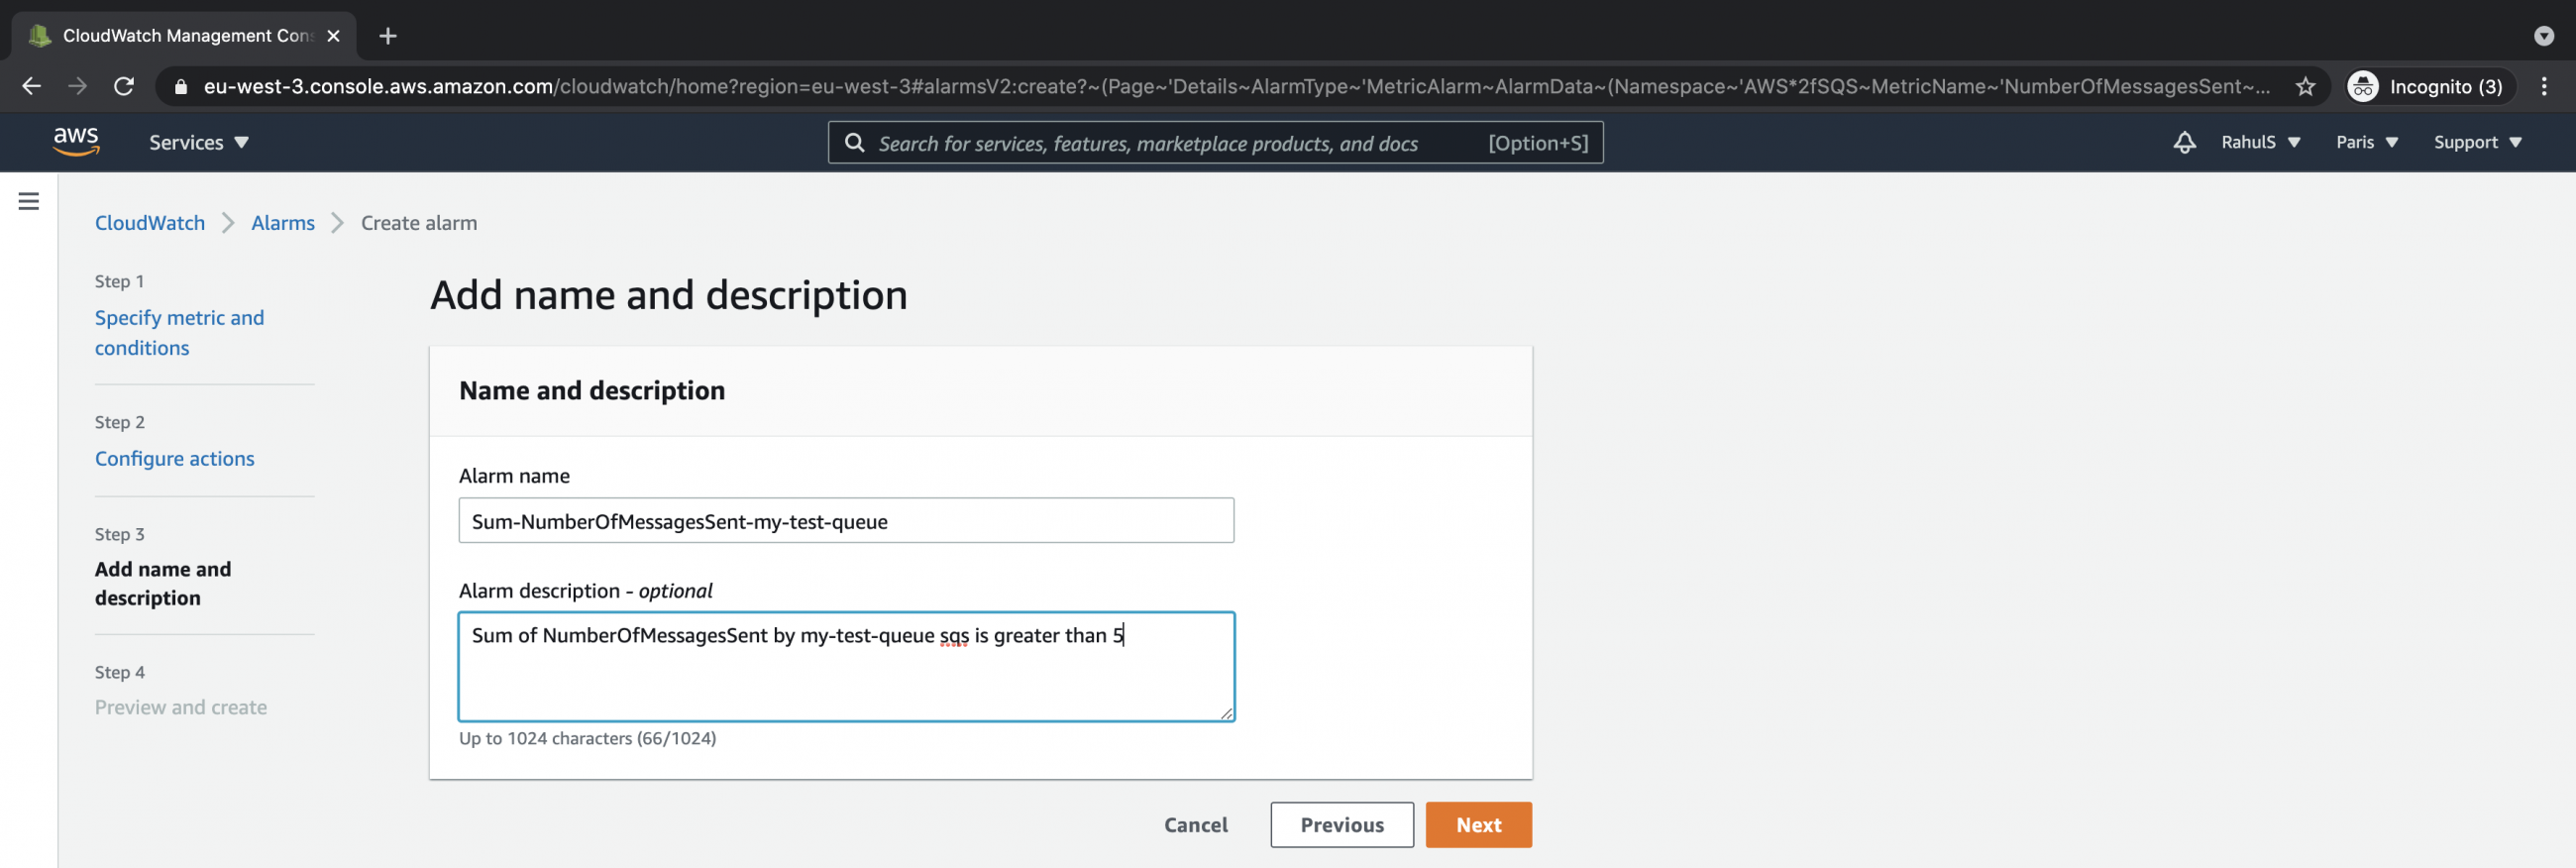
Give name and description to alarm and click on the “Next” button.
Review the configuration and click on the “Create alarm” button which will create an alarm.
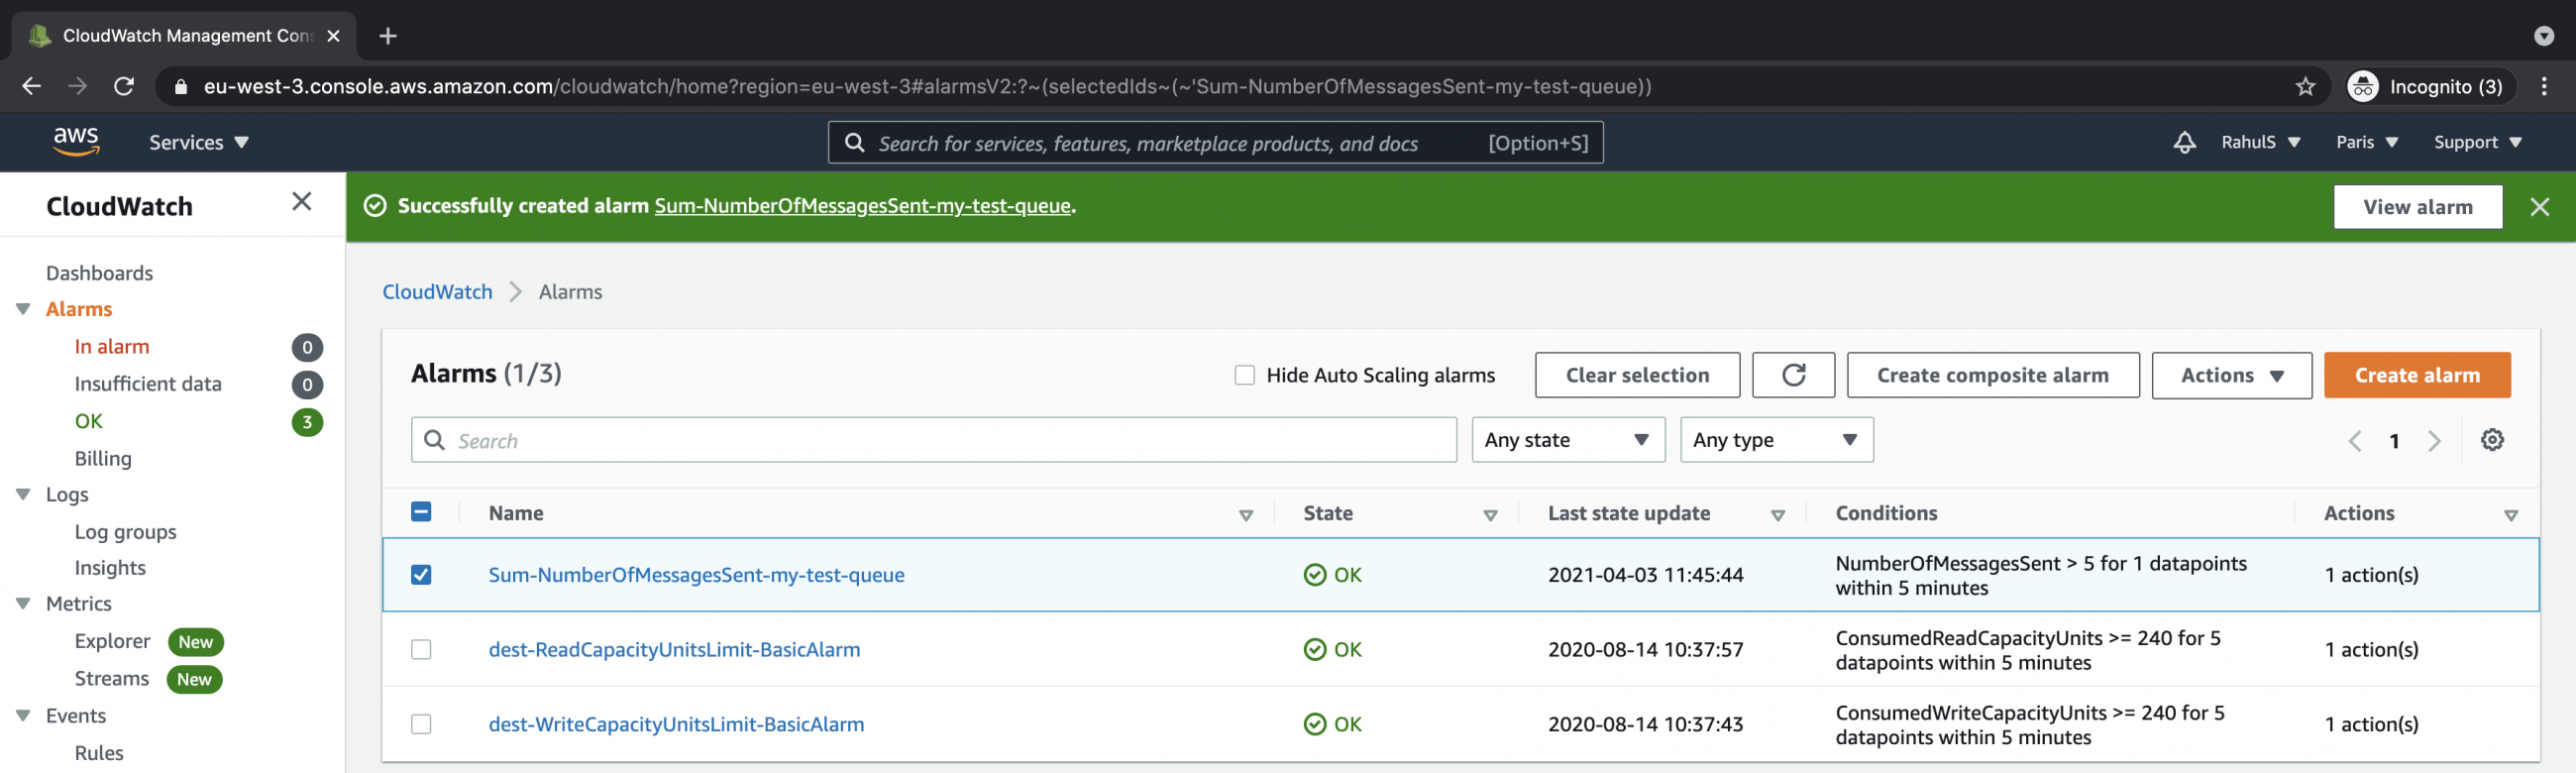
Now you can see the alarm we just created. The state of the alarm will change based on the threshold value and condition.
Conclusion
In this article, we created an alarm for the existing SQS queue. The alarm we created is triggered when the “Sum” of “NumberofMessagesSent” is “Greater” than the threshold value “5” for “5 minutes”, and when it is triggered a notification is sent to the SNS topic. You can now follow the same steps to create alarms for any other available metric, with different statistics and the threshold value.Advertisement


