Geekflare is supported by our audience. We may earn affiliate commissions from buying links on this site.
A HAR file is commonly used to troubleshoot networking or performance issues, including poor page load times and timeouts when doing particular tasks on a website.
Any company or website’s support team uses this HAR file to identify and resolve performance issues such as longer or slow loading times, page rendering issues, and error codes that may arise due to these issues.
What is a HAR file?
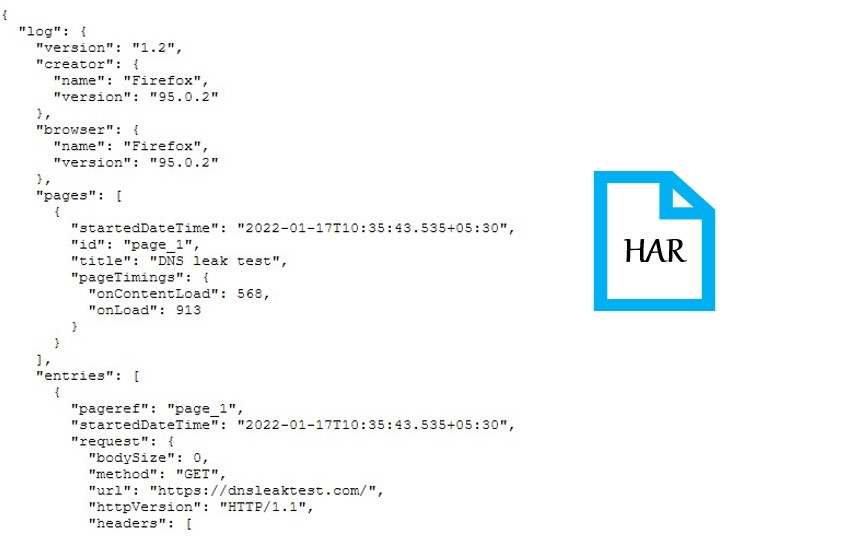
An HTTP archive Format, also known as a HAR file, is a JSON-formatted archive file that comprises your most recent network activity as recorded by your web browser. It tracks all the interactions, such as web requests and responses between a web browser and a website.

The HAR file records each resource loaded by the browser, as well as the time it took to load each resource. These files contain plain text logs of HTTP client-server connections.
.har is the extension for these archive files.
Why to generate HAR file?
The company or business support team may ask the HAR file for analysis when the user raises a ticket to resolve the issues.
HAR files provide a wide range of information about HTTP client-server requests and responses that aid in debugging, such as browser settings and cookies, the amount of time spent getting response data, amount of time it took to load a particular picture on the website, the time it took to establish a server connection, and the time it took to send a request and to receive a response.
Overview of the process
- First go to the webpage where you’re having issues and begin recording all the web requests and interactions.
- Recreate the problem by repeating the steps.
- Finish the capture and save the HAR file.
- Analyze the HAR file by your own or Send the file to Support team for troubleshooting the Performance and page rendering issues.
How to generate HAR file in different browsers?
Generating HAR files for capturing an HTTP session varies from browser to browser.
Chrome
The Network tab in Developer Tools of all browsers can be used to record an HTTP session.
- In Chrome, go to the page where you are experiencing problem.
- Developer Tools can be accessed via the menu (Menu > More Tools > Developer Tools). In that Select the Network tab from the newly opened panel.
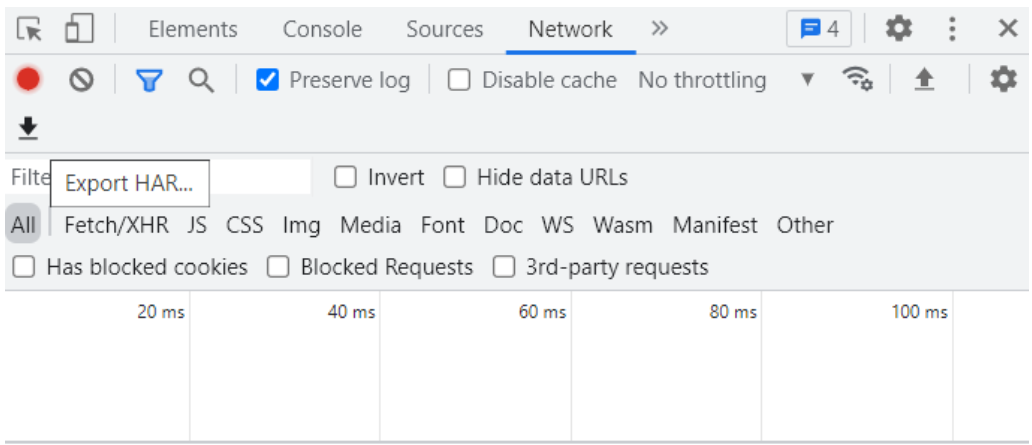
- On the Network tab, Make sure the round button in the upper left corner is in red. If it’s grey, double-click it to begin recording the interactions.
- Enable the preserve log to record all the web requests and responses.
- To export the HAR file, click the down arrow button in the network tab itself.
- Save the HAR file to your computer.

Firefox
- At the top-right of your browser window, click the Firefox menu (three horizontal parallel lines).
- Select More tools > Web Developer > Network from the drop-down menu.
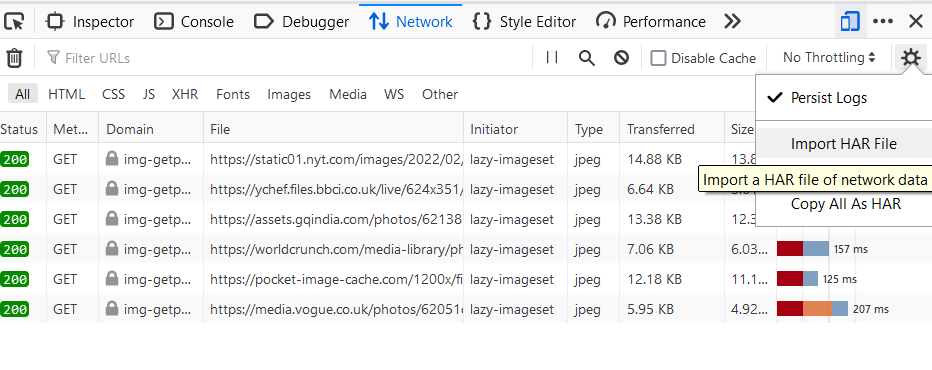
- Click on the settings button and turn on the persist logs option.
- While the capture is ongoing, refresh the page and repeat the problem.
- Right-click any row of the activity panel and select Save all as HAR if you’ve successfully replicated the problem.
- Finally, If in case console log file is also required for troubleshooting, navigate to the Console tab and Select all by right-clicking any row and paste the content in some text file and share it to the support center.

Microsoft Edge
- Select More Tools > Developer Tools by clicking on … (the three-dot icon) at the top-right corner.
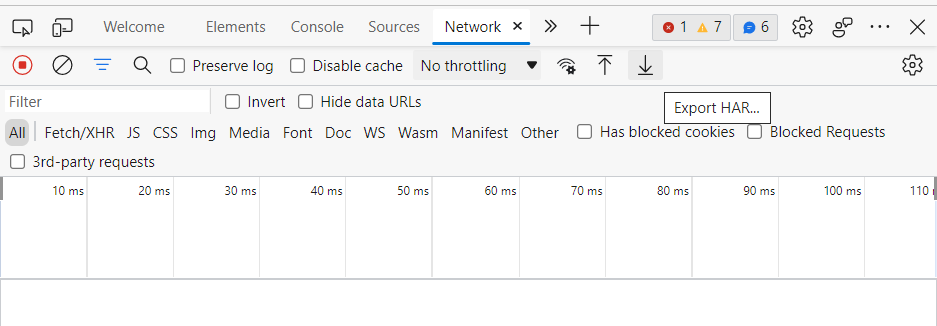
- Navigate to the network tab and start a profiling session.
- Visit the webpage and follow the instructions to resolve the problem.
- And finally save the HAR file by selecting “Export as HAR “

Internet Explorer
- Open the internet explorer and go to the page where you are having problems
- click the gear symbol in the top right corner.
- Go to (Developer Tools > Network Tab)
- While the capture is ongoing, refresh the page and replicate the problem.
- Click the “Export as HAR” icon (shape of floppy disc) after replicating the problem successfully.
HTTP Watch Tool
For Google Chrome, Internet Explorer, and Microsoft Edge, you can also use HTTPWatch (in-browser HTTP sniffer) for capturing web requests and responses.
- Download and install the HTTPwatch tool first.
- Start the HTTPwatch capture and load the page where you are having issues and stop the capture as soon as you’ve replicated the problem.
- And the capture should be saved in HAR format.
Websites to analyze HAR files
These tools are simple and effective in visualizing and analyzing the HAR file (logs of HTTP client-server communication).
- Google HAR analyzer – Choose a file by clicking the “Choose File” button and select the HAR file you’d like to examine. The Analysis screen shows up automatically after choosing the file. Filtering by HTTP status code is available.
- Softwareishard.com – A free web-based application tool that displays a waterfall graph of all requests and allows you to dig down to a specific request. Press the Preview button after inserting the HAR log into the text box below. Alternatively, drag and drop the har files anywhere on the page to start analyzing the file.
- Site24x7 – This is also a free website tool to visualize HTTP Archive file. Browse the file or paste its content in input box.
Conclusion
If you open a HAR file in a text editor, you’ll notice that it’s simply a JSON document containing your web request and its responses. It may contain the following potentially sensitive information:
- Request and Response Headers
- Request and Response Content
- Authentication tokens, cookies, session tokens, passwords and API credentials
Make sure you delete any sensitive information from HAR files before submitting them to a support team for analysis. Mainly, if the technical support team requests a HAR file with interactions with third parties, critical information may be exposed.
I hope you found this article very helpful in learning about HAR analyzing tools and how to generate HAR files in different browsers.
You may also be interested in learning about troubleshooting network latency with Wireshark.


