
Nagios is a popular and one of the most powerful open-source computer monitoring systems. It keeps track of your IT infrastructure and ensures that your networks, servers, applications, and processes are running smoothly. Using a monitoring system allows you to identify problems before they occur and deploy fixes quickly resulting in saving of cost and downtime.
In this tutorial, you will learn how to install and configure Nagios on a CentOS 8 based server. We will also do some basic configuration and install Nagios Remote Plugin Executor(NPRE), which will allow us to monitor remote hosts.
Prerequisites
- A server running CentOS 8
- A non-sudo user with root privileges.
- SELinux Disabled
- Another server running CentOS 8 that you want to monitor.
- Ensure that everything is updated.
$ sudo dnf update
Step 1 – Configure Firewall
The first step is to configure the firewall. Fedora server comes with the Firewalld firewall.
Check if the firewall is running.
$ sudo firewall-cmd --state
You should get the following output.
running
Check the current allowed services/ports.
$ sudo firewall-cmd --permanent --list-services
It should show the following output.
dhcpv6-client mdns ssh
Allow HTTP and HTTPS ports.
$ sudo firewall-cmd --permanent --add-service=http
$ sudo firewall-cmd --permanent --add-service=https
Recheck the status of the firewall.
$ sudo firewall-cmd --permanent --list-services
You should see a similar output.
dhcpv6-client http https mdns ssh
Reload the Firewall.
$ sudo systemctl reload firewalld
Step 2 – Install Apache and PHP
To run Nagios, you will need Apache along with PHP installed.
Install and enable Apache service.
$ sudo dnf install httpd
$ sudo systemctl enable --now httpd
To install PHP, we will use the Remi Repository. Install Remi Repo and enable PHP 7.4.
$ sudo dnf install dnf-utils http://rpms.remirepo.net/enterprise/remi-release-8.rpm
$ sudo dnf module reset php
$ sudo dnf module enable php:remi-7.4
Install PHP and several common PHP modules.
$ sudo dnf install php php-gd php-curl
Enable PHP and start the service.
$ sudo systemctl enable --now php-fpm
Restart the Apache service for the change to take effect.
$ sudo systemctl restart httpd
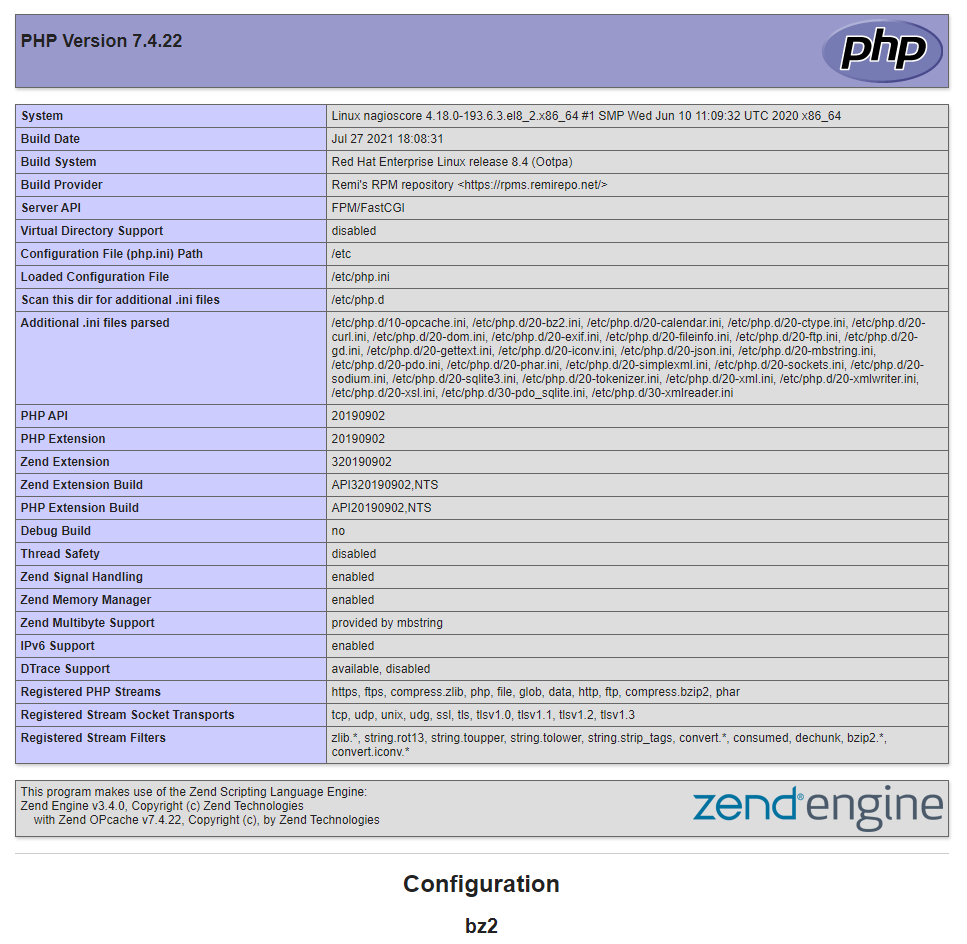
You can check the installation of Apache and PHP by creating a file info.php in the /var/www/html directory which was created by the Apache installer.
$ sudo nano /var/www/html/info.php
Paste the following code in the editor.
<?php phpinfo();
Save the file by pressing Ctrl X and entering Y when prompted.
Open the URL http:///info.php in your browser and you should be greeted by the following page.
Step 3 – Install Nagios
Most of this tutorial will require you to install and work on your main server.
Install Dependencies
This tutorial will require Nagios and its plugins to be built from the source. Therefore, you need to install a few development libraries first.
$ sudo dnf install gcc glibc glibc-common gd gd-devel make net-snmp openssl-devel xinetd unzip wget gettext autoconf net-snmp-utils epel-release postfix automake
$ sudo dnf config-manager --enable powertools
$ sudo dnf install perl-Net-SNMP
Download Nagios
Switch to the /usr/src directory where we will place the downloaded Nagios source files.
$ cd /usr/src
Download the latest version of Nagios from its Github page. At the time of the tutorial, 4.4.6 is the latest version available. Modify the command in case you want a different version.
$ sudo wget https://github.com/NagiosEnterprises/nagioscore/archive/nagios-4.4.6.tar.gz
Extract the tar file.
$ sudo tar zxf nagios-*.tar.gz
Switch to the Nagios source directory.
$ cd nagioscore-nagios-*/
Compile Nagios
The next step is to compile Nagios from its source files. Run the configure script to perform checks to make sure all dependencies are present.
$ sudo ./configure
You should get a similar output after the successful completion of the script.
*** Configuration summary for nagios 4.4.6 2020-04-28 ***:

 General Options:
 -------------------------
        Nagios executable:  nagios
        Nagios user/group:  nagios,nagios
       Command user/group:  nagios,nagios
             Event Broker:  yes
        Install ${prefix}:  /usr/local/nagios
    Install ${includedir}:  /usr/local/nagios/include/nagios
                Lock file:  /run/nagios.lock
   Check result directory:  /usr/local/nagios/var/spool/checkresults
           Init directory:  /lib/systemd/system
  Apache conf.d directory:  /etc/httpd/conf.d
             Mail program:  /sbin/sendmail
                  Host OS:  linux-gnu
          IOBroker Method:  epoll

 Web Interface Options:
 ------------------------
                 HTML URL:  http://localhost/nagios/
                  CGI URL:  http://localhost/nagios/cgi-bin/
 Traceroute (used by WAP):


Review the options above for accuracy.  If they look okay,
type 'make all' to compile the main program and CGIs.
Start the compilation.
$ sudo make all
Create Nagios User and Group
Create a new user and group that will run the Nagios process.
$ sudo make install-groups-users
You should see the following output.
groupadd -r nagios
useradd -g nagios nagios
Add the apache user to the nagios group.
$ sudo usermod -a -G nagios apache
Install Nagios Binaries
Run the following command to install Nagios binaries, CGIs and HTML files.
$ sudo make install
Create External Command Directory
Nagios can process commands from external applications and for it, it needs a directory to be set up.
$ sudo make install-commandmode
/bin/install -c -m 775 -o nagios -g nagios -d /usr/local/nagios/var/rw
chmod g s /usr/local/nagios/var/rw

*** External command directory configured ***
Install Nagios Configuration Files
Install the sample configuration files.
$ sudo make install-config
Install Apache Configuration Files
Run the following command to install the Apache configuration files.
$ sudo make install-webconf
Restart the webserver to activate the configuration.
$ sudo systemctl restart httpd
Create a Systemd Service File
Run the following command to install a systemd unit file.
$ sudo make install-daemoninit
Enable HTTP Authentication
You can lock the Nagios web interface via HTTP authentication. For that, create an admin user called nagiosadmin.
Run the following command to use htpasswd to create the user. You will be prompted for a password.
$ sudo htpasswd -c /usr/local/nagios/etc/htpasswd.users nagiosadmin
New password:
Re-type new password:
Adding password for user nagiosadmin
Restart the server for the configuration to take effect.
$ sudo systemctl restart httpd
Step 4 – Install Nagios Plugins
Install the prerequisites required for the Nagios plugins.
$ sudo dnf install -y gcc glibc glibc-common make gettext automake autoconf wget openssl-devel net-snmp net-snmp-utils epel-release postgresql-devel libdbi-devel openldap-devel mysql-devel mysql-libs bind-utils samba-client fping openssh-clients lm_sensors
$ sudo dnf config-manager --enable powertools
$ sudo dnf install -y perl-Net-SNMP
Switch back to the /usr/src directory.
$ cd /usr/src
Download the latest version of Nagios from its Github page. At the time of the tutorial, 2.3.3 is the latest version available. Modify the command in case you want a different version.
$ sudo wget -O nagios-plugins.tar.gz https://github.com/nagios-plugins/nagios-plugins/releases/download/release-2.3.3/nagios-plugins-2.3.3.tar.gz
Extract the tar file.
$ sudo tar zxf nagios-plugins.tar.gz
Change to the plugins directory.
$ cd nagios-plugins-*
Run the following commands in order to compile and install the plugins.
$ sudo ./configure
$ sudo make
$ sudo make install
Step 5 – Install check_nrpe Plugin
Switch to the /usr/src directory.
$ cd /usr/src
Download the latest version of NPRE from its Github page. At the time of writing this tutorial, the latest version available is 4.0.3. Modify the following command in case you want a different version.
$ sudo wget https://github.com/NagiosEnterprises/nrpe/releases/download/nrpe-4.0.3/nrpe-4.0.3.tar.gz
Extract the archive.
$ sudo tar zxf nrpe-*.tar.gz
Change to the NPRE directory.
$ cd nrpe-4.0.3
Configure and Install the plugin.
$ sudo ./configure
$ sudo make check_nrpe
$ sudo make install-plugin
This will place the check_nrpe plugin in the /usr/local/nagios/libexec/ directory.
Step 6 – Start Nagios
With Nagios and the plugins installed, it is time to start the Nagios service.
$ sudo systemctl start nagios
Check the status of the service to see if it is running properly.
$ sudo systemctl status nagios
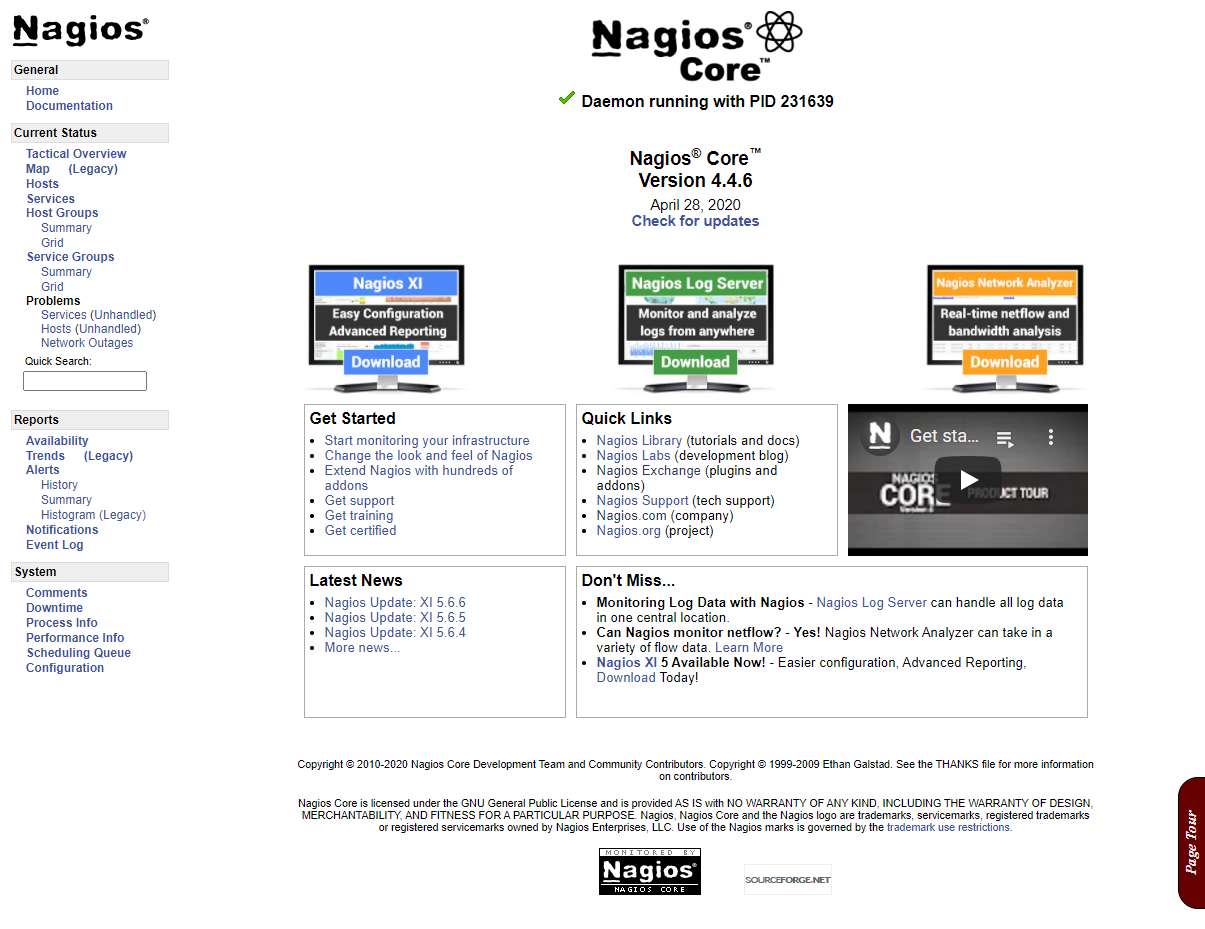
Nagios Web Interface
Open the URL http:///nagios in your browser. You should see a login prompt.
Enter the credentials you created during the HTTP authentication method and you should be greeted with the following screen.
Step 7 – Monitoring Hosts
To monitor a host, you need to install NRPE Daemon and Nagios plugins on the host. We will monitor a CentOS 8 based server from our Nagios server.
Log in to your host.
$ ssh [email protected]_server_ip
Install Nagios Plugins
Install the Nagios plugins by repeating step 4 from before.
Install NRPE
Install the prerequisites required for the NRPE daemon.
$ sudo dnf install -y gcc glibc glibc-common openssl openssl-devel perl wget
Switch to the /usr/src directory.
$ cd /usr/src
Download NRPE.
$ sudo wget https://github.com/NagiosEnterprises/nrpe/releases/download/nrpe-4.0.3/nrpe-4.0.3.tar.gz
Extract the archive.
$ sudo tar zxf nrpe-*.tar.gz
Change to the NPRE directory.
$ cd nrpe-4.0.3
Configure and install NPRE.
$ sudo ./configure --enable-command-args
$ sudo make all
Create the User and group.
$ sudo make install-groups-users
Install the NPRE Binaries, NPRE daemon and the check_npre plugin.
$ sudo make install
Install the configuration files.
$ sudo make install-config
Update the services file. The /etc/services file is used to translate service names to port numbers.
$ sudo sh -c "echo >> /etc/services"
$ sudo sh -c "sudo echo '# Nagios services' >> /etc/services"
$ sudo sh -c "sudo echo 'nrpe    5666/tcp' >> /etc/services"
Install the NPRE service daemon.
$ sudo make install-init
$ sudo systemctl enable nrpe
You need to update the NPRE configuration file located at /usr/local/nagios/etc/nrpe.cfg.
Open the file for editing.
$ sudo nano /usr/local/nagios/etc/nrpe.cfg
By default, NPRE listens to requests only from the localhost (127.0.0.1). You need to add the IP address of your Nagios server to the file.
allowed_hosts=127.0.0.1,10.25.5.2
The following option determines whether or not the NPRE daemon will allow clients to specify command arguments. Allow the option by entering the value as 1 which enables advanced NPRE configurations.
dont_blame_nrpe=1
Next, as you scroll down, you will come across a list of NRPE commands with their definitions. All of them are commented out. You need to uncomment them so that Nagios can use them.
Each command can be passed arguments. Some of the commands have arguments hardcoded in front of them while some can accept arguments from the user. Each command can have the following notification options.
- W = stands for Warning service states
- C = stands for Critical service states
- R = stands for notify on service recovering (OK states)
Thus, you can specify at what level which type of notification a command can send. We won’t be diving into the detailed description and function of each of the commands since they are beyond the scope of this tutorial.
# The following examples use hardcoded command arguments...
# This is by far the most secure method of using NRPE

command[check_users]=/usr/local/nagios/libexec/check_users -w 5 -c 10
command[check_load]=/usr/local/nagios/libexec/check_load -r -w .15,.10,.05 -c .30,.25,.20
command[check_hda1]=/usr/local/nagios/libexec/check_disk -w 20% -c 10% -p /dev/hda1
command[check_zombie_procs]=/usr/local/nagios/libexec/check_procs -w 5 -c 10 -s Z
command[check_total_procs]=/usr/local/nagios/libexec/check_procs -w 150 -c 200

# The following examples allow user-supplied arguments and can
# only be used if the NRPE daemon was compiled with support for
# command arguments *AND* the dont_blame_nrpe directive in this
# config file is set to '1'.  This poses a potential security risk, so
# make sure you read the SECURITY file before doing this.

### MISC SYSTEM METRICS ###
command[check_users]=/usr/local/nagios/libexec/check_users $ARG1$
command[check_load]=/usr/local/nagios/libexec/check_load $ARG1$
command[check_disk]=/usr/local/nagios/libexec/check_disk $ARG1$
command[check_swap]=/usr/local/nagios/libexec/check_swap $ARG1$
command[check_cpu_stats]=/usr/local/nagios/libexec/check_cpu_stats.sh $ARG1$
command[check_mem]=/usr/local/nagios/libexec/custom_check_mem -n $ARG1$

### GENERIC SERVICES ###
command[check_init_service]=sudo /usr/local/nagios/libexec/check_init_service $ARG1$
command[check_services]=/usr/local/nagios/libexec/check_services -p $ARG1$

### SYSTEM UPDATES ###
command[check_yum]=/usr/local/nagios/libexec/check_yum
command[check_apt]=/usr/local/nagios/libexec/check_apt

### PROCESSES ###
command[check_all_procs]=/usr/local/nagios/libexec/custom_check_procs
command[check_procs]=/usr/local/nagios/libexec/check_procs $ARG1$

### OPEN FILES ###
command[check_open_files]=/usr/local/nagios/libexec/check_open_files.pl $ARG1$

### NETWORK CONNECTIONS ###
command[check_netstat]=/usr/local/nagios/libexec/check_netstat.pl -p $ARG1$ $ARG2$
Uncomment the above commands by removing the # symbol in front of them. You can uncomment as many commands as you require.
Once you are finished, save the file by pressing Ctrl X and entering Y when prompted.
Allow the port 5666 which is used by the NPRE plugin.
$ sudo firewall-cmd --permanent --add-port=5666/tcp
Reload the firewall.
$ sudo systemctl reload firewalld
Start NPRE.
$ sudo systemctl start nrpe
All the commands from hereon will be run on the main Nagios server unless specified otherwise.
Check whether NRPE is working by running the following command on your main Nagios server.
$ /usr/local/nagios/libexec/check_nrpe -H monitored_server_ip
You should see the following output.
NRPE v4.0.3
To monitor the hosts, you’ll need to create configuration files for each host you want to monitor. These hosts will then become accessible via the Nagios web interface.
Create the directory for storing the configuration files and give it proper permissions.
$ sudo mkdir /usr/local/nagios/etc/servers
$ sudo chown -R nagios:nagios /usr/local/nagios/etc/servers
$ sudo chmod g w /usr/local/nagios/etc/servers
Open the Nagios configuration file /usr/local/nagios/etc/nagios.cfg for editing. Find the following file and uncomment by removing the # in front of it.
#cfg_dir=/usr/local/nagios/etc/servers
Save the file by pressing Ctrl X and entering Y when prompted.
The next step is to add the command check_nrpe to the /usr/local/nagios/etc/objects/commands.cfg file so that it can use it to monitor hosts.
Open the file /usr/local/nagios/etc/objects/commands.cfg for editing.
$ sudo nano /usr/local/nagios/etc/objects/commands.cfg
Paste the following code at the end of the file.
define command {
    command_name 				   check_nrpe
    command_line    			   $USER1$/check_nrpe -H $HOSTADDRESS$ -t 30 -c $ARG1$ $ARG2$
}
Save the file by pressing Ctrl X and entering Y when prompted.
Create a new configuration file for the remote host in the /usr/local/nagios/etc/servers/ directory.
$ sudo nano /usr/local/nagios/etc/servers/yourhost.cfg
Add the following code by replacing the host_name value with your remote hostname, the alias value with the description for your host and the address value with the IP address of your remote host.
define host {
        use                             linux-server
        host_name                       monitored_server_host_name
        alias                           My client server
        address                         monitored_server_private_ip
        max_check_attempts              5
        check_period                    24x7
        notification_interval           30
        notification_period             24x7
}
With this configuration, Nagios will let you know when the host is up or down. You will need to add more services to monitor additional things.
Add the following block to check connection statistics for the host.
define service {
      use                             generic-service
      host_name                       client01
      service_description             PING
      check_command                   check_ping!200.0,20%!400.0,90%
}
Add the following block to monitor the load average of your server.
define service {
        use                             generic-service
        host_name                       monitored_server_host_name
        service_description             Load average
        check_command                   check_nrpe!check_load!-a '-w 0.7,0.6,0.5 -c 0.9,0.8,0.7'
}
The use generic-service directive tells Nagios to inherit from a template called generic-servicepre-defined by Nagios.
Next, add a block to monitor the disk usage.
define service {
        use                             generic-service
        host_name                       monitored_server_host_name
        service_description             /dev/sda1 free space
        check_command                   check_nrpe!check_disk!-a '-w 20% -c 10% -p /dev/sda1'
}
Next, we can monitor the HTTP service using the following code block.
define service {
    use                 				generic-service
    host_name 					        monitored_server_host_name
    service_description 				HTTP
    check_command       				check_http
}
Monitor SSH using the following block. The following block will check the SSH server and generates an alert if the server doesn’t respond within 5 seconds.
define service {
    use                                 generic-service
    host_name                           nagiosclient
    service_description                 SSH Version Check
    check_command                       check_ssh!-t 5
}
Let us check the total number of processes running.
define service{
    use                     			generic-service
    host_name               			monitored_server_host_name
    service_description     			Total Processes
    check_command           			check_nrpe!check_total_procs
}
Check the currently logged-in users.
define service{
    use                     			generic-service
    host_name               			monitored_server_host_name
    service_description     			Current Users
    check_command           			check_nrpe!check_users!-a '-w 5 -c 10'
}
Check the root partition and its disk usage.
define service{
    use                     			generic-service
    host_name               			monitored_server_host_name
    service_description     			Root / Partition
    check_command           			check_nrpe!check_root
}
Check the SWAP disk usage.
define service{
    use                     			generic-service
    host_name               			monitored_server_host_name
    service_description     			SWAP Usage
    check_command           			check_nrpe!check_swap!-a '-w 40% -c 20%'
}
Save the file by pressing Ctrl X and entering Y when prompted.
Restart Nagios.
$ sudo systemctl restart nagios
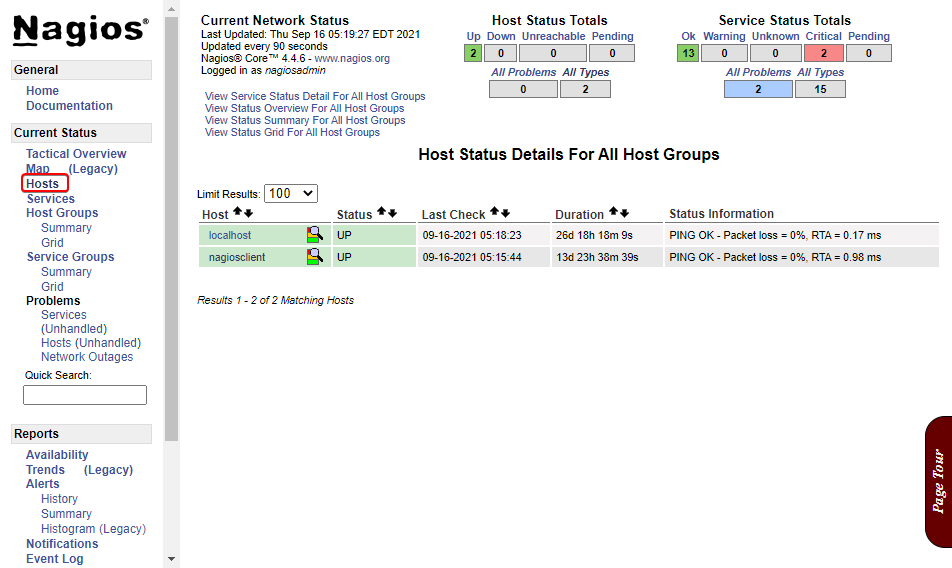
Check Monitors
Open your Nagios dashboard and click on the Hosts option from the left sidebar. You should see the newly configured host along with localhost on the page.
Click on the newly configured host (nagiosclient) and if everything is configured correctly, you should see its status. It would take a minute or so for the status to appear.
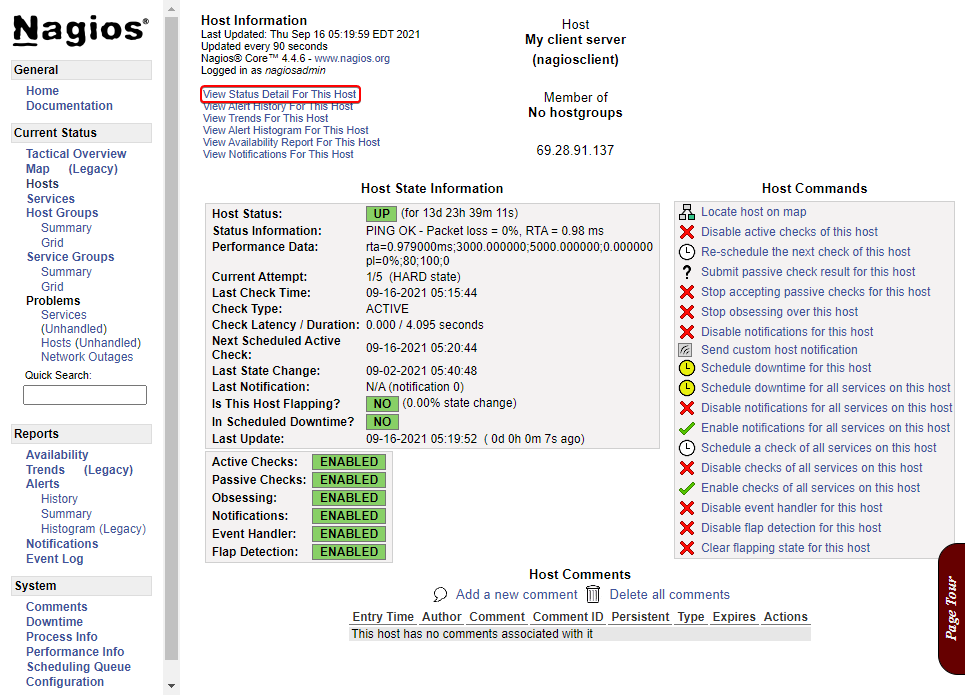
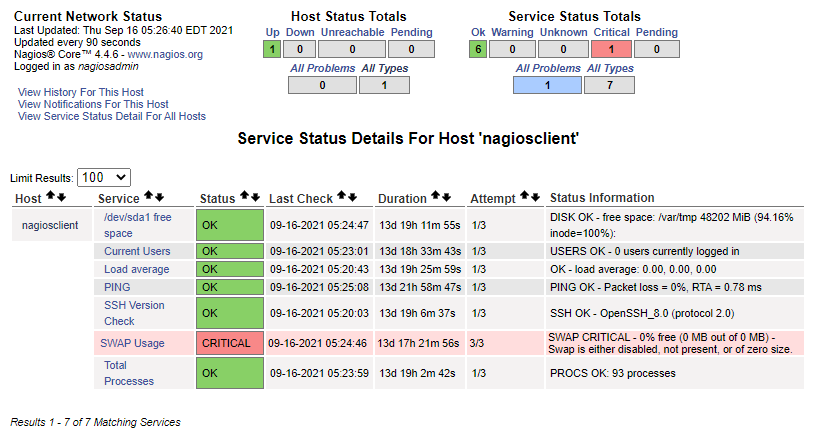
To see the services or the monitors we configured, click on the option View Status Detail For This Host and you should be greeted by the following page.
In our case, we haven’t configured Swap memory and hence we are getting critical status for the service since the Swap space is 0. This should give you a proper idea of how your hosts are working.
Step 8 – Install and Configure Nginx
You can either run Nagios directly via the Server IP or have it host it on your own domain name. Nagios already ships with Apache configuration files, but we will be using Nginx to run it. We will use Nginx as a reverse proxy in front of the Apache webserver.
Apache is already running it on port 80. Therefore, we need to change that first. And then, we can run Nginx as a proxy.
Open the file /etc/httpd/conf/httpd.conf for editing.
$ sudo nano /etc/httpd/conf/httpd.conf
Change the line Listen 80 to Listen 8080.
Save the file by pressing Ctrl X and entering Y when prompted.
Add the new IP address to your firewall.
$ sudo firewall-cmd --permanent --add-port=8080/tcp
$ sudo systemctl reload firewalld
Restart the Apache server.
$ sudo systemctl restart httpd
Next, install Nginx.
CentOS 8 ships with Nginx 1.14 by default, but it is an old version. We can enable the latest version as well.
$ sudo dnf module enable nginx:1.20
$ sudo dnf install nginx
Enable the Nginx server.
$ sudo systemctl enable nginx
Step 8a – Install and Configure SSL
Before configuring Nginx, we will set up and configure an SSL certificate for the domain we are going to use with Nagios. In our case, we will be using http://nagios.example.com.
To install an SSL certificate using Let’s Encrypt, we need to download the Certbot tool. Certbot is available from the EPEL repository of CentOS which we already added earlier in the tutorial.
$ sudo dnf install certbot python3-certbot-nginx
Stop the Nginx service.
$ sudo systemctl stop nginx
Generate an SSL certificate.
$ sudo certbot certonly --standalone --preferred-challenges --agree-tos --email [email protected] http -d nagios.example.com
The above command will download a certificate to the /etc/letsencrypt/live/nagios.example.com directory on your server.
Create a Cron Job to renew the SSL. It will run every day to check the certificate and renew if needed. For that, first, create the file /etc/cron.daily/certbot-renew and open it for editing.
$ sudo nano /etc/cron.daily/certbot-renew
Paste the following code.
#!/bin/sh
certbot renew --cert-name nagios.example.com --pre-hook "systemctl stop nginx" --post-hook "systemctl start nginx"
Save the file by pressing Ctrl X and entering Y when prompted.
Change the permissions on the task file to make it executable.
$ sudo chmod x /etc/cron.daily/certbot-renew
Generate a Diffie-Hellman group certificate.
$ sudo openssl dhparam -out /etc/ssl/certs/dhparam.pem 2048
Before configuring Nginx, there is another change we should make. By default, Apache serves Nagios over http://:8080/nagios. Now, we can set up a proxy directly over with Nagios, but it will be served over https://nagios.example.com/nagios. We can do a redirect over at Nginx to the root URL which complicates stuff. For that reason, we will make a change at Apache and Nagios directly.
First, open the /usr/local/nagios/etc/cgi.cfg file for editing.
$ sudo nano /usr/local/nagios/etc/cgi.cfg
Change url_html_path=/nagios to url_html_path=/.
Save the file by pressing Ctrl X and entering Y when prompted.
Next, open /etc/httpd/conf.d/nagios.conf for editing.
$ sudo nano /etc/httpd/conf.d/nagios.conf
Change ScriptAlias /nagios/cgi-bin "https://www.howtoforge.com/usr/local/nagios/sbin" to ScriptAlias /cgi-bin "https://www.howtoforge.com/usr/local/nagios/sbin".
Comment out the line Alias /nagios "https://www.howtoforge.com/usr/local/nagios/share" by changing it to the following.
#Alias /nagios "https://www.howtoforge.com/usr/local/nagios/share"
Add the following line below it.
DocumentRoot /usr/local/nagios/share
Add the following line to the top of the file.
Add the following line at the bottom of the file.
Once you are finished, save the file by pressing Ctrl X and entering Y when prompted.
And at last, open the file /usr/local/nagios/share/config.inc.php for editing.
$ sudo nano /usr/local/nagios/share/config.inc.php
Change $cfg['cgi_base_url']='/nagios/cgi-bin'; to $cfg['cgi_base_url']='/cgi-bin';.
Save the file by pressing Ctrl X and entering Y when prompted.
Restart both Apache and Nagios.
$ sudo systemctl restart httpd
$ sudo systemctl restart nagios
To confirm everything works correctly, open the URL http://:1080 in your browser and you should see Nagios working properly. Also, make sure the Hosts’ data is being received.
Once everything is working, we can proceed to create our configuration file for Nginx.
Create a configuration file for Nagios in the /etc/nginx/conf.d directory.
$ sudo nano /etc/nginx/conf.d/nagios.conf
Paste the following code in it.
server {
    	listen 80; listen [::]:80;
	    server_name nagios.example.com;
    	return 301 https://$host$request_uri;
}

server {
        server_name nagios.example.com;

        listen 443 ssl http2;
        listen [::]:443 ssl http2;

        access_log /var/log/nginx/nagios.access.log;
        error_log /var/log/nginx/nagios.error.log;

        ssl_certificate /etc/letsencrypt/live/nagios.example.com/fullchain.pem;
        ssl_certificate_key /etc/letsencrypt/live/nagios.example.com/privkey.pem;
        ssl_trusted_certificate /etc/letsencrypt/live/nagios.example.com/chain.pem;
        ssl_session_timeout 1d;
        ssl_session_cache shared:MozSSL:10m;
        ssl_session_tickets off;

        ssl_protocols TLSv1.2 TLSv1.3;
        ssl_ciphers ECDHE-ECDSA-AES128-GCM-SHA256:ECDHE-RSA-AES128-GCM-SHA256:ECDHE-ECDSA-AES256-GCM-SHA384:ECDHE-RSA-AES256-GCM-SHA384:ECDHE-ECDSA-CHACHA20-POLY1305:ECDHE-RSA-CHACHA20-POLY1305:DHE-RSA-AES128-GCM-SHA256:DHE-RSA-AES256-GCM-SHA384;

        ssl_stapling on;
        ssl_stapling_verify on;
        ssl_dhparam /etc/ssl/certs/dhparam.pem;

        location / {
                proxy_pass http://127.0.0.1:8080;
                proxy_set_header X-Forwarded-For $proxy_add_x_forwarded_for;
		       proxy_set_header Host $host;
                proxy_set_header X-Real-IP $remote_addr;
        	    proxy_set_header X-Forwarded-Proto $scheme;
        }
}
Once you are finished, save the file by pressing Ctrl X and entering Y when prompted.
Validate the configuration file.
$ sudo nginx -t
If you get the following error, you will need to edit the file /etc/nginx/nginx.conf to add/adjust the size of the variable server_names_hash_bucket_size.
nginx: [emerg] could not build the server_names_hash, you should increase server_names_hash_bucket_size
Open the file /etc/nginx/nginx.conf for editing.
$ sudo nano /etc/nginx/nginx.conf
Add the following line before
server_names_hash_bucket_size 64;
Once you are finished, save the file by pressing Ctrl X and entering Y when prompted. Validate Nginx again.
If you see no issues, then start the Nginx server.
$ sudo systemctl start nginx
Launch the domain https://nagios.example.com in your browser, and you should be greeted with the Nagios homepage.
Conclusion
You have installed and configured Nagios on a CentOS 8 based server to monitor several services like the load, disk/swap usage, users, total processes, HTTP and SSH. This concludes our tutorial. If you want to learn more, you should check the official Nagios documentation covering monitoring and various commands in great detail. If you have any questions, post them in the comments below.


