
Suricata is a Network Monitoring tool that examines and processes every packet of internet traffic that flows through your server. It can generate log events, trigger alerts, and drop traffic upon detecting any suspicious activity.
You can install Suricata on a single machine to monitor its traffic or deploy it on a gateway host to scan all incoming and outgoing traffic from other servers connected to it. You can combine Suricata with Elasticsearch, Kibana, and Filebeat to create a Security Information and Event Management(SIEM) tool.
In this tutorial, you will install Suricata IDS and ElasticStack on a Rocky Linux 9 server. The various components of the stack are:
- Elasticsearch to store, index, correlate and search the security events from the server.
- Kibana to display the logs stored in Elasticsearch.
- Filebeat to parse Suricata’s
eve.jsonlog file and send each event to Elasticsearch for processing. - Suricata scans the network traffic for suspicious events and drops the invalid packets.
The tutorial is divided into two parts, the first part will deal with installing and configuring Suricata, and the second part will deal with installing and configuring Elastic Stack.
For our tutorial, we will install Suricata and the Elastic stack on different servers.
Prerequisites
-
The servers hosting the Elastic Stack and Suricata should have a minimum of 4GB RAM and 2 CPU cores.
-
The servers should be able to communicate using private IP addresses.
-
The servers should be running Rocky Linux 9 with a non-root sudo user.
-
The servers should be updated.
$ sudo dnf update
-
If you want to access Kibana dashboards from everywhere, set up a domain (
kibana.example.com) pointing to the server where Suricata will be installed. -
Install essential packages on both servers.
$ sudo dnf install yum-utils nano curl wget policycoreutils-python-utils -y
PART 1
Step 1 – Install Suricata
To install Suricata, you need to add the Open Information Security Foundation’s (OISF) package repository to your server.
$ sudo dnf install 'dnf-command(copr)'
$ sudo dnf copr enable @oisf/suricata-7.0
The first command enables the Community projects (copr) for the dnf package installer. The second command enables the OISF repository to be added to your system. suricata-7.0 Enables the repository to access the latest stable version of the software. Press y and ENTER each time you are prompted.
Next, add the EPEL repository.
$ sudo dnf install -y epel-release dnf-plugins-core
Install Suricata.
$ sudo dnf install -y suricata
Enable the Suricata service.
$ sudo systemctl enable suricata
Step 2 – Configure Suricata
Suricata stores its configuration in the /etc/suricata/suricata.yaml file. The default mode for Suricata is the IDS (Intrusion Detection System) Mode, where the traffic is only logged and not stopped. If you are new to Suricata, you should leave the mode unchanged. Once you have configured it and learned more, you can turn on the IPS (Intrusion Prevention System) mode.
The Community ID field makes correlating data between records generated by different monitoring tools easier. Since we will use Suricata with Elasticsearch, enabling Community ID can be helpful.
Open the file /etc/suricata/suricata.yaml for editing.
$ sudo nano /etc/suricata/suricata.yaml
Locate the line # Community Flow ID and set the value of the variable community-id to true.
. . .
      # Community Flow ID
      # Adds a 'community_id' field to EVE records. These are meant to give
      # records a predictable flow ID that can be used to match records to
      # output of other tools such as Zeek (Bro).
      #
      # Takes a 'seed' that needs to be same across sensors and tools
      # to make the id less predictable.

      # enable/disable the community id feature.
      community-id: true
. . .
Save the file by pressing Ctrl X and entering Y when prompted.
Now, your events will carry an ID like 1:S 3BA2UmrHK0Pk u3XH78GAFTtQ= that you can use to match datasets across different monitoring tools.
Select Network Interface
The default Suricata configuration file inspects traffic on the eth0 device/network interface. If your server uses a different network interface, you will need to update that in the configuration.
Check the device name of your network interface using the following command.
$ ip -p -j route show default
You will receive an output like the following.
[ {
        "dst": "default",
        "gateway": "172.31.1.1",
        "dev": "eth0",
        "protocol": "dhcp",
        "prefsrc": "65.108.61.177",
        "metric": 100,
        "flags": [ ]
    } ]
The dev variable refers to the networking device. In our output, it shows eth0 as the networking device. Your output may be different depending on your system.
Now that you know your device name open the configuration file.
$ sudo nano /etc/suricata/suricata.yaml
Find the line af-packet: around line number 580. Under it, set the value of the variable interface to the device name for your system.
# Linux high speed capture support
af-packet:
  - interface: eth0
    # Number of receive threads. "auto" uses the number of cores
    #threads: auto
    # Default clusterid. AF_PACKET will load balance packets based on flow.
    cluster-id: 99
. . .
If you want to add additional interfaces, you can do so by adding them at the bottom of the af-packet section at around line 650.
To add a new interface, insert it just above the - interface: default section as shown below.
    #  For eBPF and XDP setup including bypass, filter and load balancing, please
    #  see doc/userguide/capture-hardware/ebpf-xdp.rst for more info.

  - interface: enp0s1
    cluster-id: 98
...
  - interface: default
    #threads: auto
    #use-mmap: no
    #tpacket-v3: yes
We have added a new interface enp0s1 and a unique value for the cluster-id variable in our example. You need to include a unique cluster id with every interface you add.
Find the line pcap: , and under it, set the variable’s value interface to the device name for your system.
# Cross platform libpcap capture support
pcap:
  - interface: eth0
    # On Linux, pcap will try to use mmap'ed capture and will use "buffer-size"
    # as total memory used by the ring. So set this to something bigger
    # than 1% of your bandwidth.
To add a new interface just like before, insert it just above the - interface: default section as shown below.
- interface: enp0s1
# Put default values here
  - interface: default
    #checksum-checks: auto
Once you are finished, save the file by pressing Ctrl X and entering Y when prompted.
Live Rule Reload
You need to restart Suricata every time you add, remove and edit its rules. You don’t need to do anything to enable it, though, as it is enabled by default.
With live reloading enabled, you can use the following command to reload rules without restarting the Suricata process.
$ sudo kill -usr2 $(pidof suricata)
The $(pidof suricata) flag locates the process ID of the Suricata process. The -usr2 part of the kill command sends a SIGUSR2 signal to the Suricata process. The SIGUSR2 signal is configured with Suricata to reload the rules.
Configure Directory permissions
Suricata automatically created a system user and group named suricata during the installation process. You need to give proper directory permissions for the installation to work properly.
Run the following command to set suricata as the group for Suricata’s directories.
$ sudo chgrp -R suricata /etc/suricata
$ sudo chgrp -R suricata /var/lib/suricata
$ sudo chgrp -R suricata /var/log/suricata
Set the group permissions for reading and writing.
$ sudo chmod -R g r /etc/suricata/
$ sudo chmod -R g rw /var/lib/suricata
$ sudo chmod -R g rw /var/log/suricata
Add Current User to the Suricata Group
Suricata automatically created a system user and group named suricata during the installation process. Add your current username to the suricata group so that you can perform operations directly without needing sudo.
$ sudo usermod -a -G suricata $USER
To apply the new group membership, log out of the server and back in, or type the following:
$ su - ${USER}
You will be prompted to enter your user’s password to continue.
Confirm that your user is now added to the suricata group by typing:
$ id -nG
username wheel suricata
Step 3 – Configure Suricata Rules
Suricata, by default, only uses a limited set of rules to detect network traffic. You can add more rulesets from external providers using a tool called suricata-update. Run the following command to include additional rules.
$ suricata-update
14/4/2024 -- 01:32:58 -  -- Using data-directory /var/lib/suricata.
14/4/2024 -- 01:32:58 -  -- Using Suricata configuration /etc/suricata/suricata.yaml
14/4/2024 -- 01:32:58 -  -- Using /usr/share/suricata/rules for Suricata provided rules.
14/4/2024 -- 01:32:58 -  -- Found Suricata version 7.0.4 at /usr/sbin/suricata.
.....
14/4/2024 -- 01:32:58 -  -- No sources configured, will use Emerging Threats Open
14/4/2024 -- 01:32:58 -  -- Fetching https://rules.emergingthreats.net/open/suricata-7.0.4/emerging.rules.tar.gz.
 100% - 4243799/4243799
14/4/2024 -- 01:33:00 -  -- Done.
14/4/2024 -- 01:33:00 -  -- Loading distribution rule file /usr/share/suricata/rules/app-layer-events.rules
.....
14/4/2024 -- 01:33:04 -  -- Writing rules to /var/lib/suricata/rules/suricata.rules: total: 48646; enabled: 37144; added: 48646; removed 0; modified: 0
14/4/2024 -- 01:33:04 -  -- Writing /var/lib/suricata/rules/classification.config
14/4/2024 -- 01:33:04 -  -- Testing with suricata -T.
14/4/2024 -- 01:33:41 -  -- Done.
Add Ruleset Providers
You can expand Suricata’s rules by adding more providers. It can fetch rules from a variety of free and commercial providers.
You can list the default provider list by using the following command.
$ suricata-update list-sources
For example, if you want to include the tgreen/hunting ruleset, you can enable it with the following command.
$ suricata-update enable-source tgreen/hunting
14/4/2024 -- 01:37:07 -  -- Using data-directory /var/lib/suricata.
14/4/2024 -- 01:37:07 -  -- Using Suricata configuration /etc/suricata/suricata.yaml
14/4/2024 -- 01:37:07 -  -- Using /usr/share/suricata/rules for Suricata provided rules.
14/4/2024 -- 01:37:07 -  -- Found Suricata version 7.0.4 at /usr/sbin/suricata.
14/4/2024 -- 01:37:07 -  -- Source index does not exist, will use bundled one.
14/4/2024 -- 01:37:07 -  -- Please run suricata-update update-sources.
14/4/2024 -- 01:37:07 -  -- Creating directory /var/lib/suricata/update/sources
14/4/2024 -- 01:37:07 -  -- Enabling default source et/open
14/4/2024 -- 01:37:07 -  -- Source tgreen/hunting enabled
Run the suricata-update command again to download and update the new rules. Suricata, by default, can process any rule changes without restarting.
Step 4 – Validate Suricata Configuration
Suricata ships with a validation tool to check the configuration file and rules for errors. Run the following command to run the validation tool.
$ suricata -T -c /etc/suricata/suricata.yaml -v
Notice: suricata: This is Suricata version 7.0.4 RELEASE running in SYSTEM mode
Info: cpu: CPUs/cores online: 2
Info: suricata: Running suricata under test mode
Info: suricata: Setting engine mode to IDS mode by default
Info: exception-policy: master exception-policy set to: auto
Info: logopenfile: fast output device (regular) initialized: fast.log
Info: logopenfile: eve-log output device (regular) initialized: eve.json
Info: logopenfile: stats output device (regular) initialized: stats.log
Info: detect: 1 rule files processed. 37144 rules successfully loaded, 0 rules failed, 0
Info: threshold-config: Threshold config parsed: 0 rule(s) found
Info: detect: 37147 signatures processed. 1194 are IP-only rules, 4892 are inspecting packet payload, 30849 inspect application layer, 108 are decoder event only
Notice: suricata: Configuration provided was successfully loaded. Exiting.
The -T flag instructs Suricata to run in testing mode, the -c flag configures the location of the configuration file, and the -v flag prints the verbose output of the command. Depending upon your system configuration and the number of rules added, the command can take a few minutes to finish.
Step 5 – Running Suricata
Now that Suricata is configured and set up, it is time to run the application.
$ sudo systemctl start suricata
Check the status of the process.
$ sudo systemctl status suricata
You should see the following output if everything is working correctly.
? suricata.service - Suricata Intrusion Detection Service
     Loaded: loaded (/usr/lib/systemd/system/suricata.service; enabled; preset: disabled)
     Active: active (running) since Sun 2024-04-14 01:45:43 UTC; 4s ago
       Docs: man:suricata(1)
    Process: 6081 ExecStartPre=/bin/rm -f /var/run/suricata.pid (code=exited, status=0/SUCCESS)
   Main PID: 6082 (Suricata-Main)
      Tasks: 1 (limit: 22569)
     Memory: 111.8M
        CPU: 4.318s
     CGroup: /system.slice/suricata.service
             ??6082 /sbin/suricata -c /etc/suricata/suricata.yaml --pidfile /var/run/suricata.pid -i eth0 --user suricata

Apr 14 01:45:43 suricata systemd[1]: Starting Suricata Intrusion Detection Service...
Apr 14 01:45:43 suricata systemd[1]: Started Suricata Intrusion Detection Service.
Apr 14 01:45:43 suricata suricata[6082]: i: suricata: This is Suricata version 7.0.4 RELEASE running in SYSTEM mode
You may see the following errors in the service status.
Apr 15 02:20:13 suricata suricata[5554]: E: logopenfile: Error opening file: "https://www.howtoforge.com/var/log/suricata//fast.log": Permission denied
Apr 15 02:20:13 suricata suricata[5554]: W: runmodes: output module "fast": setup failed
Apr 15 02:20:13 suricata suricata[5554]: E: logopenfile: Error opening file: "https://www.howtoforge.com/var/log/suricata//eve.json": Permission denied
Apr 15 02:20:13 suricata suricata[5554]: W: runmodes: output module "eve-log": setup failed
Apr 15 02:20:13 suricata suricata[5554]: E: logopenfile: Error opening file: "https://www.howtoforge.com/var/log/suricata//stats.log": Permission denied
Apr 15 02:20:13 suricata suricata[5554]: W: runmodes: output module "stats": setup failed
You will need to set the permissions again.
$ sudo chown -R suricata:suricata /var/log/suricata
Restart the Suricata service.
$ sudo systemctl restart suricata
The process can take a few minutes to finish parsing all the rules. Therefore, the above status check is not a complete indication of whether Suricata is up and ready. You can monitor the log file for that using the following command.
$ sudo tail -f /var/log/suricata/suricata.log
If you see the following lines, it means Suricata is running and ready to monitor network traffic.
[5577 - Suricata-Main] 2024-04-15 02:22:52 Info: exception-policy: master exception-policy set to: auto
[5577 - Suricata-Main] 2024-04-15 02:22:52 Info: ioctl: eth0: MTU 1500
[5577 - Suricata-Main] 2024-04-15 02:22:52 Info: privs: dropped the caps for main thread
[5577 - Suricata-Main] 2024-04-15 02:22:52 Info: conf: Running in live mode, activating unix socket
[5577 - Suricata-Main] 2024-04-15 02:22:52 Info: logopenfile: fast output device (regular) initialized: fast.log
[5577 - Suricata-Main] 2024-04-15 02:22:52 Info: logopenfile: eve-log output device (regular) initialized: eve.json
[5577 - Suricata-Main] 2024-04-15 02:22:52 Info: logopenfile: stats output device (regular) initialized: stats.log
[5577 - Suricata-Main] 2024-04-15 02:23:03 Info: detect: 1 rule files processed. 37144 rules successfully loaded, 0 rules failed, 0
[5577 - Suricata-Main] 2024-04-15 02:23:03 Info: threshold-config: Threshold config parsed: 0 rule(s) found
[5577 - Suricata-Main] 2024-04-15 02:23:04 Info: detect: 37147 signatures processed. 1194 are IP-only rules, 4892 are inspecting packet payload, 30849 inspect application layer, 108 are decoder event only
[5577 - Suricata-Main] 2024-04-15 02:23:32 Info: runmodes: eth0: creating 2 threads
[5577 - Suricata-Main] 2024-04-15 02:23:32 Info: unix-manager: unix socket '/var/run/suricata/suricata-command.socket'
[5577 - Suricata-Main] 2024-04-15 02:23:32 Notice: threads: Threads created -> W: 2 FM: 1 FR: 1   Engine started.
Press Ctrl C to exit the output.
Step 6 – Testing Suricata Rules
We will check whether Suricata is detecting any suspicious traffic. The Suricata guide recommends testing the ET Open rule number 2100498 using the following command.
$ curl http://testmynids.org/uid/index.html
You will get the following response.
uid=0(root) gid=0(root) groups=0(root)
The above command pretends to return the output of the id command that can be run on a compromised system. To test whether Suricata detected the traffic, you need to check the log file using the specified rule number.
$ grep 2100498 /var/log/suricata/fast.log
If your request used IPv6, you should see the following output.
02/22/2022-23:24:33.997371 [**] [1:2100498:7] GPL ATTACK_RESPONSE id check returned root [**] [Classification: Potentially Bad Traffic] [Priority: 2] {TCP} 2600:9000:2204:5c00:0018:30b3:e400:93a1:80 -> 2a03:b0c0:0002:00d0:0000:0000:0fc2:b001:41468
If your request used IPv4, you would see the following output.
02/22/2022-23:21:46.783476 [**] [1:2100498:7] GPL ATTACK_RESPONSE id check returned root [**] [Classification: Potentially Bad Traffic] [Priority: 2] {TCP} 204.246.178.81:80 -> 164.90.192.1:36364
Suricata also logs events to the /var/log/suricata/eve.log file using JSON format. To read and interpret those rules, you need to install jq which is outside the scope of this tutorial.
PART 2
We are done with part one of the tutorial, where we installed Suricata and tested it. The next part involves installing the ELK stack and setting it up to visualize Suricata and its logs. Part two of the tutorial is supposed to be done on the second server unless otherwise specified.
Step 7 – Install Elasticsearch and Kibana
The first step in installing Elasticsearch involves adding the Elastic GPG key to your server.
$ sudo rpm --import https://artifacts.elastic.co/GPG-KEY-elasticsearch
Create a repository for the Elasticsearch package by creating and opening the file /etc/yum/yum.repos.d/elasticsearch.repo for editing.
$ sudo nano /etc/yum.repos.d/elasticsearch.repo
Paste the following code in it.
[elasticsearch]
name=Elasticsearch repository for 8.x packages
baseurl=https://artifacts.elastic.co/packages/8.x/yum
gpgcheck=1
gpgkey=https://artifacts.elastic.co/GPG-KEY-elasticsearch
enabled=0
autorefresh=1
type=rpm-md
Save the file by pressing Ctrl X and entering Y when prompted.
Install Elasticsearch and Kibana.
$ sudo dnf install --enablerepo=elasticsearch elasticsearch kibana
You need to use the flag --enablerepo=elasticsearch every time since we have kept the repository disabled by default. This prevents accidental upgradation of these packages.
You will get the following output on Elasticsearch’s installation.
--------------------------- Security autoconfiguration information ------------------------------

Authentication and authorization are enabled.
TLS for the transport and HTTP layers is enabled and configured.

The generated password for the elastic built-in superuser is : ilc Gju=gZTxQHI4cSkF

If this node should join an existing cluster, you can reconfigure this with
'/usr/share/elasticsearch/bin/elasticsearch-reconfigure-node --enrollment-token '
after creating an enrollment token on your existing cluster.

You can complete the following actions at any time:

Reset the password of the elastic built-in superuser with
'/usr/share/elasticsearch/bin/elasticsearch-reset-password -u elastic'.

Generate an enrollment token for Kibana instances with
 '/usr/share/elasticsearch/bin/elasticsearch-create-enrollment-token -s kibana'.

Generate an enrollment token for Elasticsearch nodes with
'/usr/share/elasticsearch/bin/elasticsearch-create-enrollment-token -s node'.

-------------------------------------------------------------------------------------------------
Locate your server’s private IP address using the following command.
$ ip -brief address show
lo               UNKNOWN        127.0.0.1/8 ::1/128
eth0             UP             37.27.84.123/32 2a01:4f9:c012:db02::1/64 fe80::9400:3ff:fe34:d589/64
eth1             UP             10.0.0.2/32 fe80::8400:ff:fe84:5baf/64
Note down the private IP of your server ( 10.0.0.2 in this case). We will refer to it as your_private_IP. The public IP address of the server ( 37.27.84.123) will be referred to as your_public_IP in the remaining tutorial. Also, note the network name of your server, eth1.
Step 8 – Configure Elasticsearch
Elasticsearch stores its configuration in the /etc/elasticsearch/elasticsearch.yml file. Open the file for editing.
$ sudo nano /etc/elasticsearch/elasticsearch.yml
Elasticsearch only accepts local connections by default. We need to change it so that Kibana can access it over the private IP address.
Find the line #network.host: 192.168.0.1 and add the following line right below it, as shown below.
# By default Elasticsearch is only accessible on localhost. Set a different
# address here to expose this node on the network:
#
#network.host: 192.168.0.1
network.bind_host: ["127.0.0.1", "your_private_IP"]
#
# By default Elasticsearch listens for HTTP traffic on the first free port it
# finds starting at 9200. Set a specific HTTP port here:
This will ensure that Elastic can still accept local connections while being available to Kibana over the private IP address.
The next step is to turn on some security features and ensure that Elastic is configured to run on a single node. To do that, add the following lines at the end of the file.
. . .
discovery.type: single-node
If you are going to use multiple Elastic search nodes, you can omit it.
Also, comment out the following line by adding a hash (#) in front of it.
#cluster.initial_master_nodes: ["elastic"]
Once you are finished, save the file by pressing Ctrl X and entering Y when prompted.
Configure JVM Heap Size
Before starting Elasticsearch, we need to configure the memory used by Elasticsearch. Create and open the /etc/elasticsearch/jvm.options.d/jvm-heap.options file for editing.
$ sudo nano /etc/elasticsearch/jvm.options.d/jvm-heap.options
Paste the following lines in it.
-Xms3g
-Xmx3g
Save the file by pressing Ctrl X and entering Y when prompted. Here, we are giving Elasticsearch 3GB of space. Choose the value according to your server size.
Configure Firewall
Add the proper firewall rules for Elasticsearch so that it is accessible via the private network.
$ sudo firewall-cmd --permanent --zone=internal --change-interface=eth1
$ sudo firewall-cmd --permanent --zone=internal --add-service=elasticsearch
$ sudo firewall-cmd --permanent --zone=internal --add-service=kibana
$ sudo firewall-cmd --permanent --add-port=5601/tcp
$ sudo firewall-cmd --reload
Make sure you choose the interface name in the first command like the one you got from step 7. The above commands change the default zone of the Firewall to internal and open ports 9200, and 9300 for Elasticsearch, and port 5601 for Kibana.
Start Elasticsearch
Now that you have configured Elasticsearch, it is time to start the service.
Reload the system daemon.
$ sudo systemctl daemon-reload
Enable and Start the Elasticsearch server.
$ sudo systemctl enable elasticsearch --now
Check the status of the service.
$ sudo systemctl status elasticsearch
? elasticsearch.service - Elasticsearch
     Loaded: loaded (/usr/lib/systemd/system/elasticsearch.service; enabled; preset: disabled)
     Active: active (running) since Sun 2024-04-14 03:51:12 UTC; 1min 20s ago
       Docs: https://www.elastic.co
   Main PID: 5987 (java)
      Tasks: 74 (limit: 22569)
     Memory: 3.4G
        CPU: 50.532s
     CGroup: /system.slice/elasticsearch.service
Create Elasticsearch Passwords
After enabling the security setting of Elasticsearch, the next step is to generate the password for the Elasticsearch superuser. The default password was provided during the installation which you can use but it is recommended to modify it.
Run the following command to reset the Elasticsearch password. Choose a strong password.
$ sudo /usr/share/elasticsearch/bin/elasticsearch-reset-password -u elastic -i
This tool will reset the password of the [elastic] user.
You will be prompted to enter the password.
Please confirm that you would like to continue [y/N]y


Enter password for [elastic]:
Re-enter password for [elastic]:
Password for the [elastic] user successfully reset.
Now, let us test if Elasticsearch responds to queries.
$ sudo curl --cacert /etc/elasticsearch/certs/http_ca.crt -u elastic https://localhost:9200
Enter host password for user 'elastic':
{
  "name" : "elastic",
  "cluster_name" : "elasticsearch",
  "cluster_uuid" : "VSP7LEZURF6SR8I1BPF9RQ",
  "version" : {
    "number" : "8.13.2",
    "build_flavor" : "default",
    "build_type" : "rpm",
    "build_hash" : "16cc90cd2d08a3147ce02b07e50894bc060a4cbf",
    "build_date" : "2024-04-05T14:45:26.420424304Z",
    "build_snapshot" : false,
    "lucene_version" : "9.10.0",
    "minimum_wire_compatibility_version" : "7.17.0",
    "minimum_index_compatibility_version" : "7.0.0"
  },
  "tagline" : "You Know, for Search"
}
This confirms that Elasticsearch is fully functional and running smoothly.
Step 9 – Configure Kibana
The first step in configuring Kibana is to copy the Elasticsearch certificate to the Kibana directory.
$ sudo cp /etc/elasticsearch/certs/http_ca.crt /etc/kibana/
Next, enable the xpack security function by generating secret keys. Kibana uses these secret keys to store data in Elasticsearch. The utility to generate secret keys can be accessed from the /usr/share/kibana/bin directory.
$ sudo /usr/share/kibana/bin/kibana-encryption-keys generate -q
The -q flag suppresses the command instructions. You will receive an output like the following.
xpack.encryptedSavedObjects.encryptionKey: fdce3576894a0a7b12a639a40f643acd
xpack.reporting.encryptionKey: 92f426be0f487b7d8dd191b86443f2a6
xpack.security.encryptionKey: 34bf00781dbe85d1dcd99dc94ef1c9b7
Copy the output.
Open the Kibana’s configuration file at /etc/kibana/kibana.yml for editing.
$ sudo nano /etc/kibana/kibana.yml
Paste the code from the previous command at the end of the file.
. . .

# Maximum number of documents loaded by each shard to generate autocomplete suggestions.
# This value must be a whole number greater than zero. Defaults to 100_000
#unifiedSearch.autocomplete.valueSuggestions.terminateAfter: 100000

xpack.encryptedSavedObjects.encryptionKey: fdce3576894a0a7b12a639a40f643acd
xpack.reporting.encryptionKey: 92f426be0f487b7d8dd191b86443f2a6
xpack.security.encryptionKey: 34bf00781dbe85d1dcd99dc94ef1c9b7
Configure Kibana Host
Kibana needs to be configured so that it’s accessible on the server’s private IP address. Find the line #server.host: "localhost" in the file and add the following line right below it as shown.
# Kibana is served by a back end server. This setting specifies the port to use.
#server.port: 5601

# Specifies the address to which the Kibana server will bind. IP addresses and host names are both valid values.
# The default is 'localhost', which usually means remote machines will not be able to connect.
# To allow connections from remote users, set this parameter to a non-loopback address.
#server.host: "localhost"
server.host: "your_private_IP"
Turn off Telemetry
Kibana sends data back to their servers by default. This can affect performance and also is a privacy risk. Therefore, you should turn off Telemetry. Add the following code at the end of the file to turn Telemetry off. The first setting turns off Telemetry and the second setting disallows overwriting the first setting from the Advanced Settings section in Kibana.
telemetry.optIn: false
telemetry.allowChangingOptInStatus: false
Configure SSL
Find the variable elasticsearch.ssl.certificateAuthorities , uncomment it, and change its value as shown below.
elasticsearch.ssl.certificateAuthorities: [ "https://www.howtoforge.com/etc/kibana/http_ca.crt" ]
Once you are finished, save the file by pressing Ctrl X and entering Y when prompted.
Configure Kibana Access
The next step is to generate an enrollment token which we will use later on to log into the Kibana web interface.
$ sudo /usr/share/elasticsearch/bin/elasticsearch-create-enrollment-token -s kibana
eyJ2ZXIiOiI4LjEzLjIiLCJhZHIiOlsiMzcuMjcuODQuMTIzOjkyMDAiXSwiZmdyIjoiMmI2ZjhhOWRiOWJjMDU5NDk0NGE0OGFkMjMxODg2NzYxNTViZGViN2U5YjY4MmY3N2MzYmI3ZDk2Nzc3YjY0NyIsImtleSI6InppVU0zSTRCOE5lSHBLU3k2T0owOnBLNHJiWjBZVHYybWNTbmxrTXlqbncifQ==
Starting Kibana
Now that you have configured secure access and networking for Kibana start and enable the process.
$ sudo systemctl enable kibana --now
Check the status to see if it is running.
$ sudo systemctl status kibana
? kibana.service - Kibana
     Loaded: loaded (/usr/lib/systemd/system/kibana.service; enabled; preset: disabled)
     Active: active (running) since Sun 2024-04-14 04:25:54 UTC; 963ms ago
       Docs: https://www.elastic.co
   Main PID: 6464 (node)
      Tasks: 7 (limit: 22569)
     Memory: 48.2M
        CPU: 1.238s
     CGroup: /system.slice/kibana.service
             ??6464 /usr/share/kibana/bin/../node/bin/node /usr/share/kibana/bin/../src/cli/dist

Apr 14 04:25:54 elastic systemd[1]: Started Kibana.
.....
Step 10 – Accessing Kibana Dashboard
Since KIbana is configured to only access Elasticsearch via its private IP address, you have two options to access it. The first method is to use an SSH Tunnel from to the Elastic search server from your PC. This will forward port 5601 from your PC to the server’s private IP address, and you will be able to access Kibana from your PC at http://localhost:5601. But this method means you won’t be able to access it from anywhere else.
The option is to install Nginx on your Suricata server and use it as a reverse proxy to access Elasticsearch’s server via its private IP address. We will discuss both ways. You can choose either way based on your requirements.
Using SSH Local Tunnel
If you are using Windows 10 or Windows 11, you can run the SSH LocalTunnel from your Windows Powershell. On Linux or macOS, you can use the terminal. You will probably need to configure SSH access if you haven’t already.
Run the following command in your computer’s terminal to create the SSH Tunnel.
$ ssh -L 5601:your_private_IP:5601 navjot@your_public_IP -N
- The
-Lflag refers to the local SSH Tunnel, which forwards traffic from your PC’s port to the server. - The
private_IP:5601is the IP address where your traffic is forwarded to on the server. In this case, replace it with the private IP address of your Elasticsearch server. - The
your_public_IPis the public IP address of the Elasticsearch server, which is used to open an SSH connection. - The
-Nflag tells OpenSSH not to execute any command but keeps the connection alive as long as the tunnel runs.
Now that the tunnel is open, you can access Kibana by opening the URL http://localhost:5601 on your PC’s browser. You will get the following screen.
You will need to keep the command running for as long as you need to access Kibana. Press Ctrl C in your terminal to close the tunnel.
Using Nginx Reverse-proxy
This method is best suited if you want to access the dashboard from anywhere in the world. All these commands are to be run on the Elasticsearch server.
Install Nginx
Rocky Linux 9 ships with an older version of Nginx. You need to use the official Nginx repository to install the latest version.
Create and open the file /etc/yum.repos.d/nginx.repo for editing.
$ sudo nano /etc/yum.repos.d/nginx.repo
Paste the following code in it.
[nginx-stable]
name=nginx stable repo
baseurl=http://nginx.org/packages/centos/$releasever/$basearch/
gpgcheck=1
enabled=0
gpgkey=https://nginx.org/keys/nginx_signing.key
module_hotfixes=true

[nginx-mainline]
name=nginx mainline repo
baseurl=http://nginx.org/packages/mainline/centos/$releasever/$basearch/
gpgcheck=1
enabled=1
gpgkey=https://nginx.org/keys/nginx_signing.key
module_hotfixes=true
Once you are finished, save the file by pressing Ctrl X and entering Y when prompted. We will use the mainline version of Nginx and therefore have enabled the mainline repo in the above file by using enabled=1 under the mainline section instead of the stable one. You can choose either one.
Install Nginx.
$ sudo dnf install -y nginx
Verify the installation.
$ nginx -v
nginx version: nginx/1.25.4
Enable and start the Nginx server service.
$ sudo systemctl enable nginx --now
Configure Firewall
Before proceeding further, you need to open HTTP and HTTPS ports in the firewall.
$ sudo firewall-cmd --permanent --add-service=http
$ sudo firewall-cmd --permanent --add-service=https
Reload the firewall to enable the changes.
$ sudo firewall-cmd --reload
Install and configure SSL
The first step is to install the Let’s Encrypt SSL Certificate. For this, we need to install the EPEL repository first.
$ sudo dnf install -y epel-release
Install Certbot and the corresponding Nginx plugin.
$ sudo dnf install -y certbot python3-certbot-nginx
Generate the SSL certificate for the domain kibana.example.com.
$ sudo certbot certonly --nginx --agree-tos --no-eff-email --staple-ocsp --preferred-challenges http -m [email protected] -d kibana.example.com
The above command will download a certificate to the /etc/letsencrypt/live/kibana.example.com directory on your server.
Generate a Diffie-Hellman group certificate.
$ sudo openssl dhparam -dsaparam -out /etc/ssl/certs/dhparam.pem 4096
Enable and start the Certbot auto-renewal timer.
$ sudo systemctl enable certbot-renew.timer
$ sudo systemctl start certbot-renew.timer
View the list of Timers.
$ sudo systemctl list-timers
NEXT                        LEFT         LAST                        PASSED    UNIT                         ACTIVATES
---------------------------------------------------------------------------------------------------------------------------------
Mon 2024-04-15 00:00:00 UTC 19min left   Sun 2024-04-14 08:20:34 UTC 15h ago   logrotate.timer              logrotate.service
Mon 2024-04-15 00:43:16 UTC 1h 2min left Sun 2024-04-14 09:01:33 UTC 14h ago   fstrim.timer                 fstrim.service
Mon 2024-04-15 00:44:47 UTC 1h 4min left Sun 2024-04-14 23:30:19 UTC 10min ago dnf-makecache.timer          dnf-makecache.service
Mon 2024-04-15 06:52:31 UTC 7h left      -                           -         certbot-renew.timer          certbot-renew.service
Do a dry run of the process to check whether the SSL renewal is working fine.
$ sudo certbot renew --dry-run
If you see no errors, you are all set. Your certificate will renew automatically.
Configure Nginx
Create and open the Nginx configuration file for Kibana.
$ sudo nano /etc/nginx/conf.d/kibana.conf
Paste the following code in it. Replace the IP address with the private IP address of your Elasticsearch server.
server {
  listen 80; listen [::]:80;
  server_name kibana.example.com;
  return 301 https://$host$request_uri;
}

server {
  server_name kibana.example.com;
  charset utf-8;

  listen 443 ssl;
  listen [::]:443 ssl;
  http2 on;
  http3 on;
  quic_retry on;


  access_log /var/log/nginx/kibana.access.log;
  error_log /var/log/nginx/kibana.error.log;

  ssl_certificate /etc/letsencrypt/live/kibana.example.com/fullchain.pem;
  ssl_certificate_key /etc/letsencrypt/live/kibana.example.com/privkey.pem;
  ssl_trusted_certificate /etc/letsencrypt/live/kibana.example.com/chain.pem;
  ssl_session_timeout 1d;
  ssl_session_cache shared:MozSSL:10m;
  ssl_session_tickets off;

  ssl_protocols TLSv1.2 TLSv1.3;
  ssl_ciphers ECDHE-ECDSA-AES128-GCM-SHA256:ECDHE-RSA-AES128-GCM-SHA256:ECDHE-ECDSA-AES256-GCM-SHA384:ECDHE-RSA-AES256-GCM-SHA384:ECDHE-ECDSA-CHACHA20-POLY1305:ECDHE-RSA-CHACHA20-POLY1305:DHE-RSA-AES128-GCM-SHA256:DHE-RSA-AES256-GCM-SHA384;
  ssl_ecdh_curve X25519:prime256v1:secp384r1:secp521r1;
  ssl_prefer_server_ciphers off;

  resolver 8.8.8.8;

  ssl_stapling on;
  ssl_stapling_verify on;
  ssl_dhparam /etc/ssl/certs/dhparam.pem;

  location / {
    proxy_pass http://your_private_IP:5601;
    proxy_set_header Host $host;
    proxy_set_header X-Real-IP $remote_addr;
    proxy_set_header X-Forwarded-For $proxy_add_x_forwarded_for;
    proxy_set_header X-Forwarded-Proto $scheme;
  }
}
Save the file by pressing Ctrl X and entering Y when prompted.
Open the file /etc/nginx/nginx.conf for editing.
$ sudo nano /etc/nginx/nginx.conf
Add the following line before the line include /etc/nginx/conf.d/*.conf;.
server_names_hash_bucket_size 64;
Save the file by pressing Ctrl X and entering Y when prompted.
Verify the configuration.
$ sudo nginx -t
nginx: the configuration file /etc/nginx/nginx.conf syntax is ok
nginx: configuration file /etc/nginx/nginx.conf test is successful
Start the Nginx service.
$ sudo systemctl start nginx
Next, you need to add the base URL field in Kibana’s configuration.
Open Kibana’s configuration file.
$ sudo nano /etc/kibana/kibana.yml
Find the commented line #server.publicBaseUrl: "" and change it as follows by removing the hash in front of it.
server.publicBaseUrl: "https://kibana.example.com"
Save the file by pressing Ctrl X and entering Y when prompted.
Restart the Kibana service.
$ sudo systemctl restart kibana
Configure SELinux to enable Nginx
Apply the policy to allow connections to be made to outside hosts.
$ sudo setsebool -P httpd_can_network_connect 1
Finish Configuring ElasticSearch with Kibana
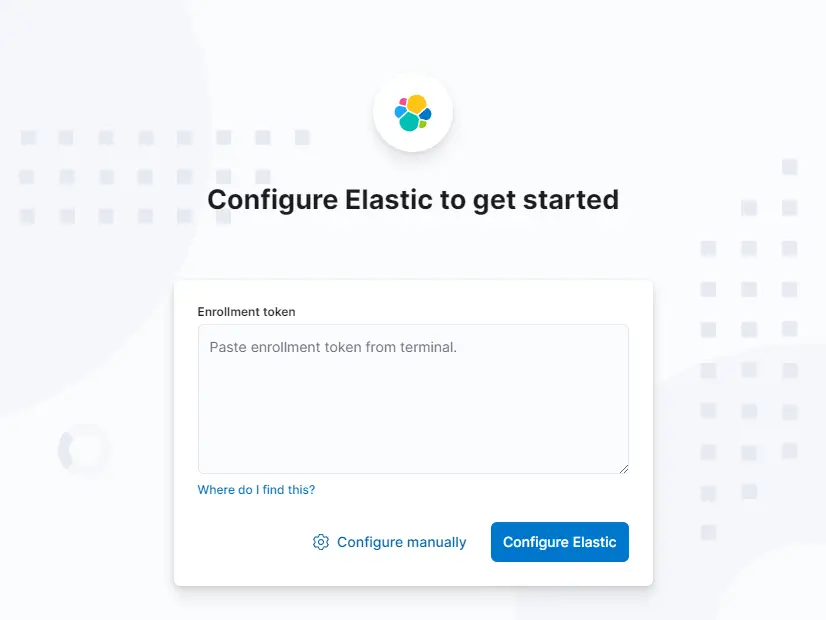
Wait for a few minutes and load the URL https://kibana.example.com in your browser.
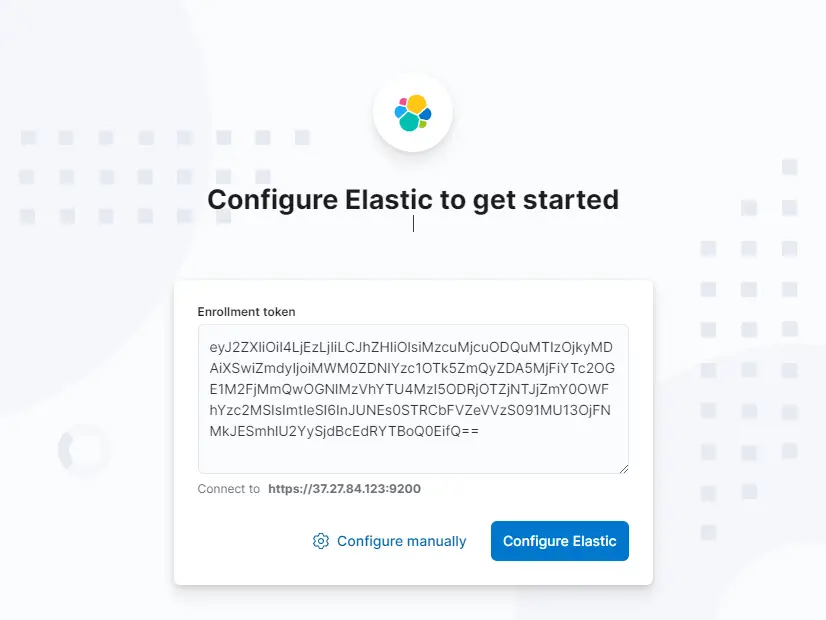
You will get the enrollment token field. Fill in the enrollment token you generated in step 9.
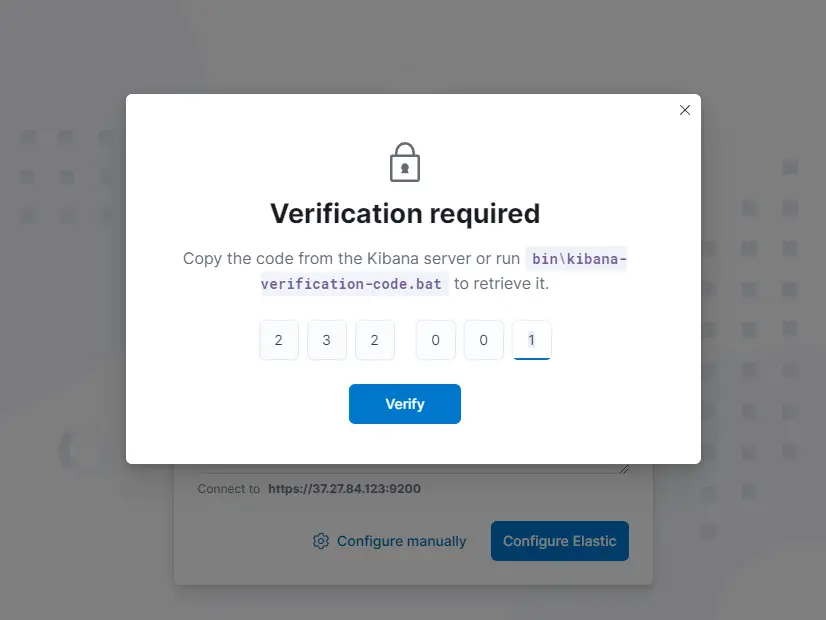
Click the Configure Elastic button to proceed. Next, you will be asked for the verification code.
Switch back to the Elasticsearch terminal and run the following command to generate the code. Enter this code on the page and click the Verify button to proceed.
$ sudo /usr/share/kibana/bin/kibana-verification-code
Your verification code is:  232 001
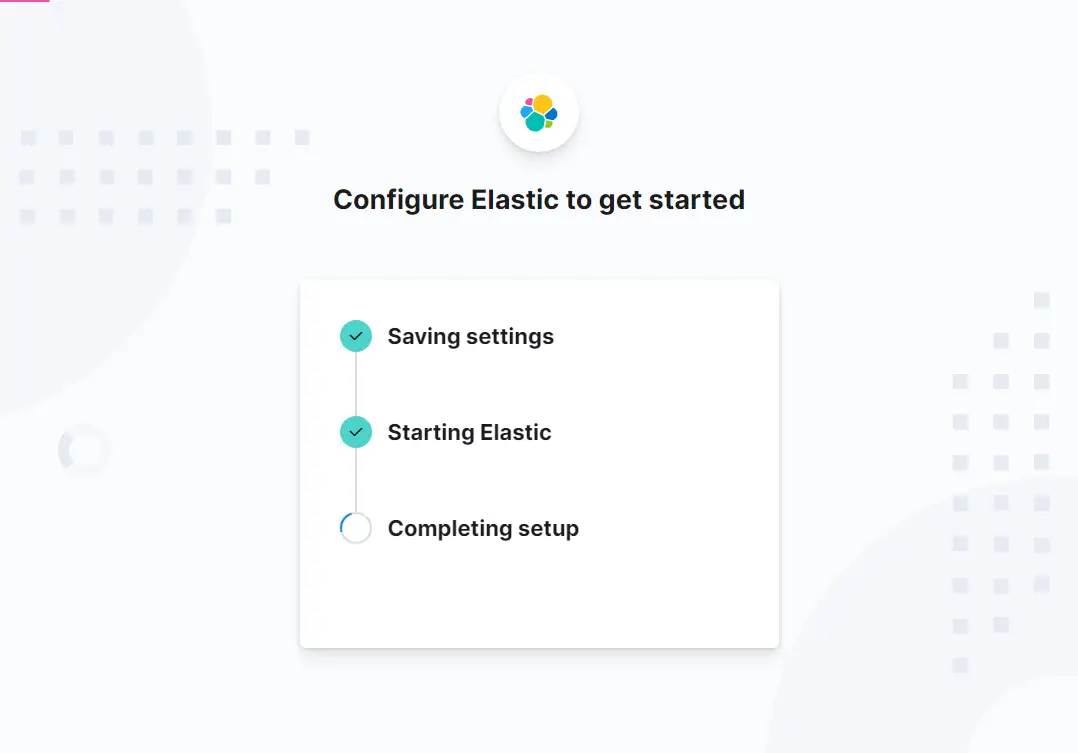
Next, wait for the Elastic setup to complete. It will take several minutes.
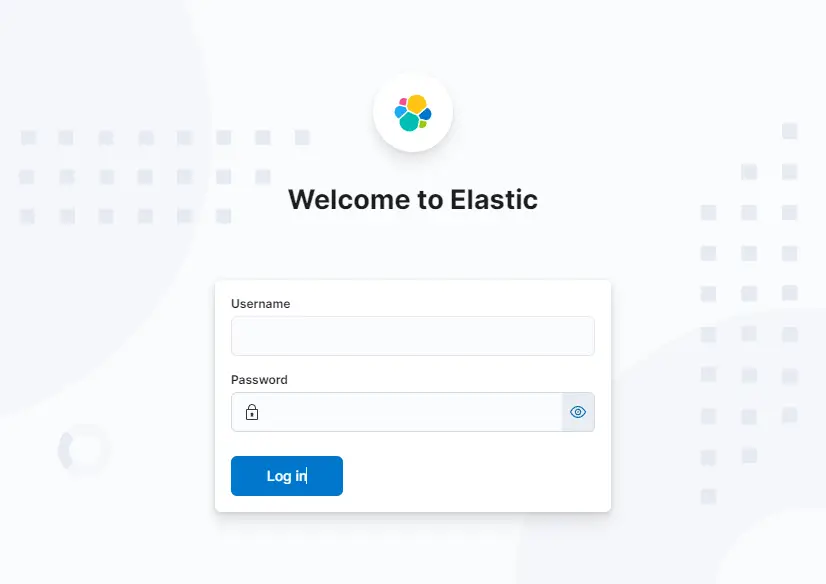
Next, you will be redirected to the login screen.
Step 11 – Install and Configure Filebeat
It is important to note that we will be installing Filebeat on the Suricata server. So switch back to it and add the Elastic GPG key to get started.
$ sudo rpm --import https://artifacts.elastic.co/GPG-KEY-elasticsearch
Create and open the elastic repository.
$ sudo nano /etc/yum.repos.d/elasticsearch.repo
Paste the following code.
[elasticsearch]
name=Elasticsearch repository for 8.x packages
baseurl=https://artifacts.elastic.co/packages/8.x/yum
gpgcheck=1
gpgkey=https://artifacts.elastic.co/GPG-KEY-elasticsearch
enabled=0
autorefresh=1
type=rpm-md
Save the file by pressing Ctrl X and entering Y when prompted.
Install Filebeat.
$ sudo dnf install --enablerepo=elasticsearch filebeat
Before we configure Filebeat, we need to copy the http_ca.crt file from the Elasticsearch server over to the Filebeat server. Run the following command on the Filebeat server.
$ scp username@your_public_ip:/etc/elasticsearch/certs/http_ca.crt /etc/filebeat
Filebeat stores its configuration in the /etc/filebeat/filebeat.yml file. Open it for editing.
$ sudo nano /etc/filebeat/filebeat.yml
The first thing you need to do is connect it to Kibana’s dashboard. Find the line #host: "localhost:5601" in the Kibana section and add the following line right below it as shown.
. . .
# Starting with Beats version 6.0.0, the dashboards are loaded via the Kibana API.
# This requires a Kibana endpoint configuration.
setup.kibana:

  # Kibana Host
  # Scheme and port can be left out and will be set to the default (http and 5601)
  # In case you specify and additional path, the scheme is required: http://localhost:5601/path
  # IPv6 addresses should always be defined as: https://[2001:db8::1]:5601
  #host: "localhost:5601"
  host: "your_private_IP:5601"
  protocol: "http"
  ssl.enabled: true
  ssl.certificate_authorities: ["https://www.howtoforge.com/etc/filebeat/http_ca.crt"]

. . .
Next, find the Elasticsearch Output section of the file and edit the values of hosts, username, and password as shown below. For the username, choose elastic as the value, and for the password, use the value generated in step 8 of this tutorial. Also, set the protocol to HTTPS.
output.elasticsearch:
  # Array of hosts to connect to.
  hosts: ["your_private_IP:9200"]

  # Performance preset - one of "balanced", "throughput", "scale",
  # "latency", or "custom".
  preset: balanced

  # Protocol - either `http` (default) or `https`.
  protocol: "https"

  # Authentication credentials - either API key or username/password.
  #api_key: "id:api_key"
  username: "elastic"
  password: ""
  ssl.certificate_authorities: ["https://www.howtoforge.com/etc/filebeat/http_ca.crt"]
  ssl.verification_mode: full

. . .
Add the following line at the bottom of the file.
setup.ilm.overwrite: true
Once you are finished, save the file by pressing Ctrl X and entering Y when prompted. There is one more step involved in making sure Filebeat connects to Elasticsearch. We need to pass Elasticsearch’s SSL information to Filebeat for it to be able to connect.
Test the connection from the Filebeat to the Elasticsearch server. You will be asked for your Elasticsearch password.
$ sudo curl -v --cacert /etc/filebeat/http_ca.crt https://your_private_ip:9200 -u elastic
You will get the following output.
Enter host password for user 'elastic':
*   Trying 10.0.0.2:9200...
* Connected to 10.0.0.2 (10.0.0.2) port 9200 (#0)
* ALPN, offering h2
* ALPN, offering http/1.1
*  CAfile: /etc/filebeat/http_ca.crt
* TLSv1.0 (OUT), TLS header, Certificate Status (22):
* TLSv1.3 (OUT), TLS handshake, Client hello (1):
* TLSv1.2 (IN), TLS header, Certificate Status (22):
* TLSv1.3 (IN), TLS handshake, Server hello (2):
* TLSv1.2 (IN), TLS header, Finished (20):
* TLSv1.2 (IN), TLS header, Unknown (23):
* TLSv1.3 (IN), TLS handshake, Encrypted Extensions (8):
* TLSv1.3 (IN), TLS handshake, Certificate (11):
* TLSv1.3 (IN), TLS handshake, CERT verify (15):
* TLSv1.3 (IN), TLS handshake, Finished (20):
* TLSv1.2 (OUT), TLS header, Finished (20):
* TLSv1.3 (OUT), TLS change cipher, Change cipher spec (1):
* TLSv1.2 (OUT), TLS header, Unknown (23):
* TLSv1.3 (OUT), TLS handshake, Finished (20):
* SSL connection using TLSv1.3 / TLS_AES_256_GCM_SHA384
* ALPN, server did not agree to a protocol
* Server certificate:
*  subject: CN=elastic
*  start date: Apr 14 08:37:21 2024 GMT
*  expire date: Apr 14 08:37:21 2026 GMT
*  subjectAltName: host "10.0.0.2" matched cert's IP address!
*  issuer: CN=Elasticsearch security auto-configuration HTTP CA
*  SSL certificate verify ok.
* Server auth using Basic with user 'elastic'
* TLSv1.2 (OUT), TLS header, Unknown (23):
> GET / HTTP/1.1
> Host: 10.0.0.2:9200
> Authorization: Basic ZWxhc3RpYzpsaWZlc3Vja3M2NjIwMDI=
> User-Agent: curl/7.76.1
> Accept: */*
>
* TLSv1.2 (IN), TLS header, Unknown (23):
* TLSv1.3 (IN), TLS handshake, Newsession Ticket (4):
* TLSv1.2 (IN), TLS header, Unknown (23):
* Mark bundle as not supporting multiuse
< HTTP/1.1 200 OK
< X-elastic-product: Elasticsearch
< content-type: application/json
< content-length: 532
<
{
  "name" : "elastic",
  "cluster_name" : "elasticsearch",
  "cluster_uuid" : "vnUn8l1bQ1qkF-VjCoiWmQ",
  "version" : {
    "number" : "8.13.2",
    "build_flavor" : "default",
    "build_type" : "rpm",
    "build_hash" : "16cc90cd2d08a3147ce02b07e50894bc060a4cbf",
    "build_date" : "2024-04-05T14:45:26.420424304Z",
    "build_snapshot" : false,
    "lucene_version" : "9.10.0",
    "minimum_wire_compatibility_version" : "7.17.0",
    "minimum_index_compatibility_version" : "7.0.0"
  },
  "tagline" : "You Know, for Search"
}
* Connection #0 to host 10.0.0.2 left intact
Next, enable Filebeat’s built-in Suricata module.
$ sudo filebeat modules enable suricata
Enabled suricata
Open the /etc/filebeat/modules.d/suricata.yml file for editing.
$ sudo nano /etc/filebeat/modules.d/suricata.yml
Edit the file as shown below. You need to change the value of enabled variable to true. Also, uncomment the variable var.paths and set its value as shown.
# Module: suricata
# Docs: https://www.elastic.co/guide/en/beats/filebeat/8.10/filebeat-module-suricata.html

- module: suricata
  # All logs
  eve:
    enabled: true

    # Set custom paths for the log files. If left empty,
    # Filebeat will choose the paths depending on your OS.
    var.paths: ["https://www.howtoforge.com/var/log/suricata/eve.json"]
Once you are finished, save the file by pressing Ctrl X and entering Y when prompted.
The final step in configuring Filebeat is to load the SIEM dashboards and pipelines into Elasticsearch using the filebeat setup command.
$ sudo filebeat setup
It may take a few minutes for the command to finish. Once finished, you should receive the following output.
Index setup finished.
Loading dashboards (Kibana must be running and reachable)
Loaded dashboards
Loaded Ingest pipelines
Start and enable the Filebeat service.
$ sudo systemctl enable filebeat --now
Check the status of the service.
$ sudo systemctl status filebeat
? filebeat.service - Filebeat sends log files to Logstash or directly to Elasticsearch.
     Loaded: loaded (/usr/lib/systemd/system/filebeat.service; enabled; preset: disabled)
     Active: active (running) since Sun 2024-04-14 10:12:51 UTC; 31s ago
       Docs: https://www.elastic.co/beats/filebeat
   Main PID: 7299 (filebeat)
      Tasks: 8 (limit: 22569)
     Memory: 407.2M
        CPU: 7.640s
     CGroup: /system.slice/filebeat.service
             ??7299 /usr/share/filebeat/bin/filebeat --environment systemd -c /etc/filebeat/filebeat.yml --path.home /usr/share/filebeat --path.config /etc/filebeat..........
Step 12 – Managing Kibana Dashboards
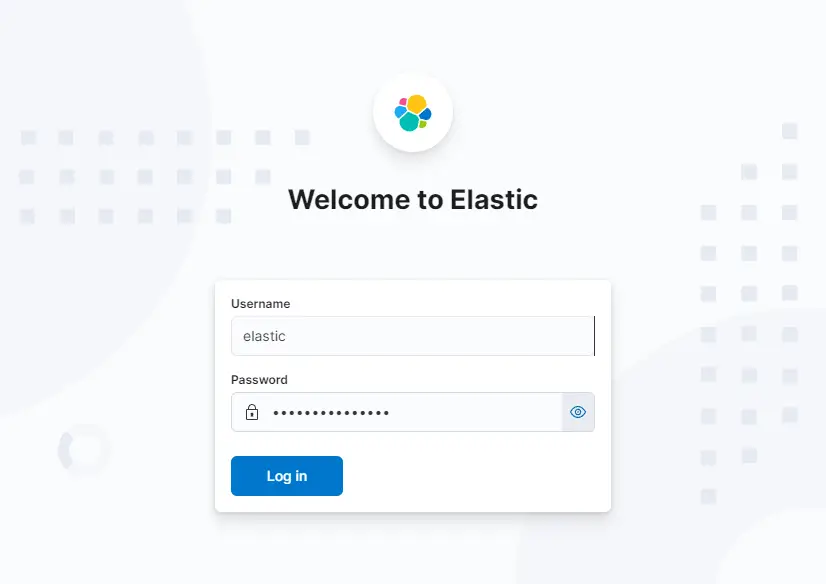
Open https://kibana.example.com and you will be taken to the login screen once again.
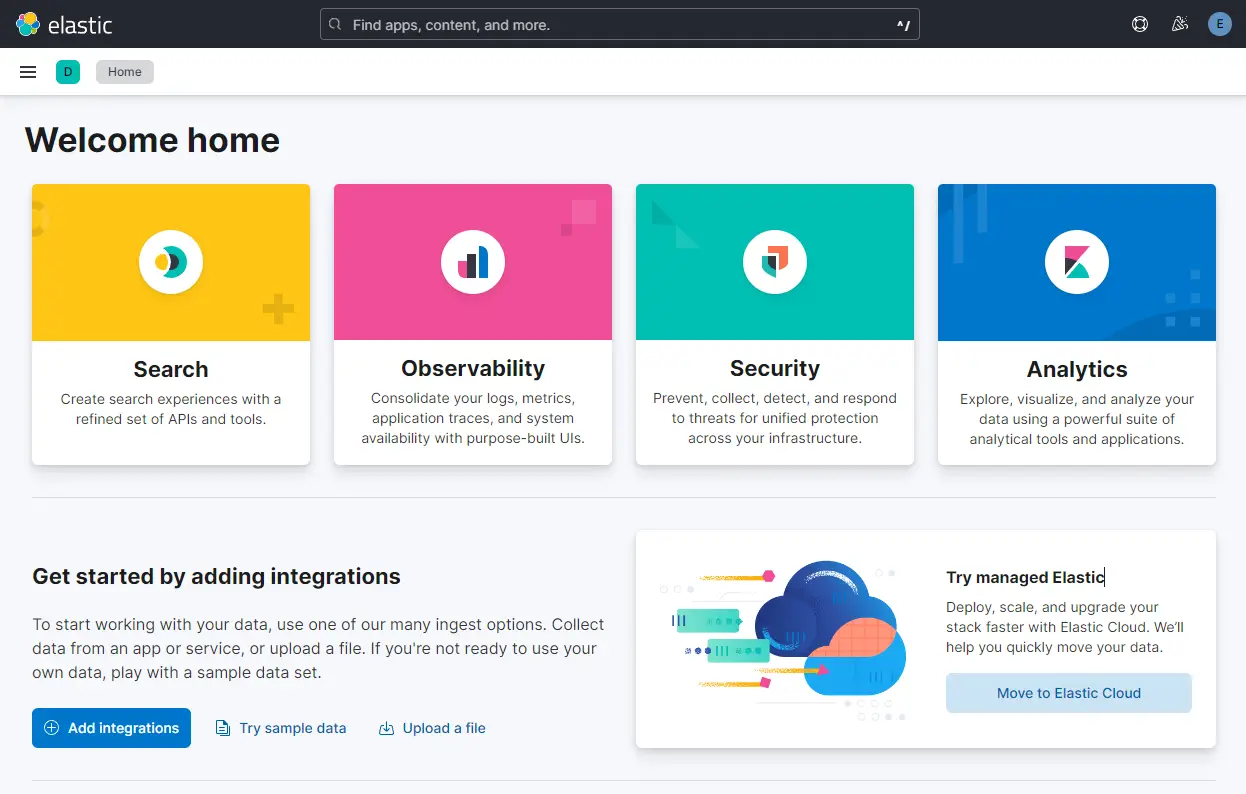
Log in with the username elastic, and password you generated before and you will get the following screen.
Click the Explore on my own link to proceed towards the dashboard.
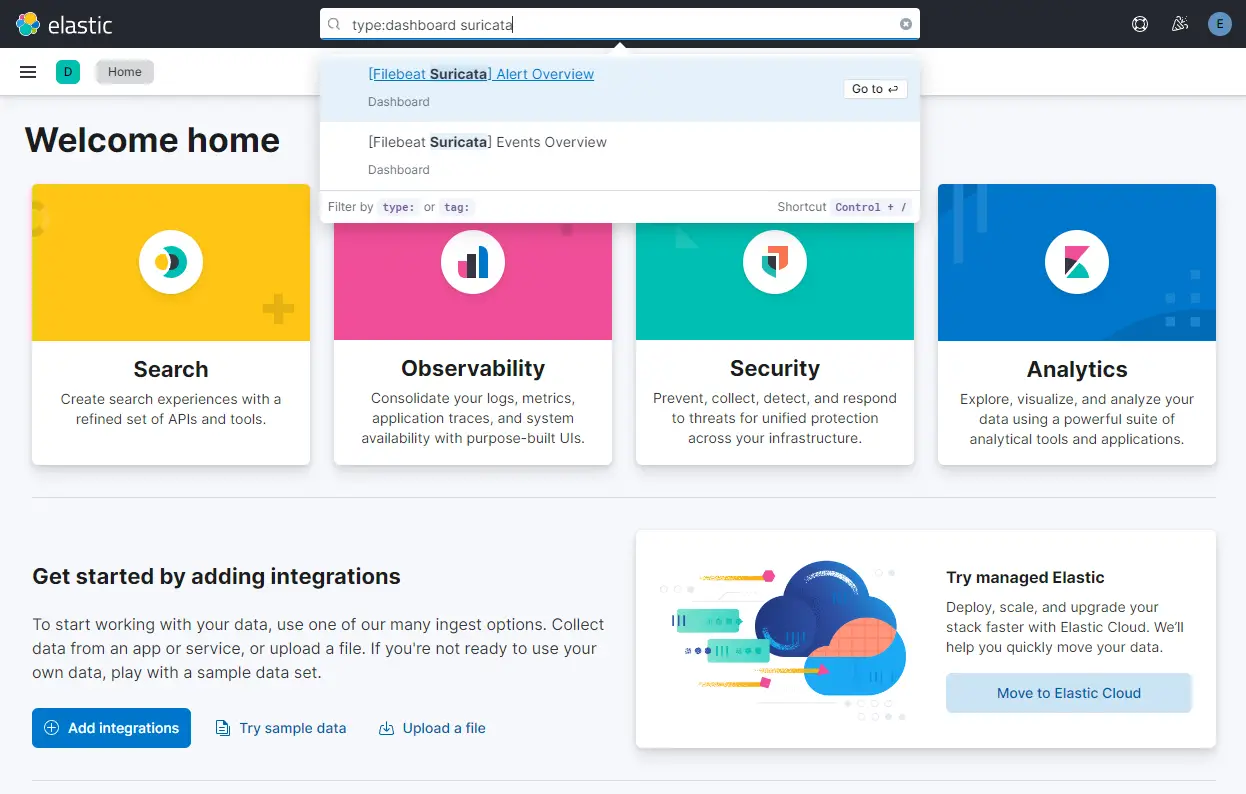
Type type:data suricata in the search box at the top to locate Suricata’s information.
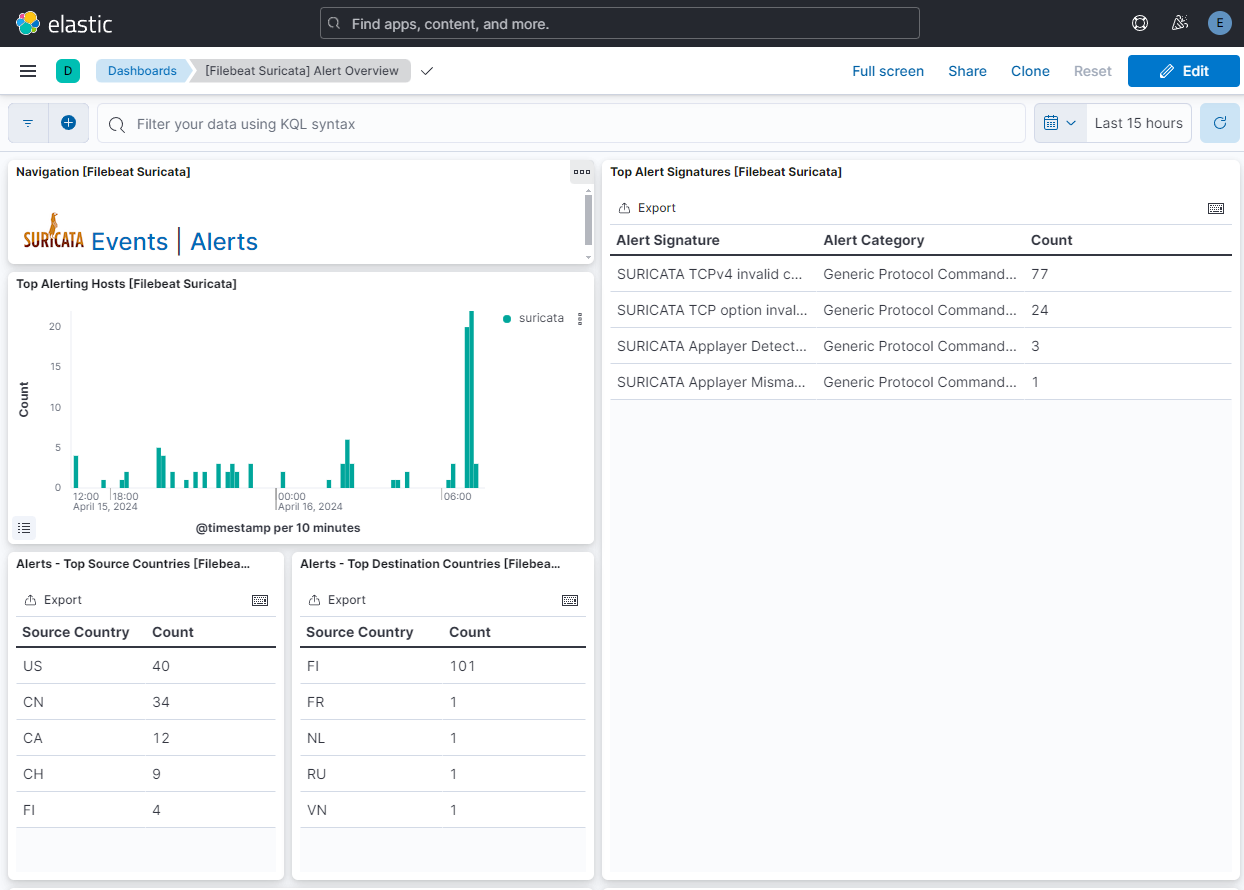
Click the first result ([Filebeat Suricata] Alert Overview), and you will get a similar screen. By default, it shows the entries for only the last 15 minutes, but we display them over a larger time to show more data for the tutorial.
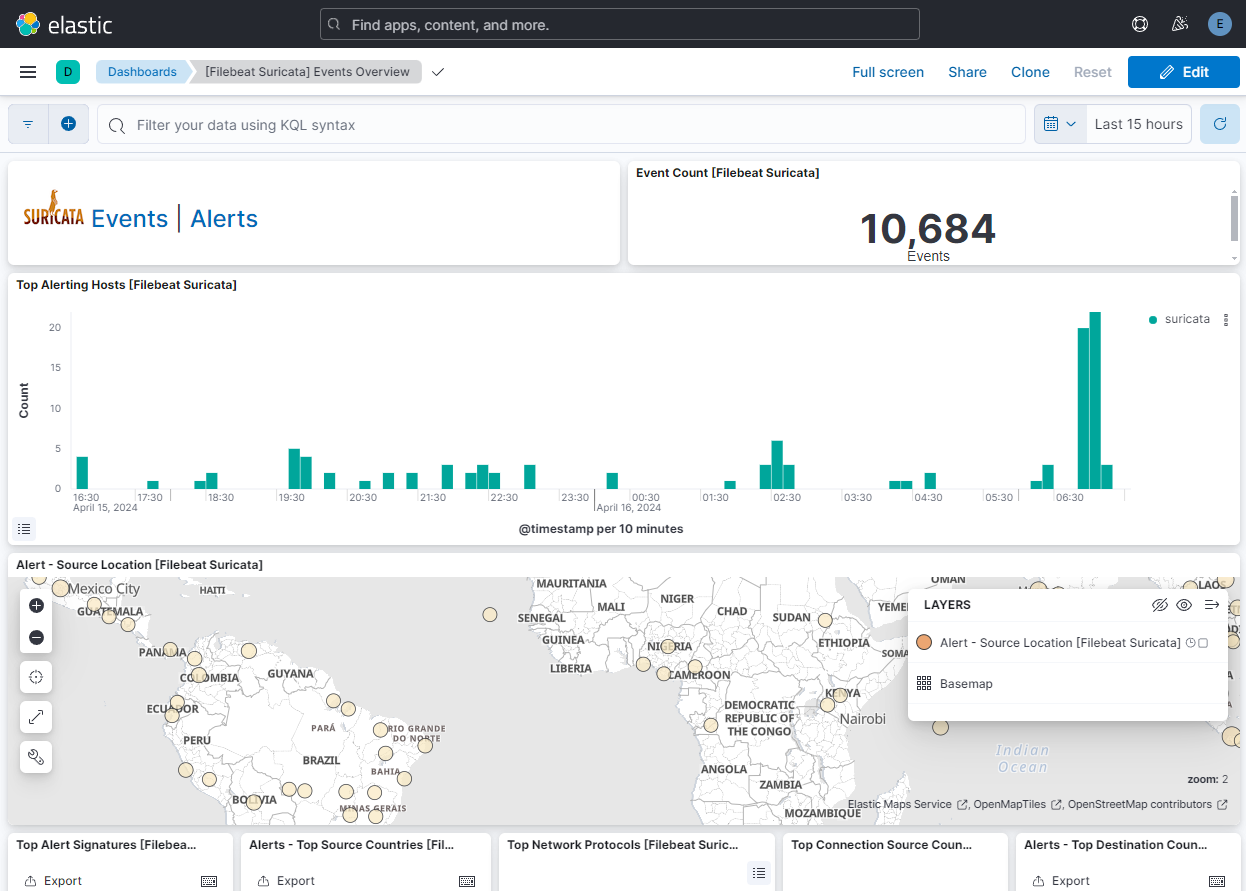
Click on the Events button to view all the logged events.
On scrolling down on events and alert pages, you can identify each event and alert by the type of protocol, the source and destination ports, and the IP address of the source. You can also view the countries from where the traffic originated.
You can use Kibana and Filebeat to access and generate other types of dashboards. One of the useful in-built dashboards that you can right away is the Security dashboard. Click on the Security dashboard from the left hamburger menu, select Explore, and then choose Network dashboard from the right hand side.
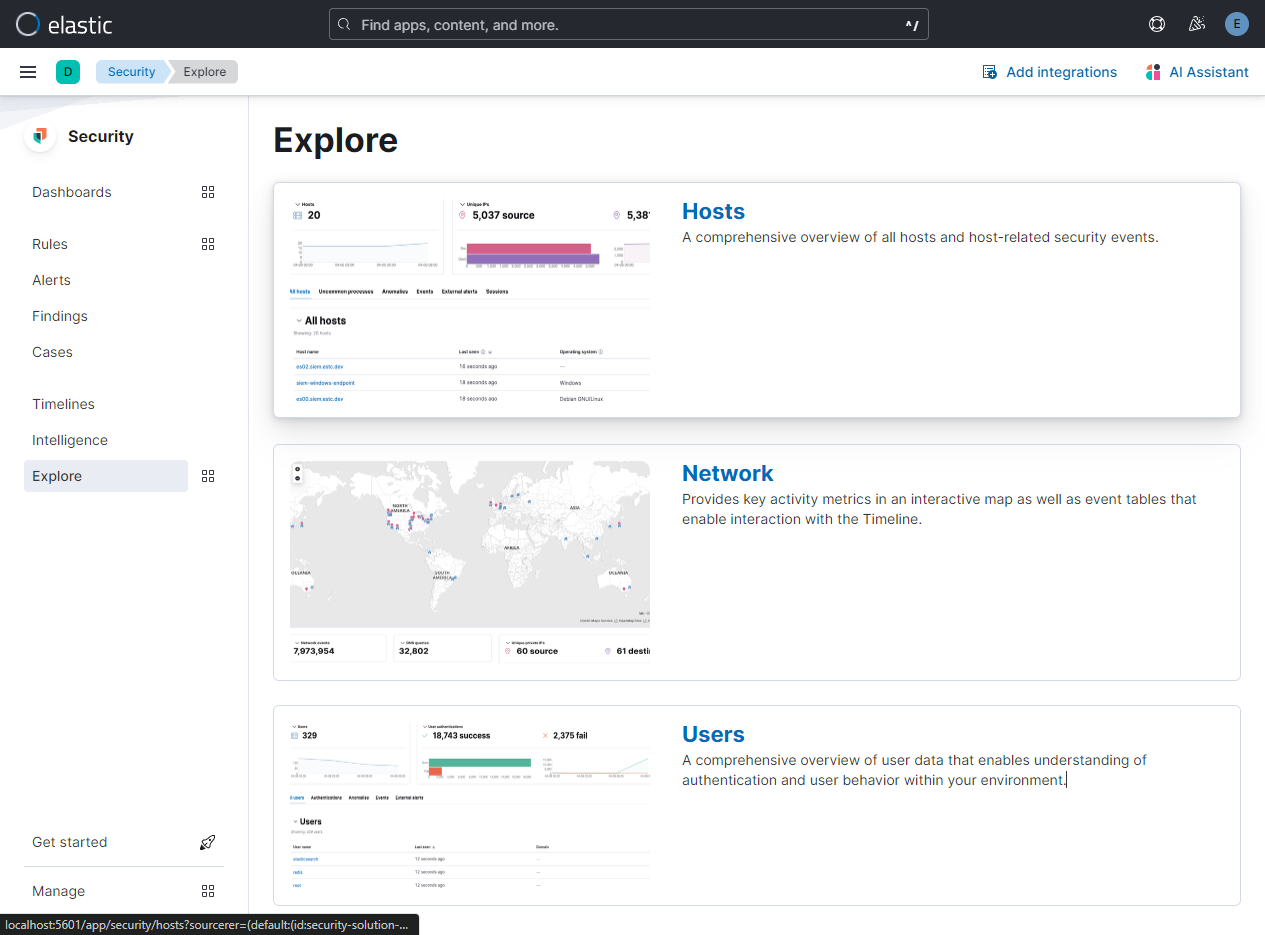 > Explore Dashboard” data-ezsrc=”https://kirelos.com/wp-content/uploads/2024/05/echo/kibana-security-explore-dashboard.png664ddc4a9e221.jpg” ezimgfmt=”rs rscb10 src ng ngcb9″ height=”554″ loading=”lazy” referrerpolicy=”no-referrer” src=”data:image/svg xml,” width=”750″>
You will see the following page.
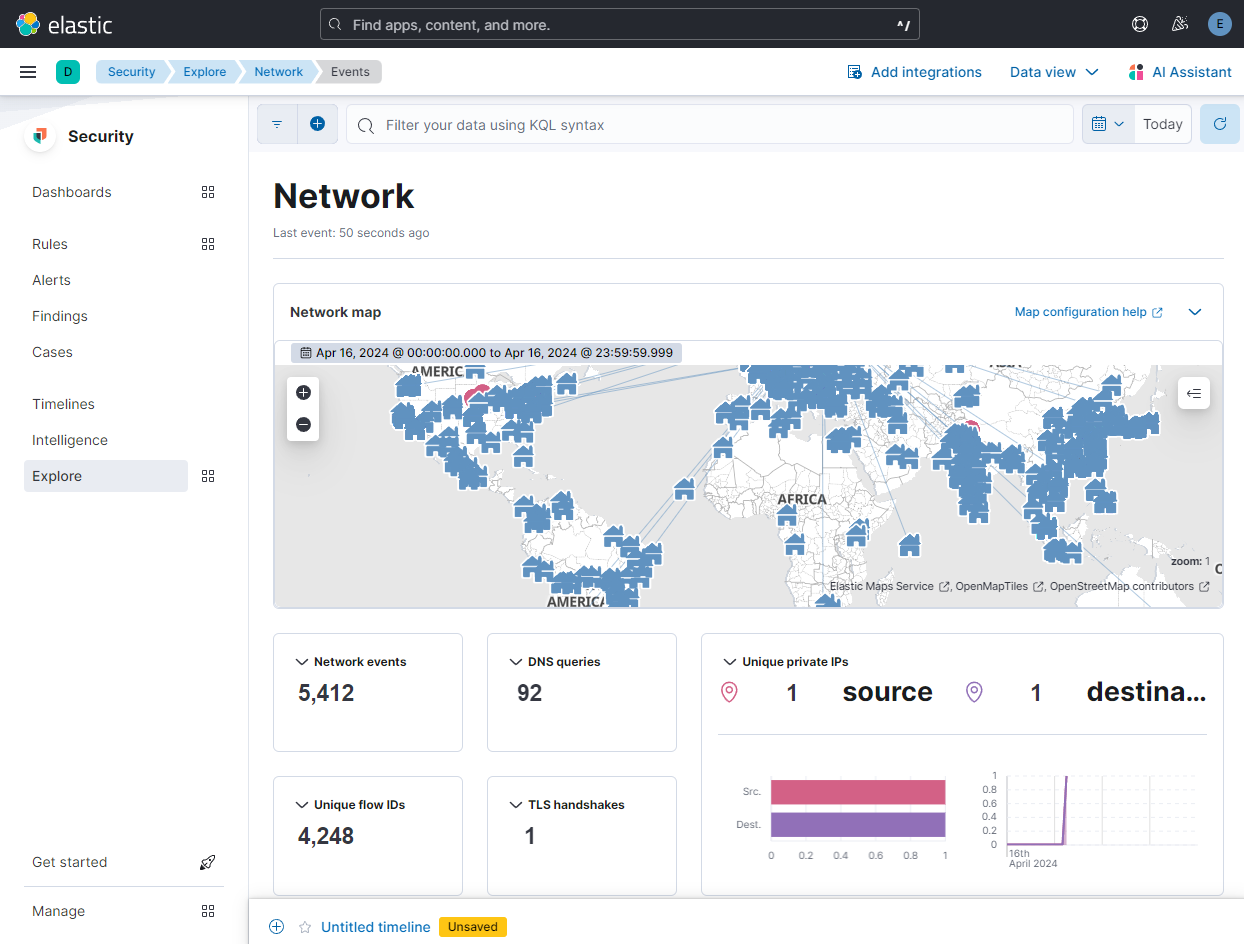 > Security Dashboard” data-ezsrc=”https://kirelos.com/wp-content/uploads/2024/05/echo/kibana-network-security-dashboard.png664ddc4ac032c.jpg” ezimgfmt=”rs rscb10 src ng ngcb9″ height=”569″ loading=”lazy” referrerpolicy=”no-referrer” src=”data:image/svg xml,” width=”750″>
You can add more dashboards like Nginx by enabling and configuring in-built Filebeat modules.
Conclusion
This concludes the tutorial for installing and configuring Suricata IDS with Elastic Stack on a Rocky Linux 9 server. You also configured Nginx as a reverse proxy to access Kibana dashboards externally. If you have any questions, post them in the comments below.


