
iostat is a command-line tool used in Linux to monitor system input/output (I/O) device loading by observing the time devices are active with their average transfer rates. Primarily part of the sysstat package, iostat is invaluable for diagnosing performance issues related to disk usage, identifying bottlenecks, and monitoring the overall health of storage subsystems. On Debian Linux, iostat can provide detailed statistics about CPU utilization, device utilization, and throughput, making it an essential tool for system administrators who need to manage and optimize disk I/O performance.
This guide will show you how to install and use iostat on Debian Linux.
How to Install iostat on Debian 12
The iostat command is part of the sysstat package, which is readily available in the official Debian repositories. To install iostat on Debian 12, follow these steps:
Step 1: Update the System Package List
Before installing any software, it’s good practice to update your package list to ensure you’re getting the latest available versions from the repositories. Open a terminal and run:
sudo apt updateThis command refreshes the local package database, ensuring that your system is aware of the latest versions and security patches.
Step 2: Install the sysstat Package
The iostat command is included in the sysstat package, which also contains other system performance monitoring tools like mpstat and sar. To install sysstat, run the following command:
sudo apt install sysstatThis will download and install the necessary binaries and dependencies.
Step 3: Enable and Configure the sysstat Service
After installation, the sysstat service needs to be enabled to collect performance statistics at regular intervals. By default, the sysstat package is installed, but its data collection feature is not enabled. To enable it:
-
Open the
/etc/default/sysstatfile in a text editor:sudo nano /etc/default/sysstat -
Find the line
ENABLED="false"and change it toENABLED="true". -
Save and exit the editor (
Ctrl O, thenCtrl Xin Nano). -
Restart the
sysstatservice to apply the changes:sudo systemctl restart sysstat
Now, the sysstat service will start collecting system statistics, including disk I/O information, which can be later viewed using iostat.
How to Use iostat on Debian 12
Once installed, you can begin using the iostat command to monitor your system’s I/O performance. Below are some common usage examples.
Basic Usage
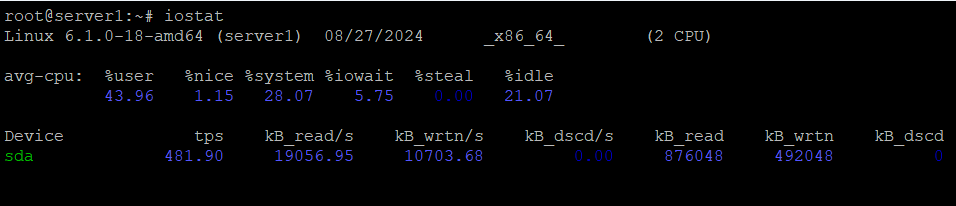
To display a summary of CPU and device I/O statistics, simply run:
iostatThis command will produce output that shows the average CPU load and disk I/O statistics since the last system boot. The first section gives CPU usage percentages (user, system, idle, etc.), and the subsequent sections list I/O data for each device, including metrics such as tps (transactions per second), kB_read/s, and kB_wrtn/s.
Real-Time Monitoring
To monitor disk I/O in real-time, you can use the -x flag for extended statistics and specify an interval. For example, to display updated statistics every 2 seconds:
iostat -x 2This command will continuously refresh the output every 2 seconds, giving you a live view of CPU and I/O activity.
Monitoring Specific Devices
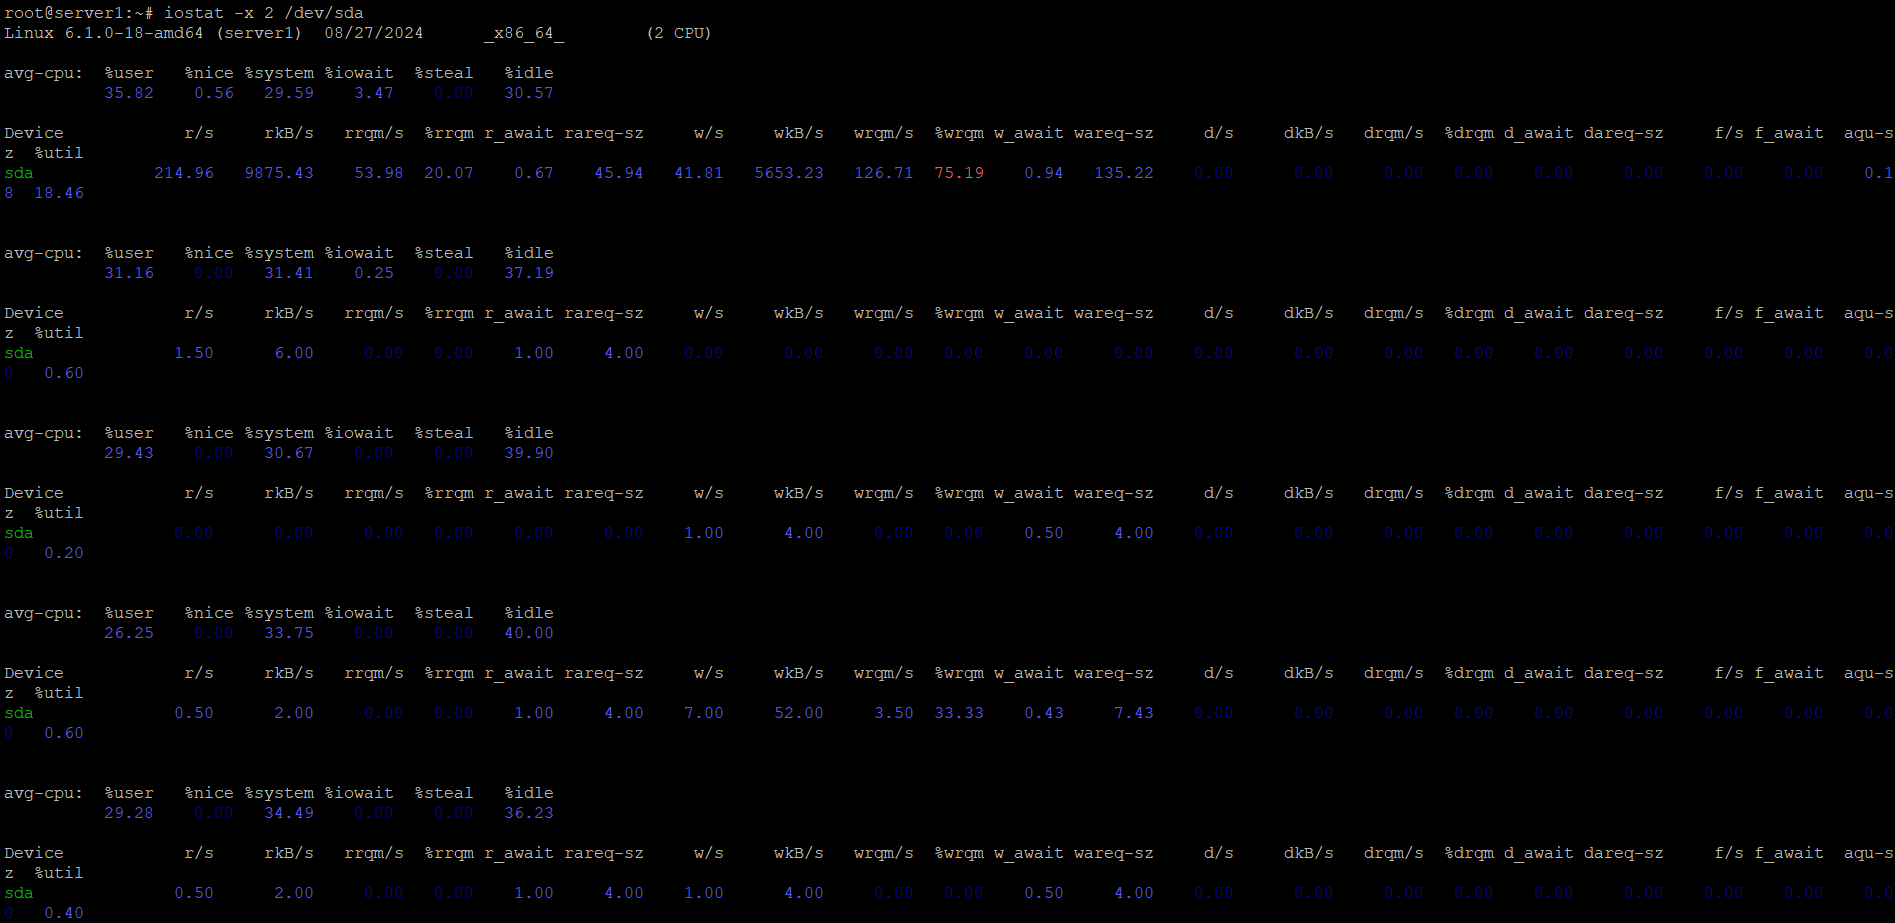
If you want to monitor a specific device, you can specify it by name. For example, to monitor only /dev/sda, run:
iostat -x 2 /dev/sdaThis will show statistics for the specified device only, which is useful if you are troubleshooting or monitoring a particular disk.
Display Historical Data
The iostat tool can also display historical data collected by the sysstat service. To view I/O activity from a previous day, use the -h flag along with the -p flag for partitions. For example:
iostat -h -p ALLThis will give you a detailed historical view of all devices and partitions.
Helpful Tips
-
Understanding Key Metrics:
- %util: This is the percentage of time the device was busy. If it’s consistently close to 100%, the device may be a bottleneck.
- await: This indicates the average time (in milliseconds) for I/O requests to complete. High values here might indicate an I/O bottleneck.
- tps: Transactions per second, a measure of the number of I/O operations per second. A high number of transactions might be normal for a busy disk, but if combined with high
awaitand%util, it can indicate problems.
-
Regular Monitoring: Set up cron jobs to run
iostatat regular intervals and log the output to a file for later analysis. For example, adding this line to your crontab will log disk I/O every 10 minutes:*/10 * * * * /usr/bin/iostat -x >> /var/log/iostat.log -
Combine with Other Tools:
iostatis great for I/O-specific monitoring, but combining it with other tools liketoporhtopfor CPU and memory monitoring, andiotopfor per-process I/O, can give you a more holistic view of system performance.
By following these steps and tips, you can use iostat to monitor and troubleshoot disk I/O performance on your Debian 12 system.


