
Netdata is a free and open-source performance and health monitoring solution for Linux, macOS, and FreeBSD. It provides real-time statistics and allows you to monitor cloud-based servers, containers, and your entire IT infrastructure. With Netdata, you can monitor real-time system metrics, including Memory usage, CPU, Bandwidth, Disk utilization, and more. You can also integrate it with other monitoring tools like Prometheus, Graphite, OpenTSDB, Kafka, Grafana, and more.
This tutorial will show you how to install the Netdata monitoring tool on Ubuntu 22.04 server.
Prerequisites
- A server running Ubuntu 22.04.
- A root password is configured on the server.
Install Netdata with Automated Script
The simplest and easiest way to install Netdata is from the automatic installation script.
First, install the curl utility with the following command:
apt-get install curl -y
Once installed, you can download and run the Netdata auto-installation script with the following command:
bash <(curl -Ss https://my-netdata.io/kickstart.sh)
Once the Netdata is installed, you should see the following output:
Sun Sep 11 01:56:23 PM UTC 2022 : INFO: netdata-updater.sh:  Auto-updating has been ENABLED through cron, updater script linked to /etc/cron.daily/netdata-updater

Sun Sep 11 01:56:23 PM UTC 2022 : INFO: netdata-updater.sh:  If the update process fails and you have email notifications set up correctly for cron on this system, you should receive an email notification of the failure.
Sun Sep 11 01:56:23 PM UTC 2022 : INFO: netdata-updater.sh:  Successful updates will not send an email.
Successfully installed the Netdata Agent.

Official documentation can be found online at https://learn.netdata.cloud/docs/.

Looking to monitor all of your infrastructure with Netdata? Check out Netdata Cloud at https://app.netdata.cloud.

Join our community and connect with us on:
  - GitHub: https://github.com/netdata/netdata/discussions
  - Discord: https://discord.gg/5ygS846fR6
  - Our community forums: https://community.netdata.cloud/
Install Netdata From Ubuntu Repository
By default, Netdata is available in the Ubuntu 22.04 standard repository. You can install it by just running the following command:
apt-get install netdata -y
Once the Netdata is installed, start the Netdata service with the following command:
systemctl start netdata
You can verify the status of the Netdata with the following command:
systemctl status netdata
You should get the following output:
? netdata.service - Real time performance monitoring
     Loaded: loaded (/lib/systemd/system/netdata.service; enabled; vendor preset: enabled)
     Active: active (running) since Sun 2022-09-11 13:58:11 UTC; 4s ago
   Main PID: 85446 (netdata)
      Tasks: 64 (limit: 4579)
     Memory: 162.4M
        CPU: 2.653s
     CGroup: /system.slice/netdata.service
             ??85446 /usr/sbin/netdata -D -P /var/run/netdata/netdata.pid
             ??85448 /usr/sbin/netdata --special-spawn-server
             ??85610 bash /usr/libexec/netdata/plugins.d/tc-qos-helper.sh 1
             ??85632 /usr/bin/python3 /usr/libexec/netdata/plugins.d/python.d.plugin 1
             ??85635 /usr/libexec/netdata/plugins.d/apps.plugin 1
             ??85637 /usr/libexec/netdata/plugins.d/nfacct.plugin 1
             ??85638 /usr/libexec/netdata/plugins.d/go.d.plugin 1
             ??85640 /usr/libexec/netdata/plugins.d/ebpf.plugin 1

Sep 11 13:58:11 ubuntu2204 systemd[1]: Started Real time performance monitoring.
Sep 11 13:58:11 ubuntu2204 netdata[85446]: CONFIG: cannot load cloud config '/var/lib/netdata/cloud.d/cloud.conf'. Running with internal defa>
Sep 11 13:58:11 ubuntu2204 netdata[85446]: 2022-09-11 13:58:11: netdata INFO  : MAIN : CONFIG: cannot load cloud config '/var/lib/netdata/clo>
Sep 11 13:58:13 ubuntu2204 ebpf.plugin[85640]: Does not have a configuration file inside `/etc/netdata/ebpf.d.conf. It will try to load stock>
Sep 11 13:58:13 ubuntu2204 ebpf.plugin[85640]: Name resolution is disabled, collector will not parser "hostnames" list.
Sep 11 13:58:13 ubuntu2204 ebpf.plugin[85640]: The network value of CIDR 127.0.0.1/8 was updated for 127.0.0.0 .
Sep 11 13:58:13 ubuntu2204 ebpf.plugin[85640]: Cannot read process groups configuration file '/etc/netdata/apps_groups.conf'. Will try '/usr/>
At this point, Netdata is installed and listening on port 19999. You can check it with the following command:
ss -antpl | grep 19999
You should get the following output:
LISTEN 0      4096         0.0.0.0:19999      0.0.0.0:*    users:(("netdata",pid=85446,fd=5))
LISTEN 0      4096            [::]:19999         [::]:*    users:(("netdata",pid=85446,fd=6))
Once you are finished, you can proceed to the next step.
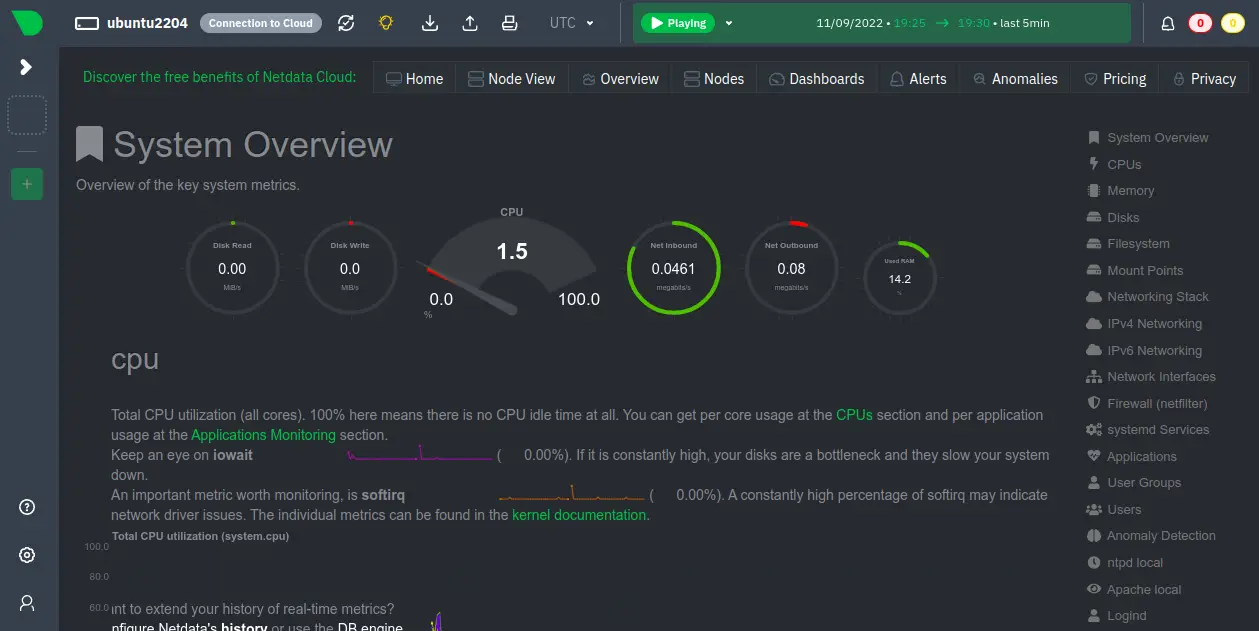
Access Netdata Web Interface
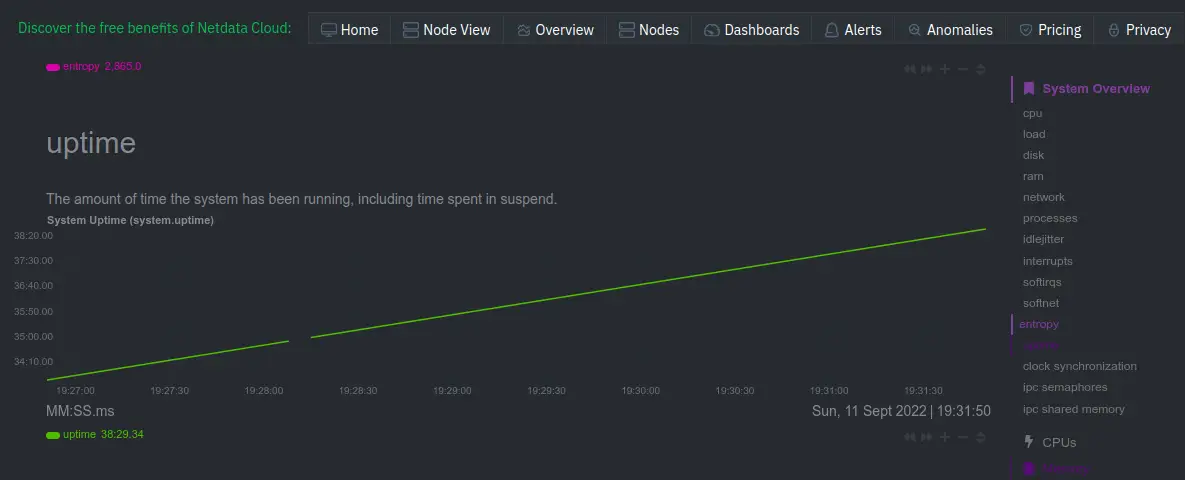
Now, open your web browser and access the Netdata web interface using the URL http://your-server-ip:19999. You should see the Netdata web interface on the following screen:
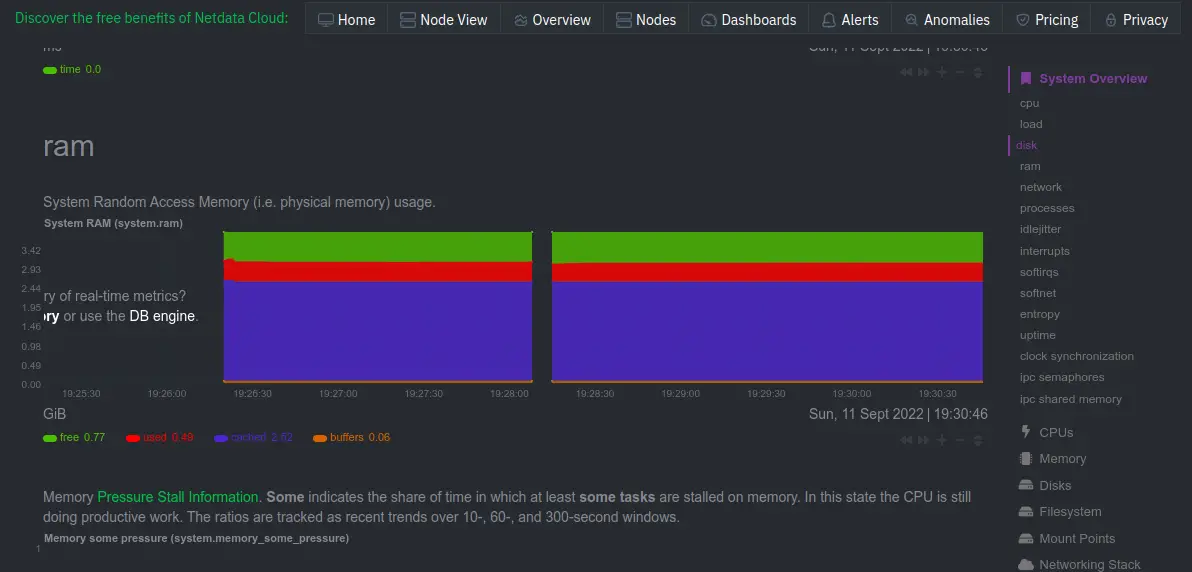
RAM
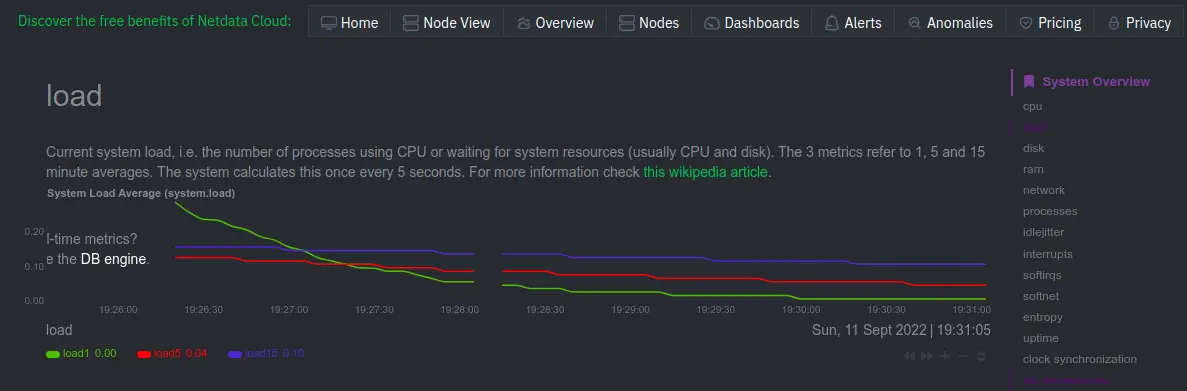
Load
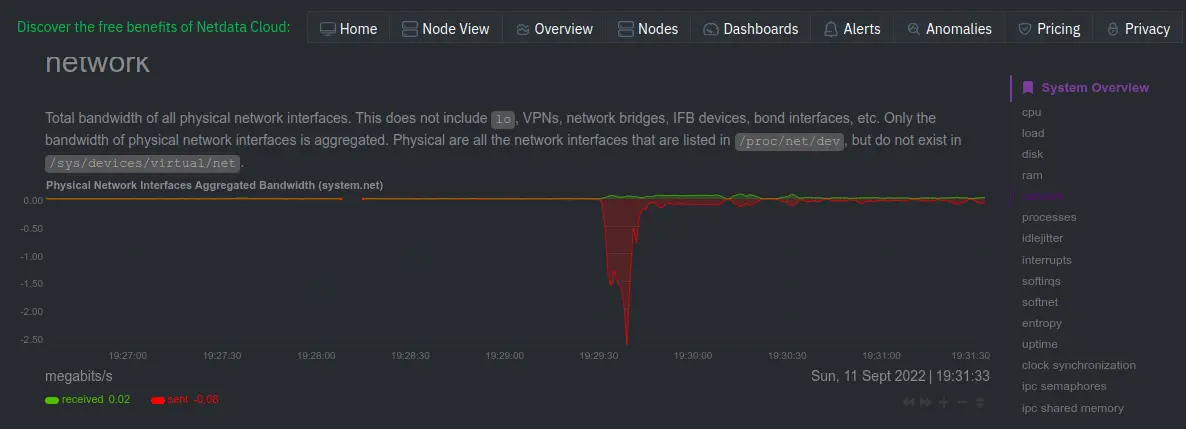
Network
Uptime
Conclusion
Congratulations! you have successfully installed Netdata on Ubuntu 22.04 server. You can now install the Netdata agent on the client machine and start monitoring system resources from the Netdata web dashboard. Feel free to ask me if you have any questions.
About Hitesh Jethva
Over 8 years of experience as a Linux system administrator. My skills include a depth knowledge of Redhat/Centos, Ubuntu Nginx and Apache, Mysql, Subversion, Linux, Ubuntu, web hosting, web server, Squid proxy, NFS, FTP, DNS, Samba, LDAP, OpenVPN, Haproxy, Amazon web services, WHMCS, OpenStack Cloud, Postfix Mail Server, Security etc.


