
Netdata is an open-source web-based real-time Linux system performance and health monitoring system. It supports the monitoring of many different types of information. Some example information is general system statistics, Linux Containers (as of Docker containers), PostgreSQL, MySQL, MongoDB, and Redis, which can be monitored in real-time per individual container. But it also provides high-level metrics like the number of active users on your website or their surfing behavior in general.
Netdata is fast and efficient and requires only a small amount of configuration and installation. Netdata is well suited to monitor network traffic, servers, clusters, and microservices that you might have running on your servers. Having microsecond response times it is capable of providing near real-time performance monitoring.
Netdata is 100% open-source. It is released under the GPL license v3. You can see exactly what it does and how it works in real-time by checking its code on Github. Netdata runs smoothly on all major Linux distributions, even when running under minimal resources – like Raspberry Pis or ARM-based VPS hosting servers.
Is Netdata safe?
Netdata is safe to run on production servers. It is built entirely with safe programming practices in mind, which means it uses no external libraries. Netdata continuously performs extensive testing against its own codebase for memory leaks, threading issues, and everything else that could go wrong. These tests regularly find bugs which are immediately reported upstream to the open-source projects used by Netdata.
Netdata has been running safely on web hosting companies’ production servers ever since 2012 without requiring any restarts nor causing any issue whatsoever to multiple thousands of websites hosted together with it.
Prerequisites
In order to install and run Netdata on your Debian 11 server, you need to have:
- A server running Debian 11.
- A non-root user with sudo privileges.
The Netdata Agent is incredibly lightweight and is suitable for any machine which you want to monitor. The Netdata Agent will ever use more than 1% of a single CPU, so overall system usage is minimal. 1 CPU core and 1GB of RAM are more than enough for every server to use Netdata.
Updating the System
It’s a good idea for all servers to be kept up to date with the latest patches, bug fixes, and security updates.
Run the following command in your terminal to update your system.
sudo apt-get update && sudo apt-get upgrade -y
Installing Netdata on Debian 11
The Netdata package is available on Debian’s base repository and can be installed using the APT package manager.
Run the following command to install Netdata on Debian 11.
sudo apt-get install netdata -y
Once the installation is complete, run the following command to start Netdata.
sudo systemctl start netdata
To enable Netdata to start automatically at reboot, run the following command.
sudo systemctl enable netdata
To check if its status, run the following command.
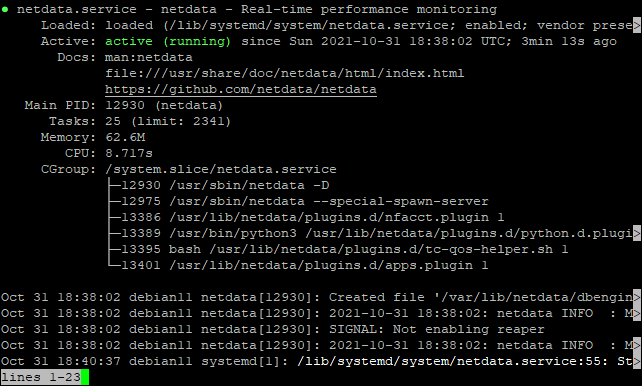
sudo systemctl status netdata
You will get an output similar to the following. You can see in the screenshot that Netdata is running and has started successfully.
Configuring Netdata
Now, all the prerequisites have been fulfilled and we are ready to configure Netdata.
Netdata is configured through a YAML configuration file /etc/netdata/netdata.conf.
Run the following command to edit this file using the nano editor.
nano /etc/netdata/netdata.conf
Find the bind socket to IP = 127.0.0.1 line.
Change this line to bind socket to your own server’s IP address. We change it to your own server’s IP address so that we can access the Netdata dashboard from the IP address. For example: if your server’s IP address is 192.168.1.1, then the line should look like bind socket to IP = 192.168.1.1
bind socket to IP = YOUR_SERVER_IP_ADDRESS
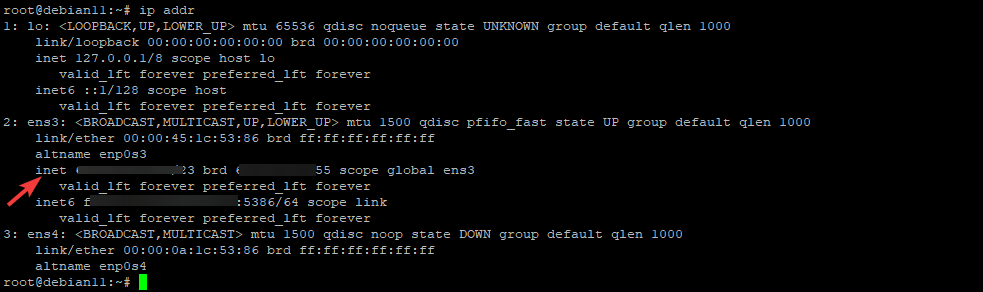
Run the command below to find the IP address of your server if you don’t know it.
ip addr
The output will look something like the screenshot below. We use the line in the screenshot which says inet addr – this is our server’s IP address.
Now save and close the file by pressing the Ctrl X key on your keyboard, then press Y, and finally press Enter key. Restart the Netdata service for the new settings to take effect.
sudo systemctl restart netdata
Configuring Firewall
The web UI and the read API for Netdata are both available on port 19999. If you are running your server behind a firewall, you will need to unblock this port. It needs to be open through the firewall in order for you to access the dashboard or use read API with third-party tools. Run the following command to open this port.
sudo ufw allow 19999
Run the command below to update the firewall rules.
sudo ufw reload
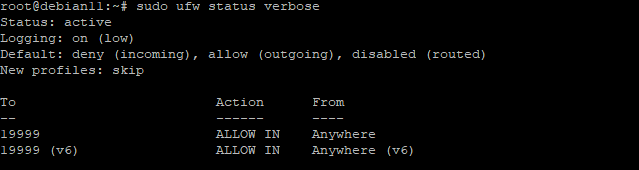
Run the command below to make sure the port 19999 is open.
sudo ufw status verbose
You will see an output similar to the one below. You can see the Status: active line. This means that the firewall is active. On the Action column, you can see that all incoming traffic on port 19999 is being allowed from any source (anywhere).
Accessing Netdata Web UI
So far everything has been done on the server itself. It’s now time to log in to your web browser and access the Netdata dashboard using your IP address followed by the 19999 port number.
Open the browser and type the following. Replace your-server-IP-address with your actual server’s IP address. For example, if your server’s IP address is 1.2.3.4, you will type http://1.2.3.4:19999 in your browser.
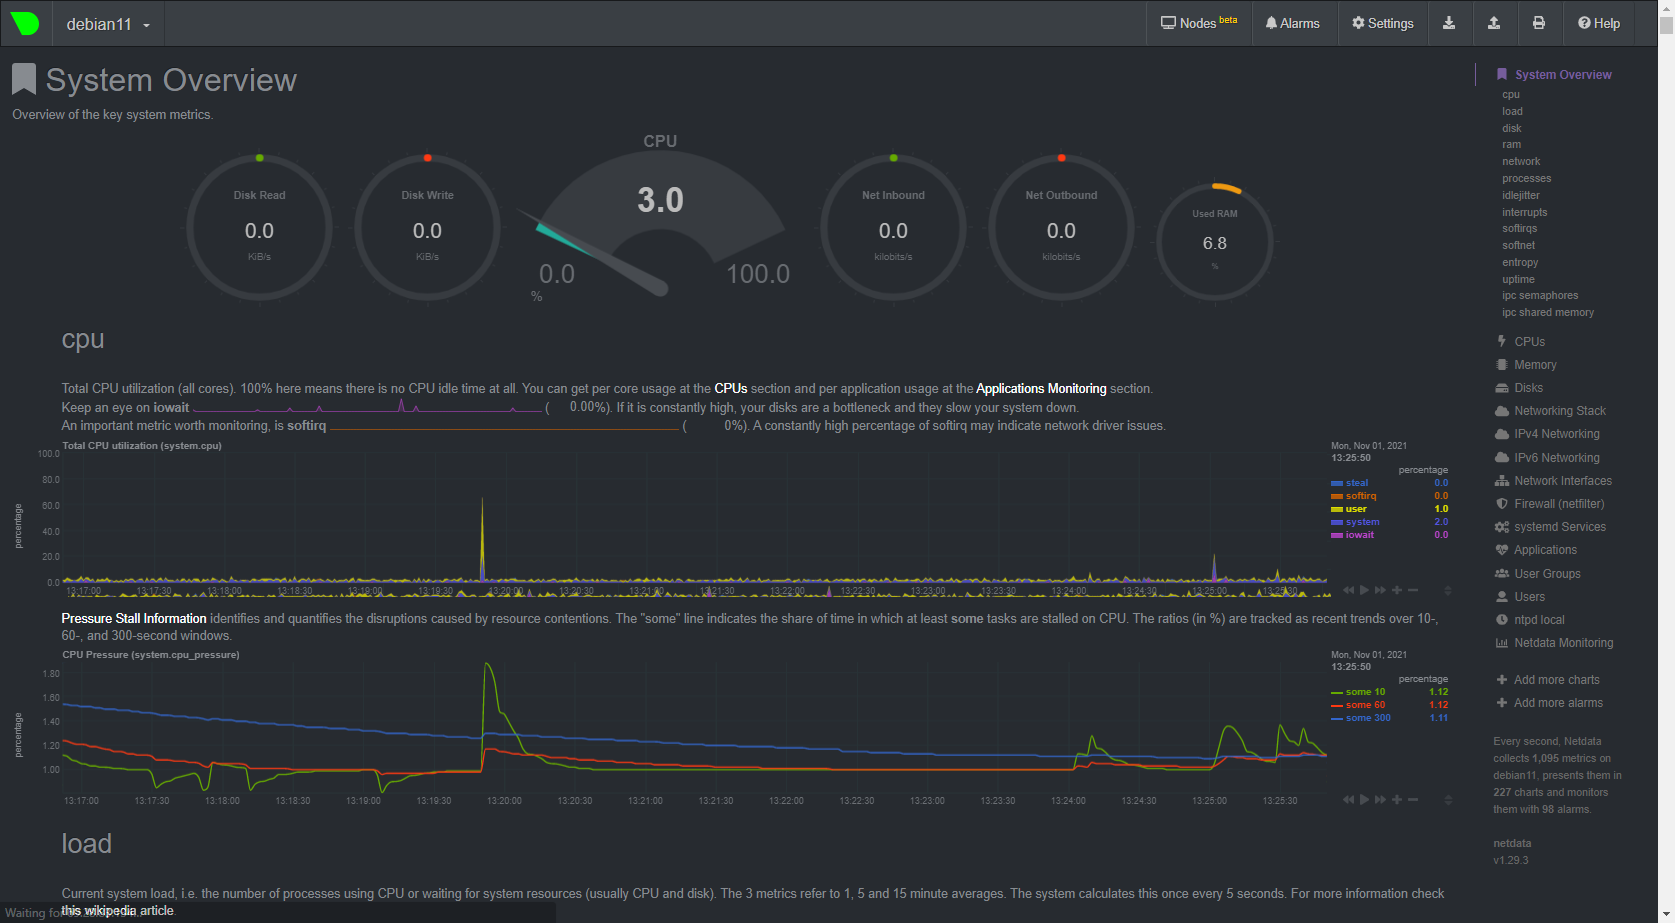
http://your-server-IP-address:19999
The Netdata dashboard will be displayed, and you can start using Netdata.
Conclusion
In this tutorial, you have learned how to install and configure Netdata. You have also learned how to open a firewall for Netdata. You can now continue to install and configure any other database or web server that you would like to use along with it.
If you have any questions, let us know in the comments section below.


