 on Ubuntu 22.04")
The TIG (Telegraf, InfluxDB, and Grafana) Stack is an acronym for a platform of open-source tools to make the collection, storage, graphing, and alerting of system metrics easier. You can monitor and visualize metrics such as memory, disk space, logged-in users, system load, swap usage, uptime, running processes, etc. from one place. The tools used in the stack are as follows:
- Telegraf – is an open-source metrics collection agent for collecting and sending data and events from databases, systems, and IoT sensors. It supports various output plugins such as InfluxDB, Graphite, Kafka, etc to which it can send the collected data.
- InfluxDB – is an open-source time-series database written in the Go language. It is optimized for fast, high-availability storage and is suitable for anything involving large amounts of time-stamped data, including metrics, events, and real-time analytics.
- Grafana – is an open-source data visualization and monitoring suite. It supports various input plugins such as Graphite, ElasticSearch, InfluxDB, etc. It provides a beautiful dashboard and metric analytics allowing you to visualize and monitor any kind of system metrics and performance data.
In this tutorial, you will learn how to install and configure the TIG Stack on a single Ubuntu 22.04 server.
Prerequisites
-
A server running Ubuntu 22.04.
-
A non-sudo user with root privileges.
-
The uncomplicated Firewall(UFW) is enabled and running.
-
Ensure that everything is updated.
$ sudo apt update && sudo apt upgrade
Step 1 – Configure Firewall
Before installing any packages, the first step is configuring the firewall to open ports for InfluxDB and Grafana.
Check the status of the firewall.
$ sudo ufw status
You should see something like the following.
Status: active

To                         Action      From
--                         ------      ----
OpenSSH                    ALLOW       Anywhere
OpenSSH (v6)               ALLOW       Anywhere (v6)
Open port 8086 for InfluxDB and 3000 for the Grafana server.
$ sudo ufw allow 8086
$ sudo ufw allow 3000
Check the status again to confirm.
$ sudo ufw status
Status: active

To                         Action      From
--                         ------      ----
OpenSSH                    ALLOW       Anywhere
8086                       ALLOW       Anywhere
3000                       ALLOW       Anywhere
OpenSSH (v6)               ALLOW       Anywhere (v6)
8086 (v6)                  ALLOW       Anywhere (v6)
3000 (v6)                  ALLOW       Anywhere (v6)
Step 2 – Install InfluxDB
We will use InfluxDB’s official repository to install it.
Download the InfluxDB GPG key.
$ wget -q https://repos.influxdata.com/influxdb.key
Import the GPG key into the server.
$ echo '23a1c8836f0afc5ed24e0486339d7cc8f6790b83886c4c96995b88a061c5bb5d influxdb.key' | sha256sum -c && cat influxdb.key | gpg --dearmor | sudo tee /etc/apt/trusted.gpg.d/influxdb.gpg > /dev/null
Import the InfluxDB repository.
$ echo 'deb [signed-by=/etc/apt/trusted.gpg.d/influxdb.gpg] https://repos.influxdata.com/debian stable main' | sudo tee /etc/apt/sources.list.d/influxdata.list
Update the system’s repository list.
$ sudo apt update
You have the option of installing InfluxDB 1.8.x or 2.0.x. However, it is better to use the latest version. Install InfluxDB.
$ sudo apt install influxdb2
Start the InfluxDB service.
$ sudo systemctl start influxdb
Check the status of the service.
$ sudo systemctl status influxdb
? influxdb.service - InfluxDB is an open-source, distributed, time series database
     Loaded: loaded (/lib/systemd/system/influxdb.service; enabled; vendor preset: enabled)
     Active: active (running) since Tue 2022-09-13 00:00:27 UTC; 42s ago
       Docs: https://docs.influxdata.com/influxdb/
    Process: 12514 ExecStart=/usr/lib/influxdb/scripts/influxd-systemd-start.sh (code=exited, status=0/SUCCESS)
   Main PID: 12515 (influxd)
      Tasks: 7 (limit: 1030)
     Memory: 48.5M
        CPU: 547ms
     CGroup: /system.slice/influxdb.service
             ??12515 /usr/bin/influxd
........
Step 3 – Create InfluxDB Database and User Credentials
To store the data from Telegraf, you need to set up the Influx database and user.
InfluxDB comes with a command-line tool named influx for interacting with the InfluxDB server. Think of influx as the mysql command-line tool.
Run the following command to perform the initial configuration for Influx.
$ influx setup
> Welcome to InfluxDB 2.0!
? Please type your primary username navjot
? Please type your password ***************
? Please type your password again ***************
? Please type your primary organization name howtoforge
? Please type your primary bucket name tigstack
? Please type your retention period in hours, or 0 for infinite 360
? Setup with these parameters?
  Username:          navjot
  Organization:      howtoforge
  Bucket:            tigstack
  Retention Period:  360h0m0s
 Yes
User    Organization    Bucket
navjot  howtoforge      tigstack
You need to set up your initial username, password, organization name, the primary bucket name to store data, and retention period in hours for that data. Your details are stored in the /home/username/.influxdbv2/configs file.
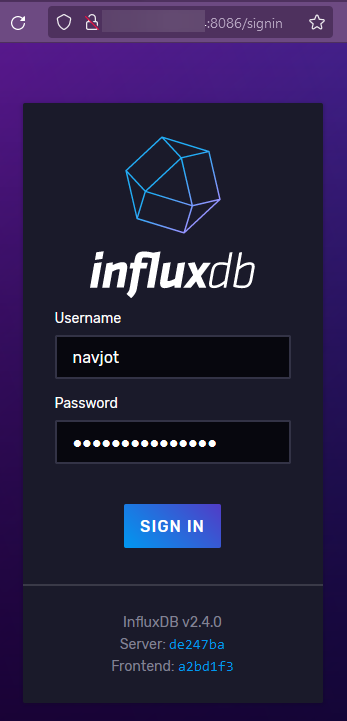
You can also perform this setup by launching the URL http://:8086/ in your browser. Once you have performed the initial setup, you can log in to the URL with the credentials created above.
You should be greeted with the following dashboard.
The initial setup process creates a default token that has full read and write access to all the organizations in the database. You need a new token for security purposes which will only connect to the organization and bucket we want to connect to.
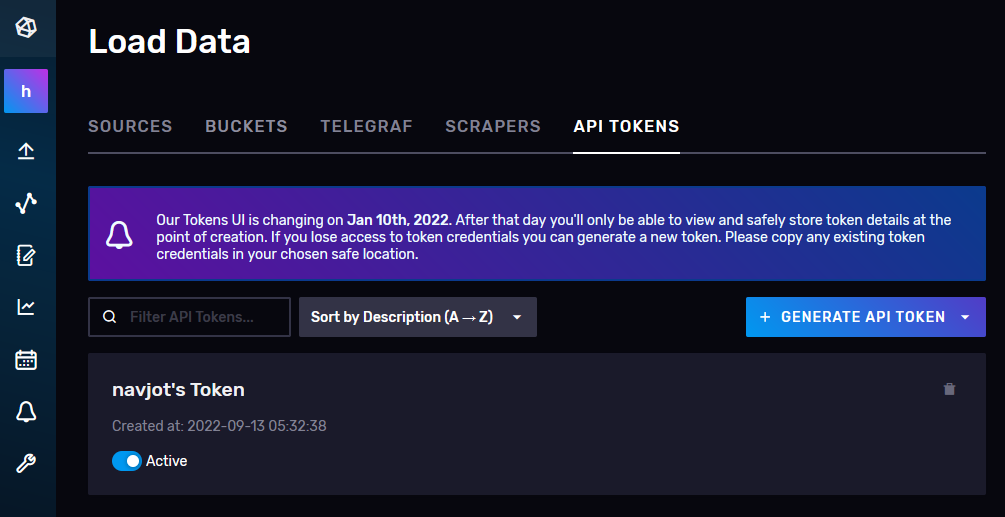
To create a new token, click on the following icon from the left sidebar and click the API Tokens link to proceed.
You will be taken to the API Tokens page. Here, you will see the default token that we created at the time of the initial configuration.
Click on the Generate Token button and select the Read/Write Token option to launch a new overlay popup. Give a name to the Token (telegraf) and select the default bucket we created under both Read and Write sections.
Click Save to finish creating the token. Click on the name of the newly created token to reveal a popup with the token value.
Save it for now since we will need it later on.
This completes the installation and configuration of InfluxDB. Next, we need to install Telegraf.
Step 4 – Install Telegraf
Telegraf and InfluxDB share the same repository. It means you can install Telegraf directly.
$ sudo apt install telegraf
Telegraf’s service is enabled and started automatically during installation.
Telegraf is a plugin-driven agent and has 4 types of plugins:
- Input plugins collect metrics.
- Processor plugins transform, decorate, and filter metrics.
- Aggregator plugins create and aggregate metrics.
- Output plugins define the destinations where metrics are sent including InfluxDB.
Telegraf stores its configuration for all these plugins in the file /etc/telegraf/telegraf.conf. The first step is to connect Telegraf to InfluxDB by enabling the influxdb_v2 output plugin. Open the file /etc/telegraf/telegraf.conf for editing.
$ sudo nano /etc/telegraf/telegraf.conf
Find the line [[outputs.influxdb_v2]] and uncomment out by removing the # in front of it. Edit out the code below it in the following way.
# # Configuration for sending metrics to InfluxDB 2.0
 [[outputs.influxdb_v2]]
#   ## The URLs of the InfluxDB cluster nodes.
#   ##
#   ## Multiple URLs can be specified for a single cluster, only ONE of the
#   ## urls will be written to each interval.
#   ##   ex: urls = ["https://us-west-2-1.aws.cloud2.influxdata.com"]
   urls = ["http://127.0.0.1:8086"]
#
#   ## Token for authentication.
   token = "$INFLUX_TOKEN"
#
#   ## Organization is the name of the organization you wish to write to.
   organization = "howtoforge"
#
#   ## Destination bucket to write into.
   bucket = "tigstack"
Paste the InfluxDB token value saved earlier in place of the $INFLUX_TOKEN variable in the code above.
Search for the line INPUT PLUGINS and you will see the following input plugins enabled by default.
# Read metrics about cpu usage
[[inputs.cpu]]
  ## Whether to report per-cpu stats or not
  percpu = true
  ## Whether to report total system cpu stats or not
  totalcpu = true
  ## If true, collect raw CPU time metrics
  collect_cpu_time = false
  ## If true, compute and report the sum of all non-idle CPU states
  report_active = false
  ## If true and the info is available then add core_id and physical_id tags
  core_tags = false


# Read metrics about disk usage by mount point
[[inputs.disk]]
  ## By default stats will be gathered for all mount points.
  ## Set mount_points will restrict the stats to only the specified mount points.
  # mount_points = ["/"]

  ## Ignore mount points by filesystem type.
  ignore_fs = ["tmpfs", "devtmpfs", "devfs", "iso9660", "overlay", "aufs", "squashfs"]

  ## Ignore mount points by mount options.
  ## The 'mount' command reports options of all mounts in parathesis.
  ## Bind mounts can be ignored with the special 'bind' option.
  # ignore_mount_opts = []


# Read metrics about disk IO by device
[[inputs.diskio]]
....
....

# Get kernel statistics from /proc/stat
[[inputs.kernel]]
  # no configuration


# Read metrics about memory usage
[[inputs.mem]]
  # no configuration

# Get the number of processes and group them by status
[[inputs.processes]]
  # no configuration


# Read metrics about swap memory usage
[[inputs.swap]]
  # no configuration


# Read metrics about system load & uptime
[[inputs.system]]
  # no configuration
You can configure additional input plugins depending upon your requirement including Apache Server, Docker containers, Elasticsearch, iptables firewall, Kubernetes, Memcached, MongoDB, MySQL, Nginx, PHP-fpm, Postfix, RabbitMQ, Redis, Varnish, Wireguard, PostgreSQL, etc.
Once you are finished, save the file by pressing Ctrl X and entering Y when prompted.
Restart the Telegraf service once you have finished applying the changes.
$ sudo systemctl restart telegraf
Step 5 – Verify if Telegraf stats are being stored in InfluxDB
Before proceeding further, you need to verify if Telegraf stats are correctly collected and fed into the InfluxDB. Open the InfluxDB UI in your browser and click the third icon from the left sidebar and select the Buckets menu.
Click on tigstack and you should be greeted with the following page.
Click on the bucket name and then click on one of the values in the _measurement filter, and keep clicking on other values as and when they appear. Once you are done, click the Submit button. You should see a graph at the top. You might need to wait for some time for the data to appear.
This should confirm that the data is being passed on correctly.
Step 6 – Install Grafana
We will use the official Grafana repository to install it. Import the Grafana GPG key.
$ sudo wget -q -O /usr/share/keyrings/grafana.key https://packages.grafana.com/gpg.key
Add the repository to your system.
$ echo "deb [signed-by=/usr/share/keyrings/grafana.key] https://packages.grafana.com/oss/deb stable main" | sudo tee -a /etc/apt/sources.list.d/grafana.list
Update the system repository list.
$ sudo apt update
Install Grafana.
$ sudo apt install grafana
Start and Enable the Grafana service.
$ sudo systemctl enable grafana-server --now
Check the service status.
$ sudo systemctl status grafana-server
? grafana-server.service - Grafana instance
     Loaded: loaded (/lib/systemd/system/grafana-server.service; enabled; vendor preset: enabled)
     Active: active (running) since Tue 2022-09-13 01:04:47 UTC; 2s ago
       Docs: http://docs.grafana.org
   Main PID: 13674 (grafana-server)
      Tasks: 7 (limit: 1030)
     Memory: 104.6M
        CPU: 1.050s
     CGroup: /system.slice/grafana-server.service
             ??13674 /usr/sbin/grafana-server --config=/etc/grafana/grafana.ini --pidfile=/run/grafana/grafana-server.pid --packaging=deb cfg:default.paths.logs=/var/log/grafana
.......
Step 7 – Set up Grafana Data Source
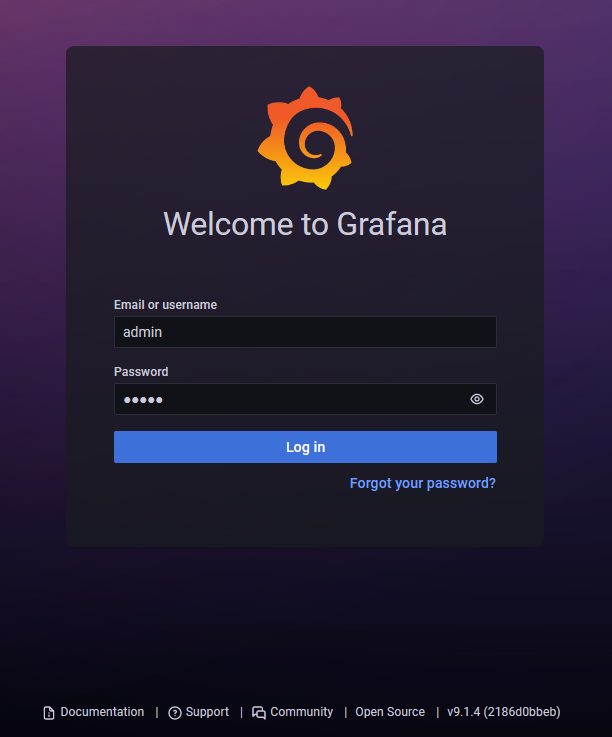
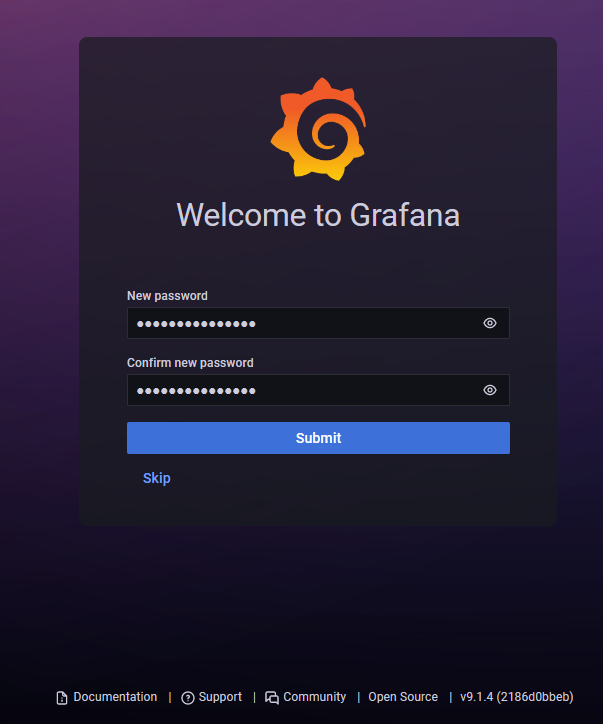
Launch the URL http://:3000 in your browser and following Grafana login page should greet you.
Login with the default username admin and password admin. Next, you need to set up a new default password.
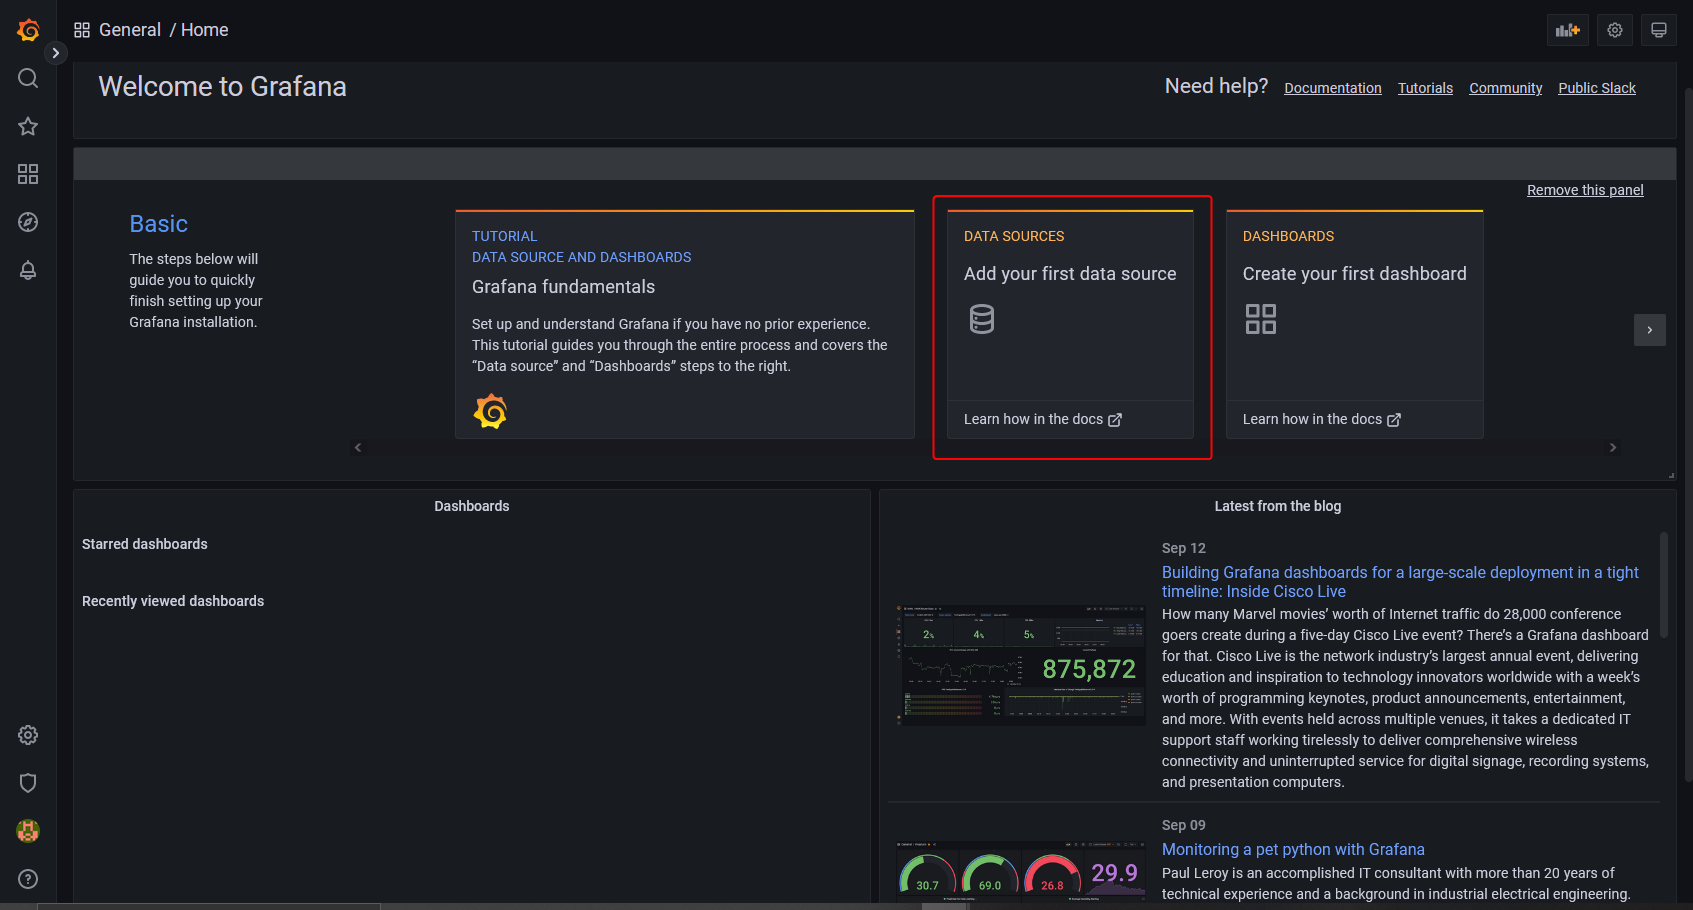
You shall be greeted with the following Grafana homepage. Click on the Add your first data source button.
Click the InfluxDB button.
On the next page, select Flux from the dropdown menu as the query language. You can use InfluxQL as the query language, but it is more complicated to configure since it supports only InfluxDB v1.x by default. Flux supports InfluxDB v2.x and is easier to set up and configure.
Enter the following values.
URL: http://localhost:8086
Access: Server
Basic Auth Details
User: navjot
Password:
InfluxDB Details
Organization: howtoforge
Token:
Default Bucket: tigstack
Click on the Save and test button and you should see a confirmation message verifying the setup is successful.
Step 8 – Set up Grafana Dashboards
The next step is to set up Grafana Dashboards. Click on the sign with the four squares and select Dashboards to open the Dashboard Create screen.
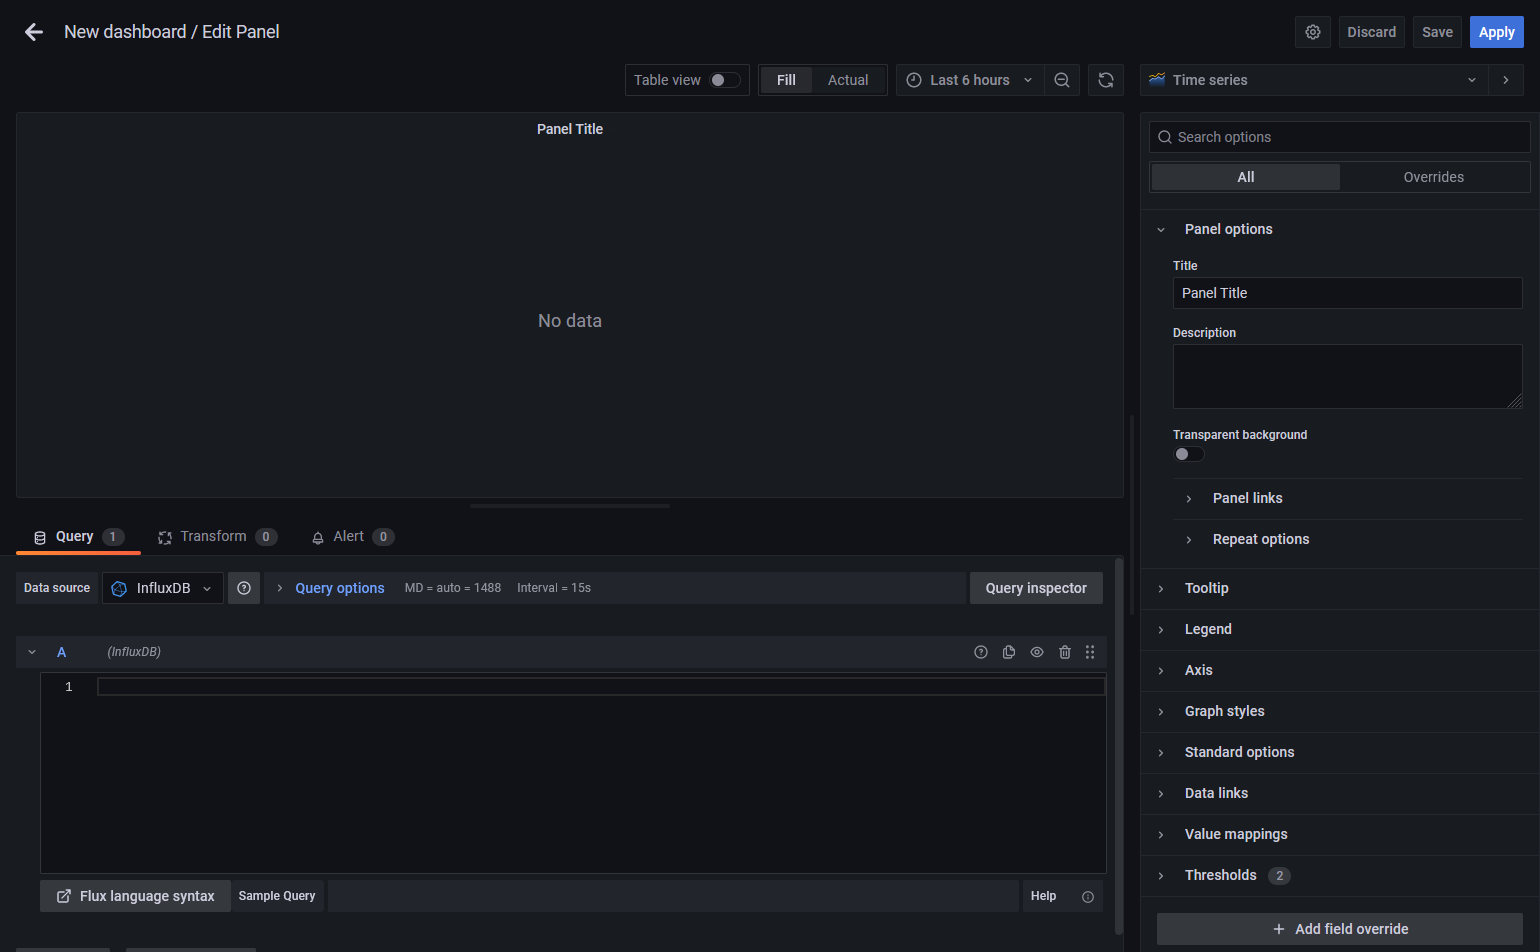
On the next page, click on the Add a new panel button to launch the following screen.
Paste the following code in the Query Editor. This
from(bucket: "NAMEOFYOUBUCKET")
  |> range(start: v.timeRangeStart, stop: v.timeRangeStop)
  |> filter(fn: (r) => r["_measurement"] == "cpu")
  |> filter(fn: (r) => r["_field"] == "usage_idle")
  |> filter(fn: (r) => r["cpu"] == "cpu-total")
  |> filter(fn: (r) => r["host"] == "NAMEOFYOURHOST")
  |> aggregateWindow(every: v.windowPeriod, fn: mean, createEmpty: false)
  |> map(fn: (r) => ({ r with _value: r._value * -1.0   100.0 }))
  |> toFloat()
  |> yield(name: "mean")
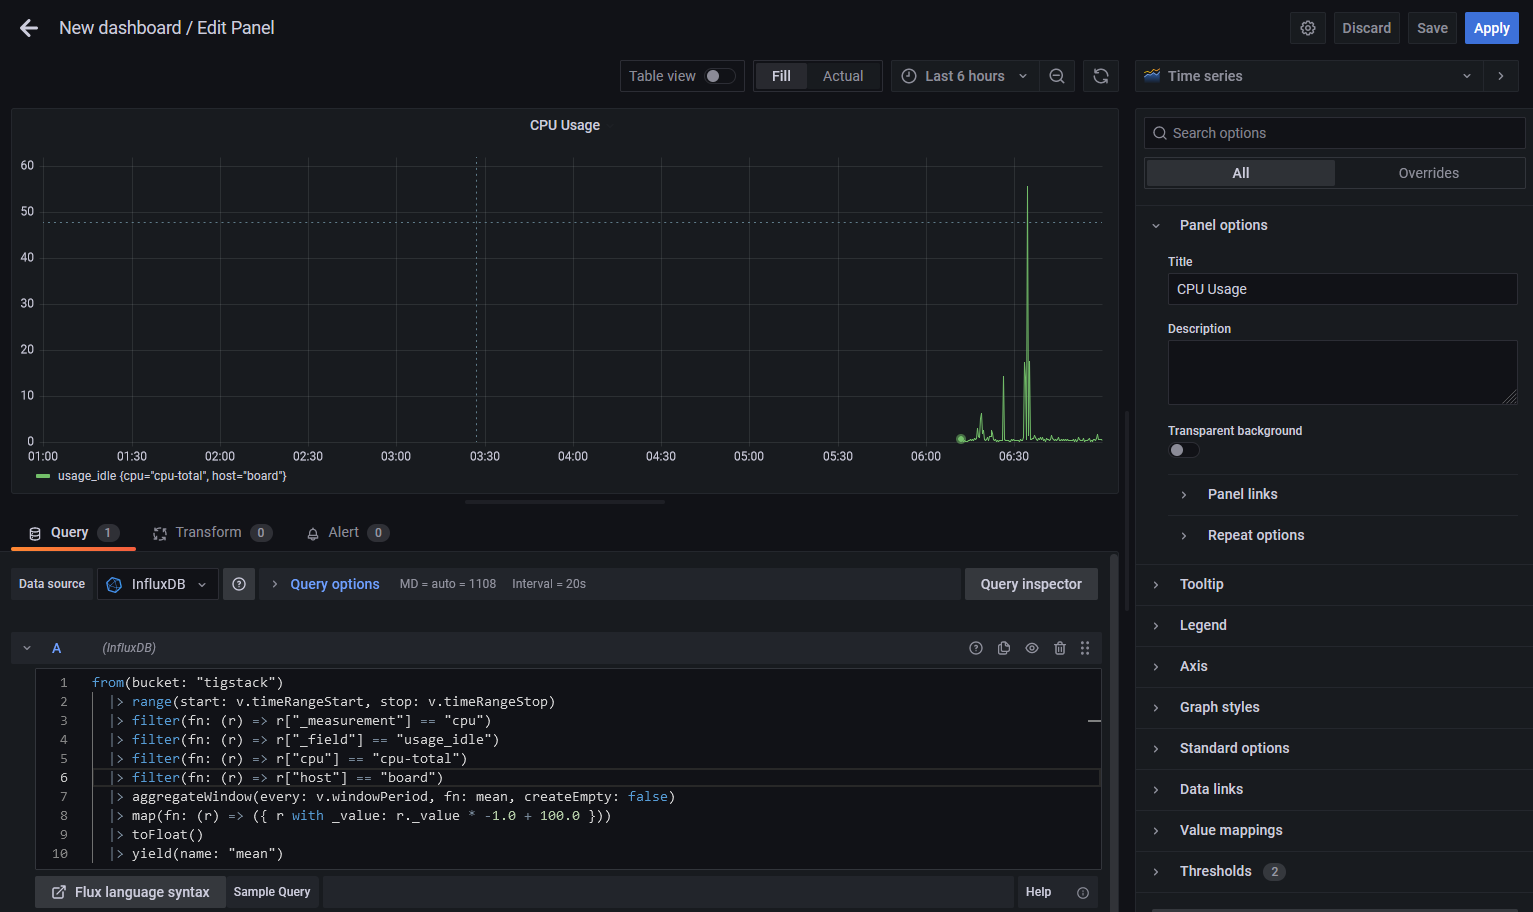
Use the bucket name which we used above. And the name of the host which you can retrieve from the file /etc/hostname.
The above code will calculate the CPU Usage and generate a graph for it. Give the Panel a Title.
Click the Query inspector button and then click the Refresh button to verify if your query is working successfully. Click the cross icon to close the inspector.
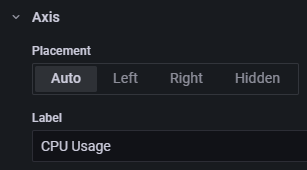
You can also name the axis by using the Label field on the right under the Axis section.
Click the Apply button to save the panel.
Click the Save Dashboard button, once finished.
Give a name to the dashboard and click Save to finish.
It will open the dashboard and then click on the Add Panel button to create another panel.
Repeat the process by creating another panel for RAM Usage.
from(bucket: "NAMEOFYOUBUCKET")
  |> range(start: v.timeRangeStart, stop: v.timeRangeStop)
  |> filter(fn: (r) => r["_measurement"] == "mem")
  |> filter(fn: (r) => r["_field"] == "used_percent")
  |> filter(fn: (r) => r["host"] == "NAMEOFYOURHOST")
  |> aggregateWindow(every: v.windowPeriod, fn: mean, createEmpty: false)
  |> yield(name: "mean")
And use the following code for displaying the HDD Usage.
from(bucket: "NAMEOFYOURBUCKET")
  |> range(start: v.timeRangeStart, stop: v.timeRangeStop)
  |> filter(fn: (r) => r["_measurement"] == "disk")
  |> filter(fn: (r) => r["_field"] == "used")
  |> filter(fn: (r) => r["path"] == "/")
  |> filter(fn: (r) => r["host"] == "NAMEOFYOURHOST")
  |> aggregateWindow(every: v.windowPeriod, fn: mean, createEmpty: false)
  |> map(fn: (r) => ({ r with _value: r._value / 1000000.0 }))
  |> toFloat()
  |> yield(name: "mean")
You can create an unlimited number of panels.
The above code is based on the Flux Scripting language. Fortunately, you don’t need to learn the language to write queries. You can generate the query from the InfluxDB URL. Even though learning the language can benefit in optimizing the queries.
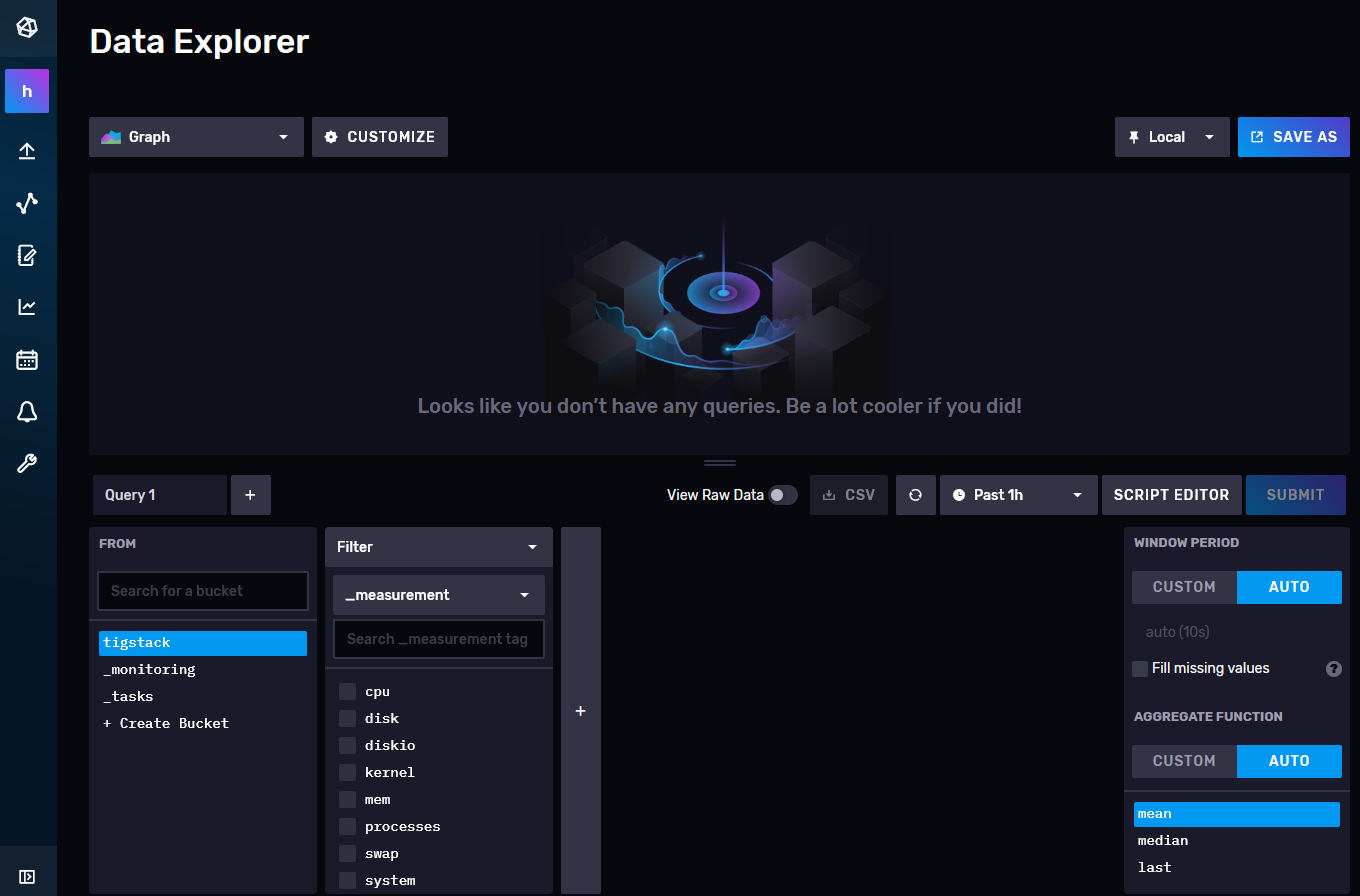
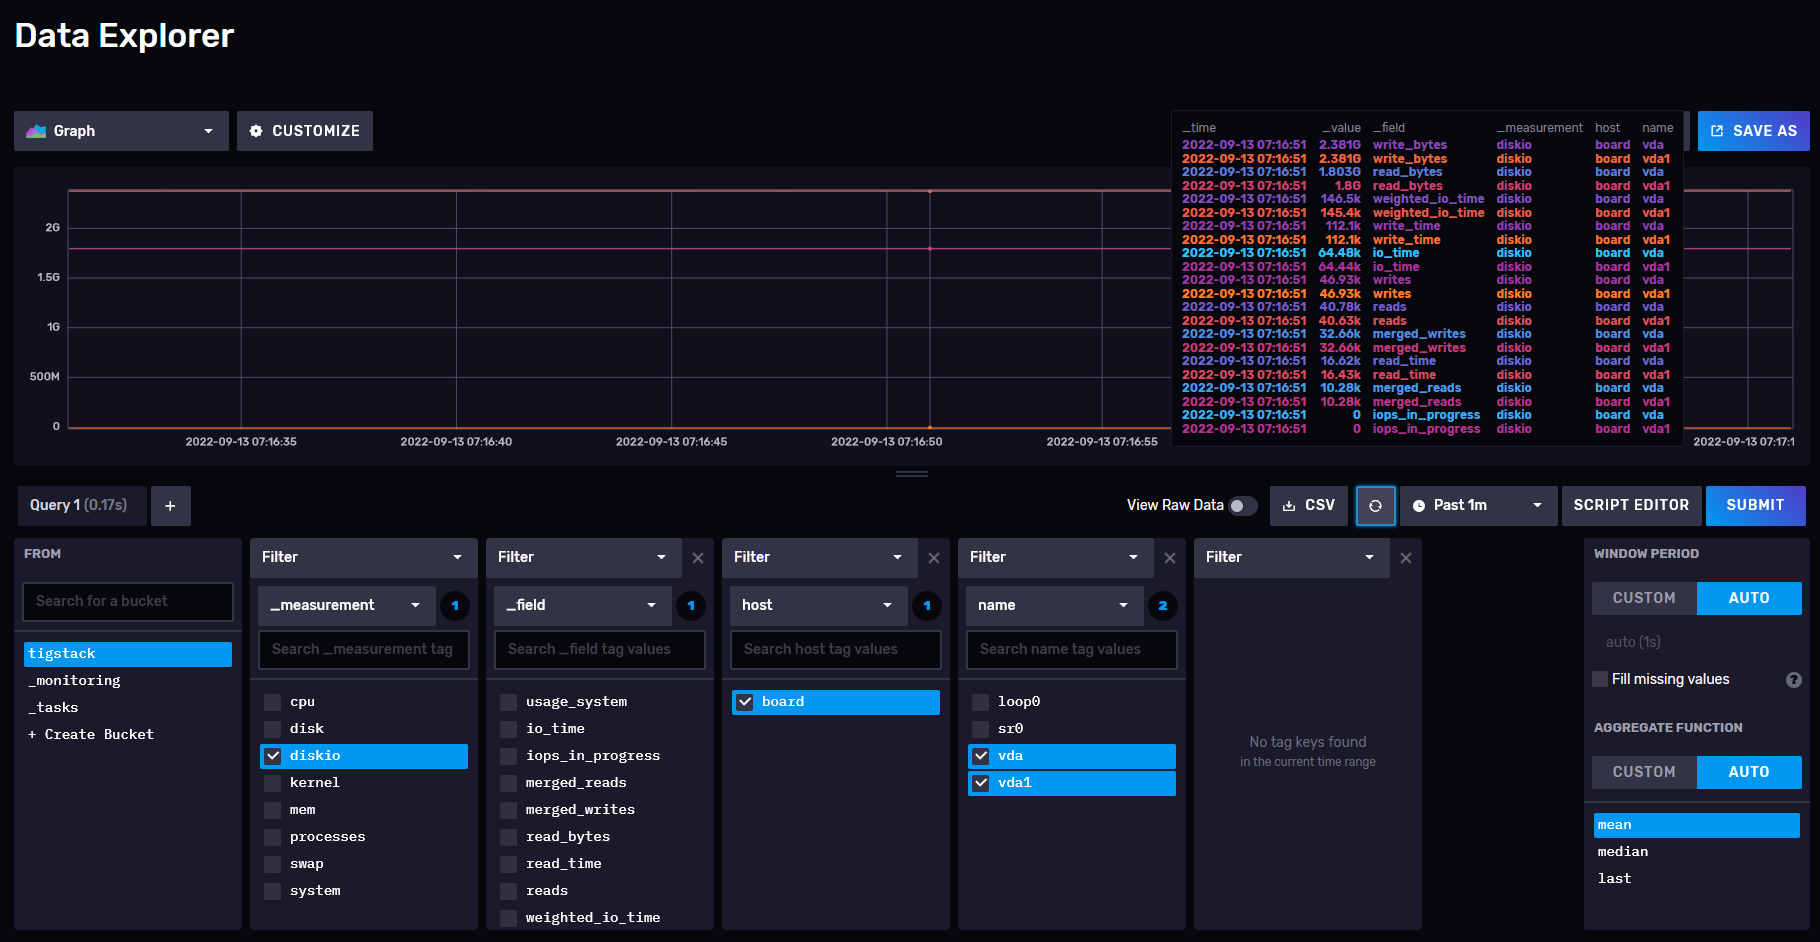
You need to go back to the InfluxDB dashboard and open the Explore page to get the query.
Click on the bucket name and then click on one of the values in the _measurement filter, and keep clicking on other values as and when they appear. Once you are done, click the Script Editor button and you should see the following page. The graph should also be updated.
Copy the query shown and you can now use it in the Grafana dashboard to build your graphs.
Step 9 – Configure Alerts and Notifications
The primary use of setting up monitors is to get alerts on time when the value goes beyond a certain threshold.
The first step is to set the destination where you want to get alerts. You can receive notifications via Email, Slack, Kafka, Google Hangouts Chat, Microsoft Teams, Telegram, etc.
We will be enabling email notifications for our tutorial. To set up Email notifications, we need to configure the SMTP service first. Open the /etc/grafana/grafana.ini file for configuring SMTP.
$ sudo nano /etc/grafana/grafana.ini
Find the following line [smtp] in it. Uncomment the following lines and enter the values for the custom SMTP server.
[smtp]
enabled = true
host = email-smtp.us-west-2.amazonaws.com:587
user = YOURUSERNAME
# If the password contains # or ; you have to wrap it with triple quotes. Ex """#password;"""
password = YOURUSERPASSWORD
;cert_file =
;key_file =
;skip_verify = false
from_address = [email protected]ample.com
from_name = HowtoForge Grafana
# EHLO identity in SMTP dialog (defaults to instance_name)
;ehlo_identity = dashboard.example.com
# SMTP startTLS policy (defaults to 'OpportunisticStartTLS')
;startTLS_policy = NoStartTLS
Save the file by pressing Ctrl X and entering Y when prompted.
Restart the Grafana server to apply the settings.
$ sudo systemctl restart grafana-server
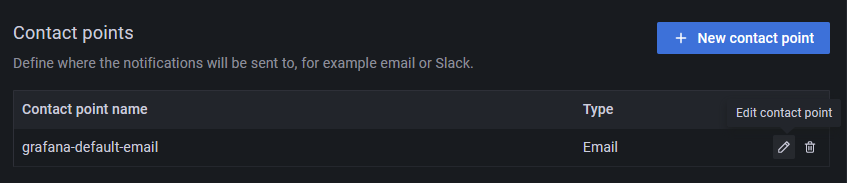
Open the Grafana page and click on the Alert icon and click on Contact points.
Grafana automatically creates and sets up a default email contact point which needs to be configured with the correct email address. Click on the edit button across the grafana-default-email contact point.
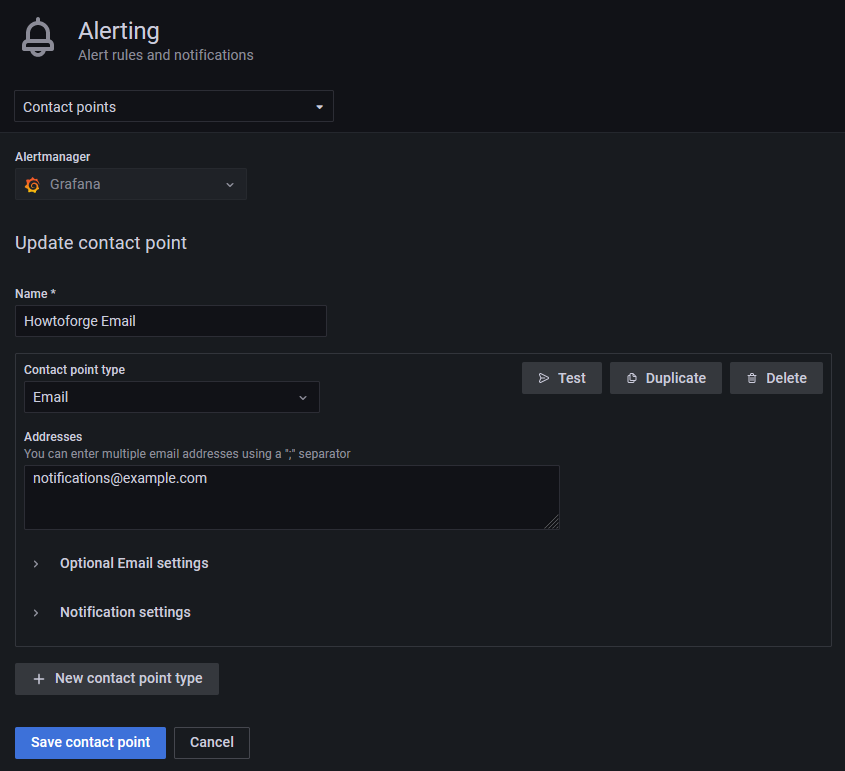
Enter the details to set up the Email notification channel.
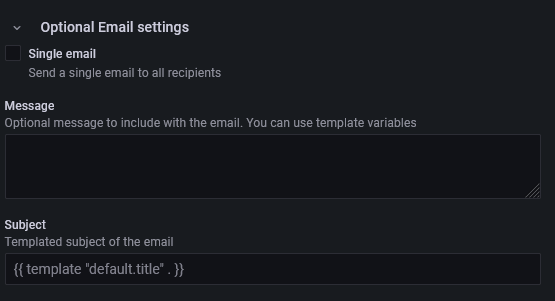
If you want to send an additional message, click the Optional Email settings link and enter the message.
Click Test to see if the email settings are working. Click Save when finished.
Now that we have set up notification channels, we need to set up alerts on when to receive these emails. To set up the alerts, you need to go back to the dashboard panels.
Click on Dashboard >> Browse to open the Dashboard page.
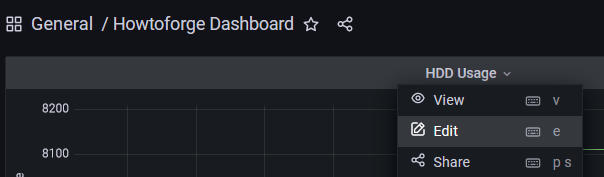
Click on the dashboard we just created and you will get its homepage with different panels. To edit the panel, click on the name of the panel, and a dropdown menu will pop up. Click on the Edit link to proceed.
Click on the Alert Panel and click on the Create alert rule from this panel button to set up a new alert.
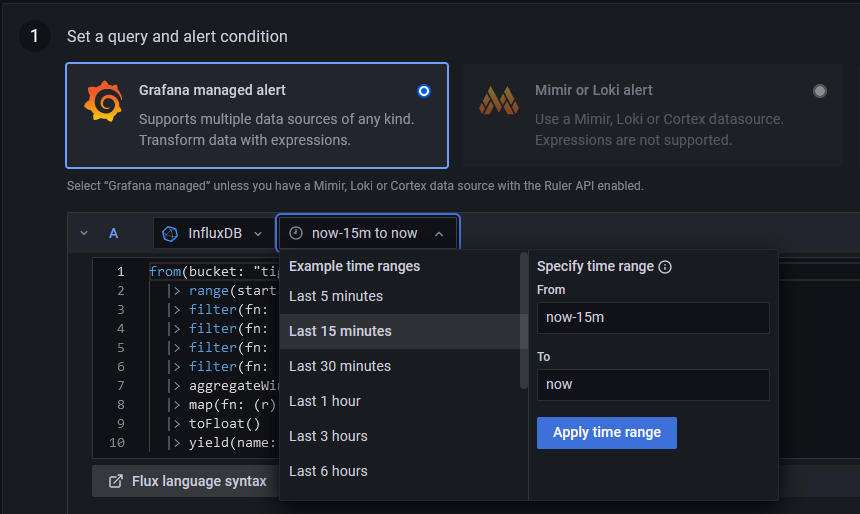
You can now configure the conditions under which Grafana will send the alert.
By default, the selected alert type is Grafana-managed alert. Click the dropdown menu to change the time range to the Last 15 minutes which means it will check from 15 minutes ago to now.
Conditions
Grafana works on a query of the following format to determine when to launch an alert.
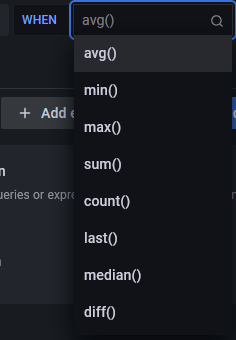
avg() OF query(A) IS BELOW 14
- avg() controls how the value for each series should be reduced to a comparable value against the threshold. You can click on the function name to select a different function such as avg(), min(), max(), sum(), count(), etc.
-
query(A) The letter in the bracket defines what query to execute from the Metrics tab.
-
IS BELOW 14 Defines the type of threshold and the threshold value. You can click on IS BELOW to select a different threshold type.
You can add a second condition below it by clicking on the button beneath the first condition. Currently, you can only use AND and OR operators between multiple conditions.
Rule
- Name – Enter a descriptive name for the alert
- Folder – Create or select a pre-existing folder to store your notification rule.
- Group – Enter a name for your alert group. Alerts in a single group are evaluated after the same time interval.
- Evaluate every – Specify how often Grafana should evaluate the alert. It is also called an evaluation interval. You can set any value you desire here.
No Data & Error Handling
You can configure how Grafana should handle queries that return no data or only null values using the following conditions:
- No Data – Set the rule state to
NoData - Alerting – Set the rule state to
Alerting - Ok – Set the alert rule state to Ok, as in you will get an alert even if things are okay.
You can tell Grafana how to handle execution or timeout errors.
- Alerting – Set the rule state to
Alerting - Ok – Set the alert rule state to Ok, as in you will get an alert even if things are okay.
- Error – Set the alert rule state to Error to indicate there is an issue.
Once you are finished, click the button Preview alerts to see if everything is working fine. Click the Save and exit button on the top right to finish adding the alert. You should now start getting alerts on your email.
Conclusion
This concludes the tutorial about installing and configuring the TIG Stack on a Ubuntu 22.04 Based server. If you have any questions, post them in the comments below.


