You may realize that you can sleep better knowing that you will always be notified if something goes wrong.
Monitoring tools eliminate the need to continuously check logs and remove uncertainty.a
In this article, we will look at how to monitor your PostgreSQL database and which are the most popular monitoring tools.
Let’s start by looking at what PostgreSQL is!
What is PostgreSQL?
PostgreSQL often referred to as Postgres, is one of the best free Object-Relational Database Management Systems and the only object-relational database released under an open-source license that can compete with major commercial licensed projects such as Oracle, Microsoft SQL Server, and others.
To date, Postgres boasts a solid reputation dictated by its over 30 years of active development. Developed with C source code, Postgres is freely available and adaptable to any specific need.
As an object-relational database, Postgres also uses the SQL language to perform various operations on the data stored in the database. The object-relational database model is a database model in which both aspects of the relational model and the object model coincide. The encounter between the two models leads Postgres to store information in the form of objects.
In particular, object-relational systems manage data by storing them in tables, following the approach of relational databases. Still, at the same time, they also have a border system that transforms objects into the rows of specific tables and vice versa.
Therefore, Postgres is much more than a database server. It can be used for all kinds of data processing tasks and many server-type tasks, which makes it a platform that allows you to integrate functions and libraries of multiple languages.
Why Monitor PostgreSQL
Generally, database administrators setting up monitoring want to be able to anticipate problems, whether they are material, performance, quality of service, etc.
Improving the performance of the DBMS without knowing the overall performance of the system is very difficult. If a user complains of a loss of performance, corroborating that claim with information from the supervisory system helps resolve this problem. In addition, it is essential to be able to measure performance gains.
Monitoring Postgres traces also improves applications that use a database. Any error request is tracked in the application logs, making it easy to find problems that users encounter.
Regular monitoring of the volume or the number of connections makes it possible to predict the necessary changes in equipment or configuration: purchase of equipment, creation of indexes, improvement of the configuration.
For example, preventing incidents can be done by having a disk error monitoring probe. Monitoring also makes it possible to anticipate configuration problems. For example, monitoring the number of open sessions on Postgres ensures that this number does not come too close to the maximum number of sessions configured with the parameter max_connectionsin the file postgresql.conf.
Finally, having an optimum level of trace (in other words: neither too much nor too little) allows you to react quickly after a crash and also avoids false alarms and unnecessary panic.
PostgreSQL monitoring
Occasional monitoring is the consequence of a user complaint: we just react to a problem. It is generally insufficient!
It is important to set up an automatic monitoring solution. The goal is to periodically collect statistical data on the objects and the use of the server and to receive alerts when defined thresholds are exceeded.
Postgres offers two channels of information: activity statistics (not to be confused with statistics on data, intended for the query optimizer) and application traces (or “logs”), often in a file like postgresql.log(exact name varies with distribution and installation).
Postgres stores a collection of information (schema metadata, table and column information, internal tracking data, etc.) in system tables that can be viewed by administrators. Postgres also provides views that combine data from different system tables. These views simplify the monitoring of the activity of the base.
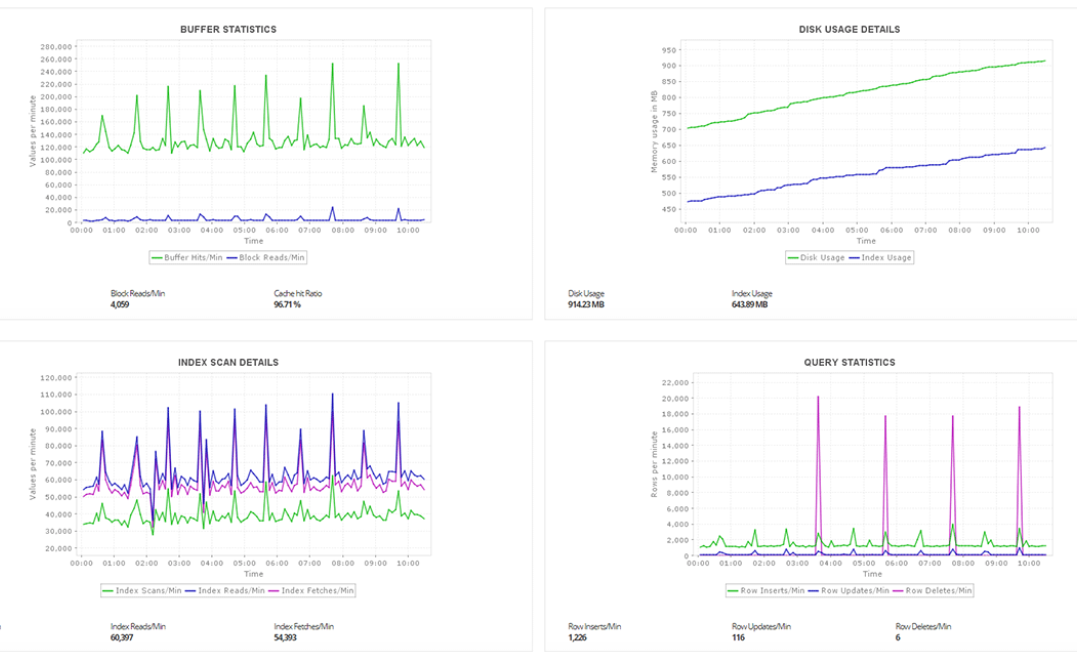
We have discussed that PostgreSQL can track a lot of information that can be used to monitor database activity. To set up an automatic monitoring system, it is essential to ensure that the activity statistics and application traces are correctly configured and make it possible to record, retrieve, log, and send alerts.
Following are the eight best tools to monitor PostgreSQL activity and performance.
Solarwinds
Solarwinds offers a powerful Postgres monitoring tool with agent-less deployment and wide on-premise coverage.
It also provides multi-dimensional query analysis with the option to create custom alerts along with options to generate custom reports. Its integrated VMware monitoring and analysis feature makes it the most robust Postgres tool. It comes with a free 30-day trial, price per module thereafter.
Nagios
Nagios is a free Postgres monitoring tool widely used because of its agility. It provides most standard monitoring tools like a log, query, and table analysis. Nagois also offers a paid solution Nagois Xi which offers additional features such as options to create custom alerts and reports.
Paessler PRTG
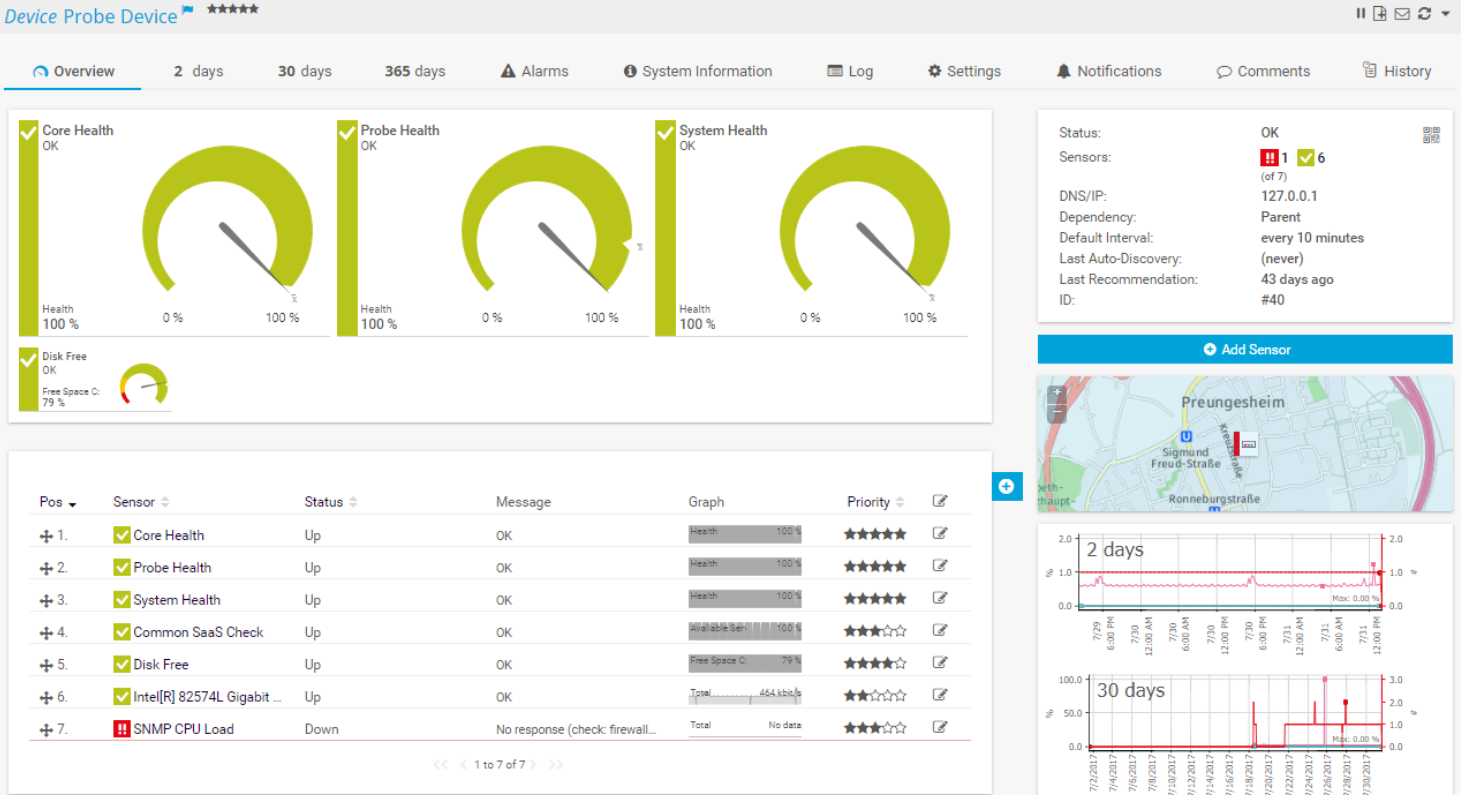
PRTG is one of the most user-friendly Postgres monitoring tools. It provides long-term historical data, and its Postgres sensors help in securing the server if there’s a failure.

Unlike other database monitoring tools, it provides mobiles apps and built-in push notifications to send alerts. However, it does not provide on-premise coverage or integrated VMware. PRTG is free for up to 100 items, and the price varies per item thereafter.
Datadog
Datadog is a fascinatingly deep network monitoring and analysis tool designed for modern, multi-vendor cloud networks. Datadog has an impressive list of cloud integrations that can work with Datadog’s recording, reporting, and analysis engine.
Datadog is designed with large companies in mind and is priced accordingly. If you just need to monitor Postgres, it may just be way too expensive. However, it does offer 14 days free trial, after which it is billed at $15/host per month.
MachineEngine
MachineEngine gives you the ability to monitor critical parameters and the availability of servers. It also provides you the option to set alerts.

Another cool feature, as you move up to the pro and enterprise editions, is the ability to view all of your physical racks in a 3D view. MachineEngine offers a free trial, and after that, it is priced depending on the quote.
Pganalyze
Pganalyze is a tool specifically built to monitor Postgres, which provides fantastic features like auto_explain integration, Postgres vacuum monitoring, and PII Filtering.

It also has an excellent database visualization feature which makes monitoring huge databases easy. It also provides 14 days of historical data. Pganalyze offers 15 days free trial and $149/server after that.
PgDash
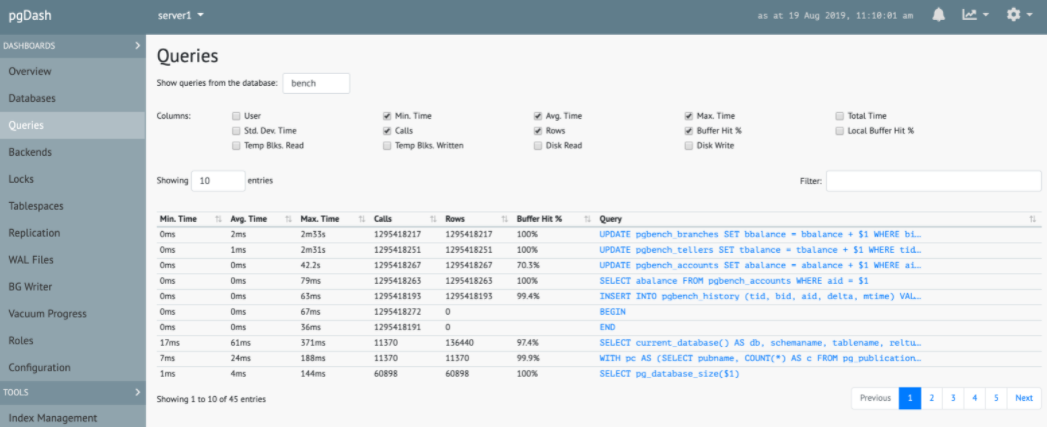
PgDash is another monitoring tool built specifically for Postgres which provides index management, tablespace management, and alerts alongside basic log monitoring features.

It is the best cost-effective Postgres monitoring solution for small teams. It also gives 14 days free trial and $100 /mo for two servers thereafter.
Foglight
Foglight for PostgreSQL is focused on increasing Postgres performance through effective monitoring.
It provides basic function and query analysis features along with table visualization. If you are more focused on the performance side of monitoring, Postgres Foglight is just the right tool for you. Foglight offers a 30 days trial, and after that, you can request a custom quote.
Final Words 👩💻
Postgres management can become much easier and more efficient with a monitoring tool. Selecting a solution can be challenging, but this can be overcome by clearly identifying your requirement and choosing a tool that fits your need.


