How quickly your website or app initially loads is the first impression your users get. In this guide, we’ll list proven techniques to shave off valuable seconds from that initial page load.
Initial load time
The time that it takes from when your user or customer enters your website domain name to when they see content is the most important few seconds you have to make a good first impression.
Amazon found that every 100 milliseconds of latency cost them 1% in sales.
And yet, many web developers treat this as an afterthought. More and more libraries are added for more and more features, and gradually over time, they start seeing less conversions. Worse yet, these losses in conversion are hard to detect because they abandon a slow-loading page before it has time to send any metrics.
Some of these are techniques that can be implemented on the front-end and some on the back-end. Regardless, web apps must be loaded quickly.
Add the right measurements
The first thing you need to do is to add measurements. There are many stages of the loading process, and you won’t know where the bottleneck is without measuring the right segments.
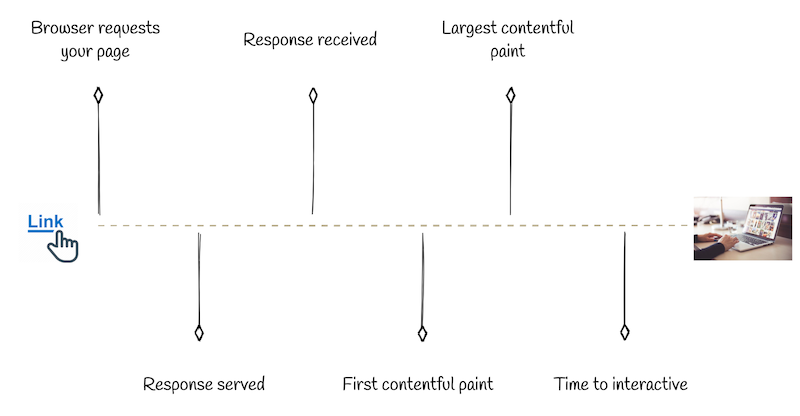
The following are the most important milestones of the loading process:

What this means is that you should be tracking metrics for every segment of this diagram.
Let’s go through how you might do that.
Browser request to response served:
Measure this on your server. You want to get the moment your API gets the request to when it serves a response. Depending on whether external calls to, for example, databases are made, this can be either very short or a significant bottleneck.
Response served to the response received:
This is more difficult to measure, but one way to do so is to add a timestamp when your response leaves your server and measure that with the current time on the user’s side at the first possible moment (a script tag in the head of the HTML page).
Response received to first contentful paint:
The first contentful paint refers to when the first element is rendered on the DOM. That can be something as simple as some text, or background, or a loading spinner. This can be measured by running Lighthouse in the Chrome dev tools.
First contentful paint to largest contentful paint:
The largest contentful paint refers to when the largest element is rendered in the user’s browser viewport. This typically signals the end of the “rendering” portion of the page load, and the user sees a populated screen. This is also measured by running Lighthouse.
Largest contentful paint to time to interactive:
Finally, time to interactive refers to when the user can perform actions like a scroll, click, and type. It can be especially frustrating if this duration is long because they’ll see a rendered screen in front of them but can’t do anything when they expect they’re able to! This is another metric that Lighthouse helps us measure.
Reduce code
Now that you have measurements, you can begin making optimizations. Optimizations have tradeoffs, and the measurements will tell you which ones are worth it.
The fastest page to load is a blank page, but a lot of code can be added to an app before anyone can notice the difference in loading speed between it and a blank page. What often happens is that the increments are so minute that you don’t perceive the difference from build to build until one day, it just starts to feel slow. You realize your app is bloated, and it’s at this point that reducing code will make a difference.
You get two improvements in speed when you reduce code:
- Your app is transferred over the network quicker.
- The user’s browser finishes parsing the code quicker.
The first speedup is small; since requests are compressed over the wire, if you cut 1 MB of source code, it might amount to only 10 KB of savings on bandwidth. However, the speedup from parsing less is significant. Your users are probably running your app on a whole spectrum of browsers and computers, many of whom don’t have the computing power that might parse the code as quickly as it does on your own.
Or they could be running on mobile devices, with even less computing power. The difference can be in the magnitude of seconds.

So the less code you have, the quicker the browser can finish parsing and get to running your app. Even if you want to show a loading screen that Javascript controls, it has preceded by the parsing of that code.
But you don’t want to cut features or actually delete code. Luckily, there’s a couple of standard practices to reduce code without having to do that.
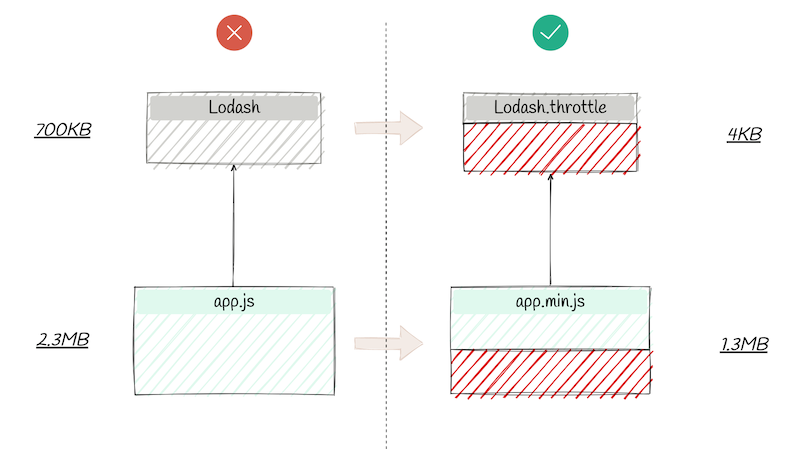
- Run your code through minifiers. Minifiers perform optimizations like shorten long names into short ones (signUpDarkModeButton becomes ss), removing whitespace characters, and others to get your code as compact as possible without losing anything.
- Import partials. Libraries are often bloated with things you don’t need but come packaged together under an umbrella package. Maybe you only want a specific function of a utility library, so instead of importing the entire library, you can import just the code you need.
- Tree-shake dead code. Sometimes you leave code for debugging purposes or haven’t thoroughly cleaned up a deprecated feature, and though it’s in your source code, it’s never run. There are tools in the JavaScript toolchain, like Webpack, that can detect dead code or unused dependencies and remove them from the production build automatically for you.

Split code into chunks
After reducing as much code as you can from your overall app, you can think about further squeezing this idea and reducing the code needed for the initial load.
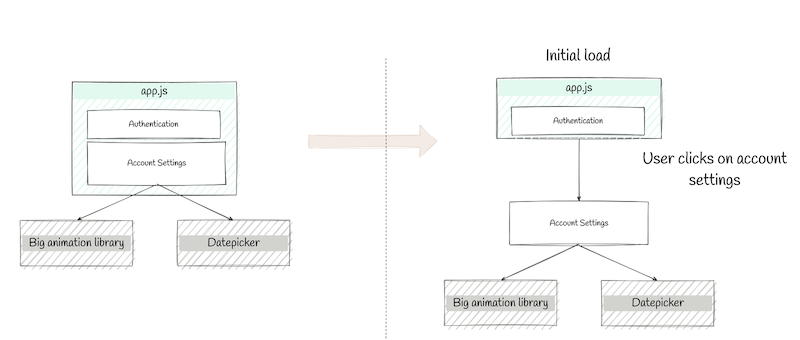
Let’s say 20% of your code is powering some feature of your app that users can only get to after a few clicks. It would be wasted time for the browser to parse that code before showing a loading screen. Splitting your code into chunks can significantly reduce the time to interactive.
Instead of having an intertwined dependency graph of imports for all your Javascript files, identify areas that are easily cut. For example, maybe a component loads some heavy libraries. You can isolate that component into its own file and then only import when the user is ready to interact with that component.

There are several libraries out there to defer loading, depending on which framework you’re using. There’s no need to go overboard with this and split out every component because then the user has a fast initial load and has to wait on every subsequent interaction. Find the largest pieces that you can segment, and split your source code there.
Server-side render
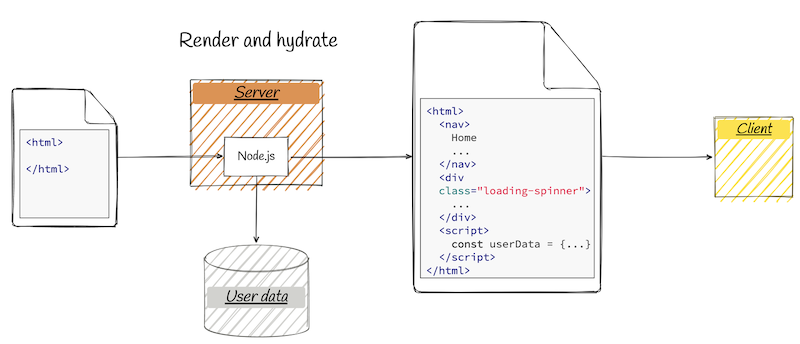
Given that browsers need to do all that intensive parsing and compiling and have users on Chromebooks and mobile devices, one common technique to reduce load times is to have your servers take some of that load. What this means is that instead of giving a blank page and then using Javascript to fill in all the content, as most single-page apps do these days, you can run a Javascript engine on your server (usually Node.js) and fill in as much of the data and content as you can.

Your servers will be much faster and predictable than users’ browsers. Inevitably, they’ll still need to parse some Javascript code for the app to be interactive. Still, server-side rendering can fill in much of the initial content so that when the user gets the page, it’s already showing a loading screen or progress bar at a minimum.
And if data is needed for the initial view, the client doesn’t need to make a separate request to get that; it’ll already be hydrated in the app for the client to use.
Compress assets
Assets make a page come to life, and a page doesn’t feel completely loaded until those assets finish rendering. This may be your background, user interface icons, a user profile picture, even the loading spinner. Often, assets can shift the layout as well, so if a user starts trying to interact with something, the page might continue to jump around while assets are being loaded in. Sometimes, these assets are the largest contentful paint.
But assets are also one of the heaviest parts of an app. An image can come in at several megabytes, and loading many icons can easily exceed the browser’s maximum concurrent network request limit, causing a staggering queue of loading.
You almost never want to download an image off the internet and then reference it in your app. Images should be resized to their smallest possible dimensions that they will be shown at. If you have a user profile displayed in a tiny 50 pixel by 50-pixel element, without resizing, your app will take the time to download the full image that looks sharp as desktop wallpaper and then resize it down to the tiny size.
Secondly, images can be compressed depending on their format. These days, webm is the preferred format, but the field of compression on the web is constantly being improved upon, and many new formats are on the horizon. Due to the changing nature of formats, some browsers may not support the newer ones! Luckily, browser technology can let the user’s browser load whichever format they support.
So, compress to the latest and greatest format, but also keep a less modern version, and use picture and video elements that support falling back formats.
Conclusion
These are five of the most effective techniques for giving your users a blazing fast first-load on your app. These will improve your conversion rates, user happiness, and even search rankings, as SEO rewards quick load times. At Terrastruct, we employ these techniques and more so that users can create and view diagrams that you see in this article as quickly as possible.


