The Chrome DevTools is one of the biggest reasons developers refuse to touch any other browser.
But most of us use only a handful of features, remaining oblivious to many more mind-blowing features that get released silently.
Let’s uncover some of these hidden gems!
Everyone has their favorite operating system, hardware platform, device type, device form factor, etc. But one thing is common to all — they are running the Chrome browser and only the Chrome browser! I think it’s safe to say that the browser wars are over, and Chrome has won convincingly.
Windows users use the default browser only to download Chrome and thereafter use Chrome, ignoring all “recommendations” by Windows. The same goes for Apple’s devices (especially MacBooks and larger-screen devices), where users and developers avoid Safari, despite Apple’s many strong claims and conversion tactics.
And if a device is not running Chrome, chances are high it’s running a Chrome-compatible spinoff such as Brave or Vivaldi. Yes, I know, technically, these browsers are not based on Chrome, but that’s another discussion. The average user might be using these other browsers for ideological or special reasons, but when it comes to developers, there’s no other browser in sight except Chrome.
Even the fact that it’s a memory-eating monster gets ignored. The reason is simple: Chrome DevTools.
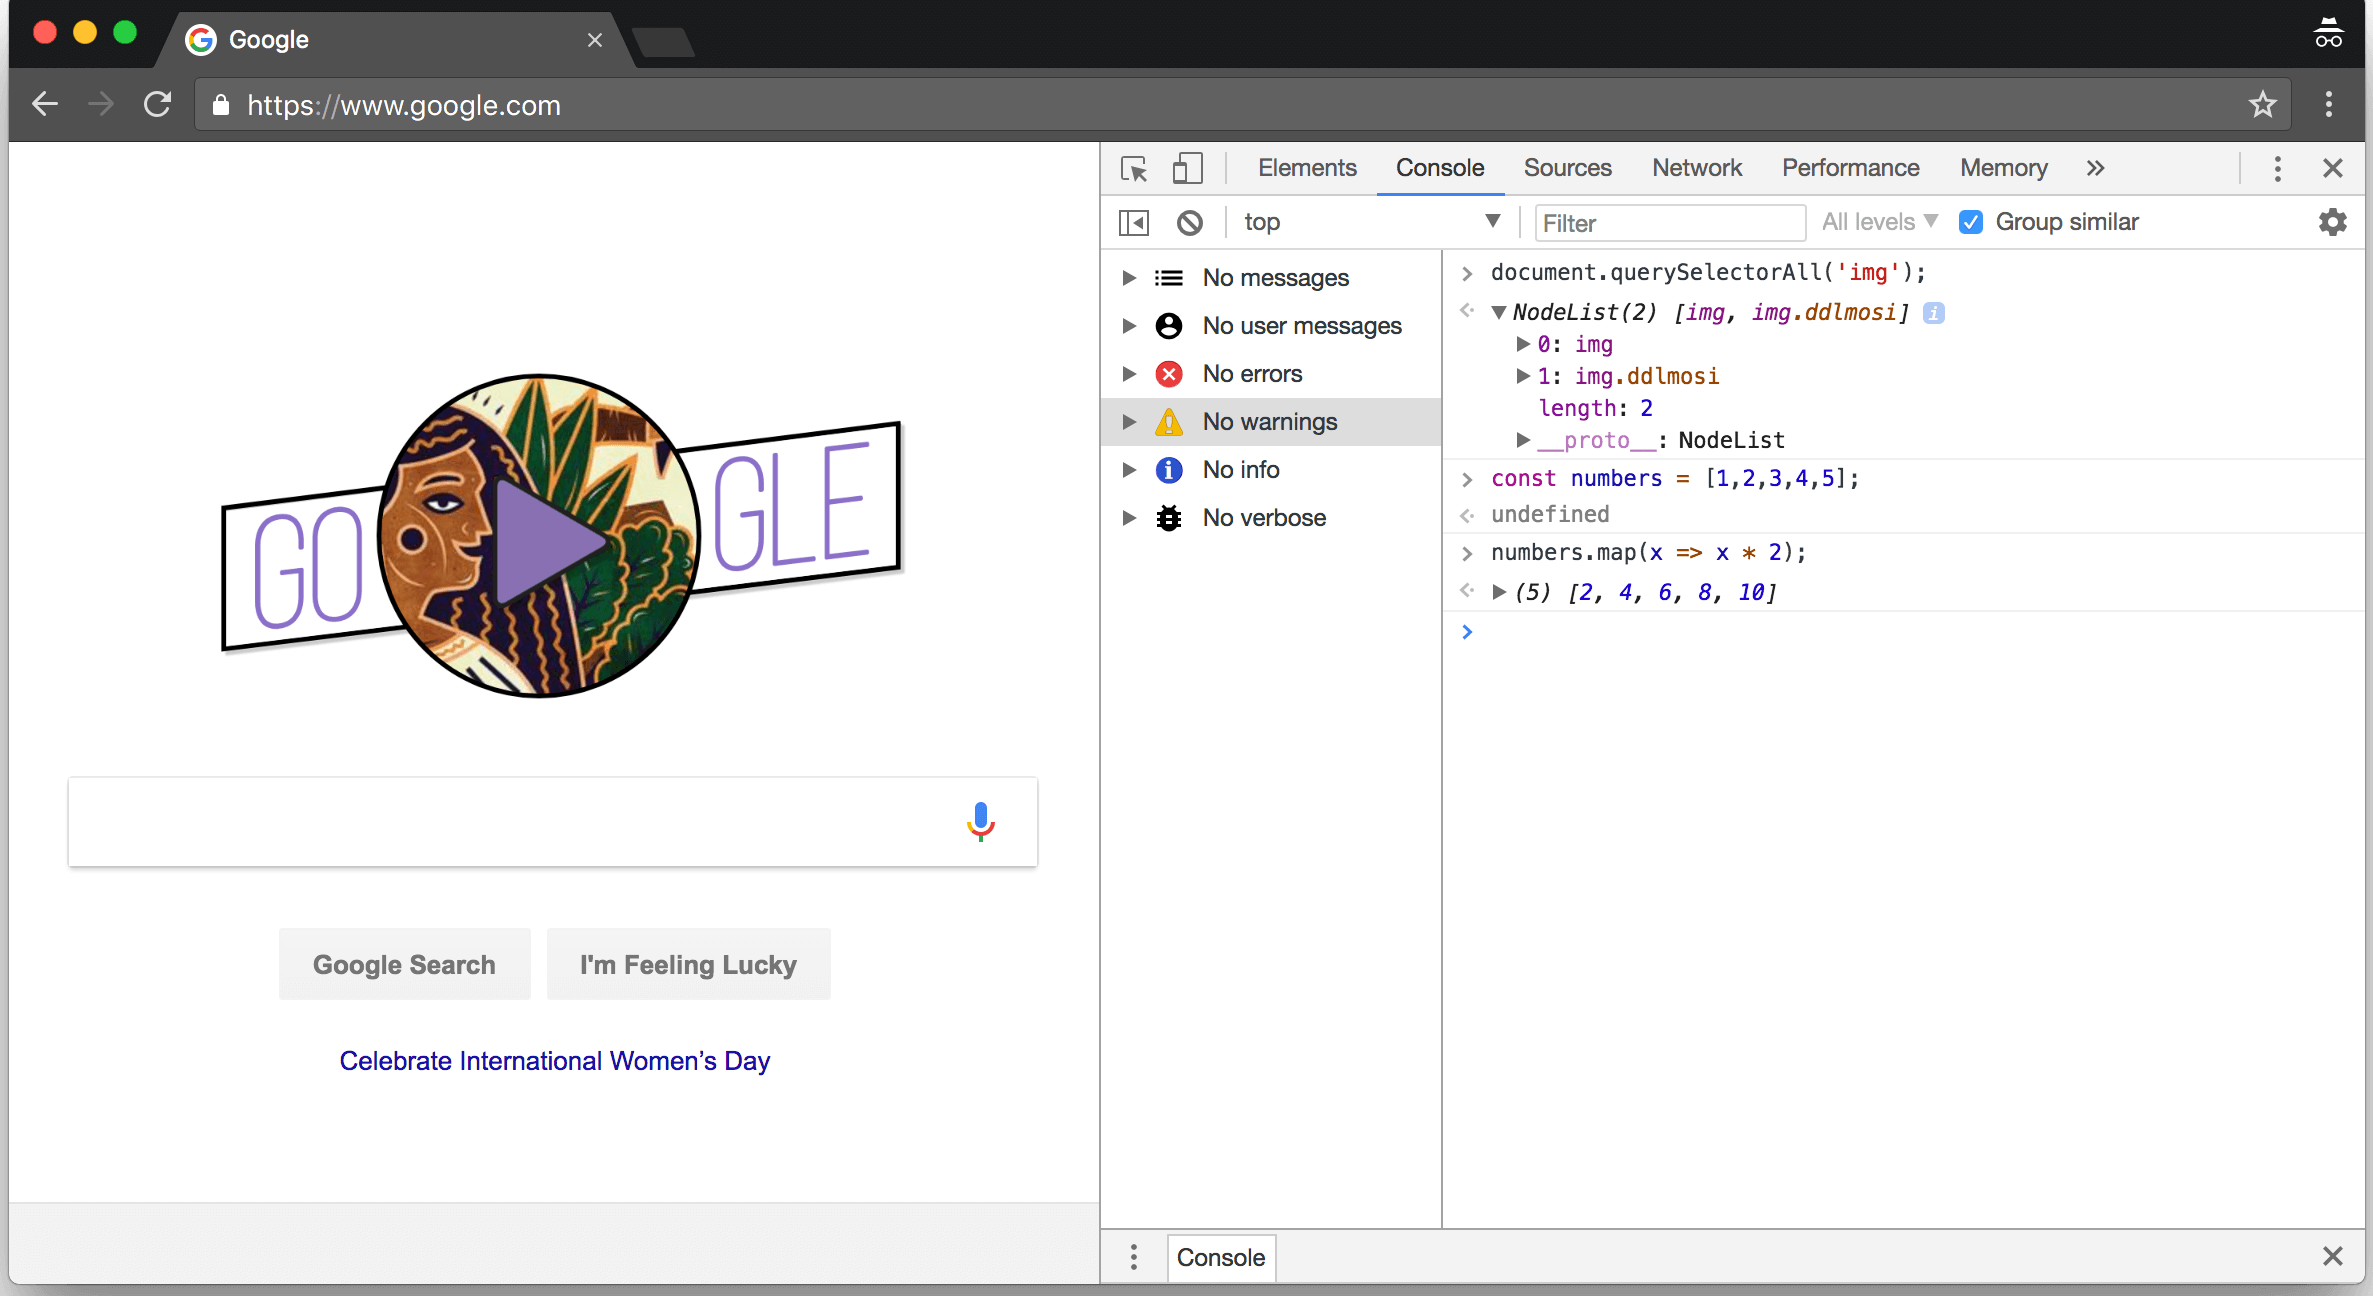
Now, if you’re reading this article, it’s safe to assume that you’re either a power-user, a tinkerer, a web developer, or something along those aligns. As such, none of us needs an introduction to the DevTools, how to open it, its various features, etc.
Instead, without wasting any time, let’s dive straight into some of the lesser-known but astonishingly useful features of the Chrome DevTools.
Design Mode
One of the things developers routinely do is inspect an element on the page and then modify its HTML to preview something or test the effect of a change.
However, working with HTML directly in the DevTools isn’t the smoothest thing ever — wading through the tag soup, straining your eyes trying to find the right opening/closing bracket, and dealing with a ridiculous amount of whitespace while editing text (whitespace that is clearly missing from the document you’re seeing), are some of the issues you can have to deal with. It’s even worse if you’re a designer and don’t want to sift through the mess.
Here’s a screenshot from one of the pages of this very website (Geekflare):
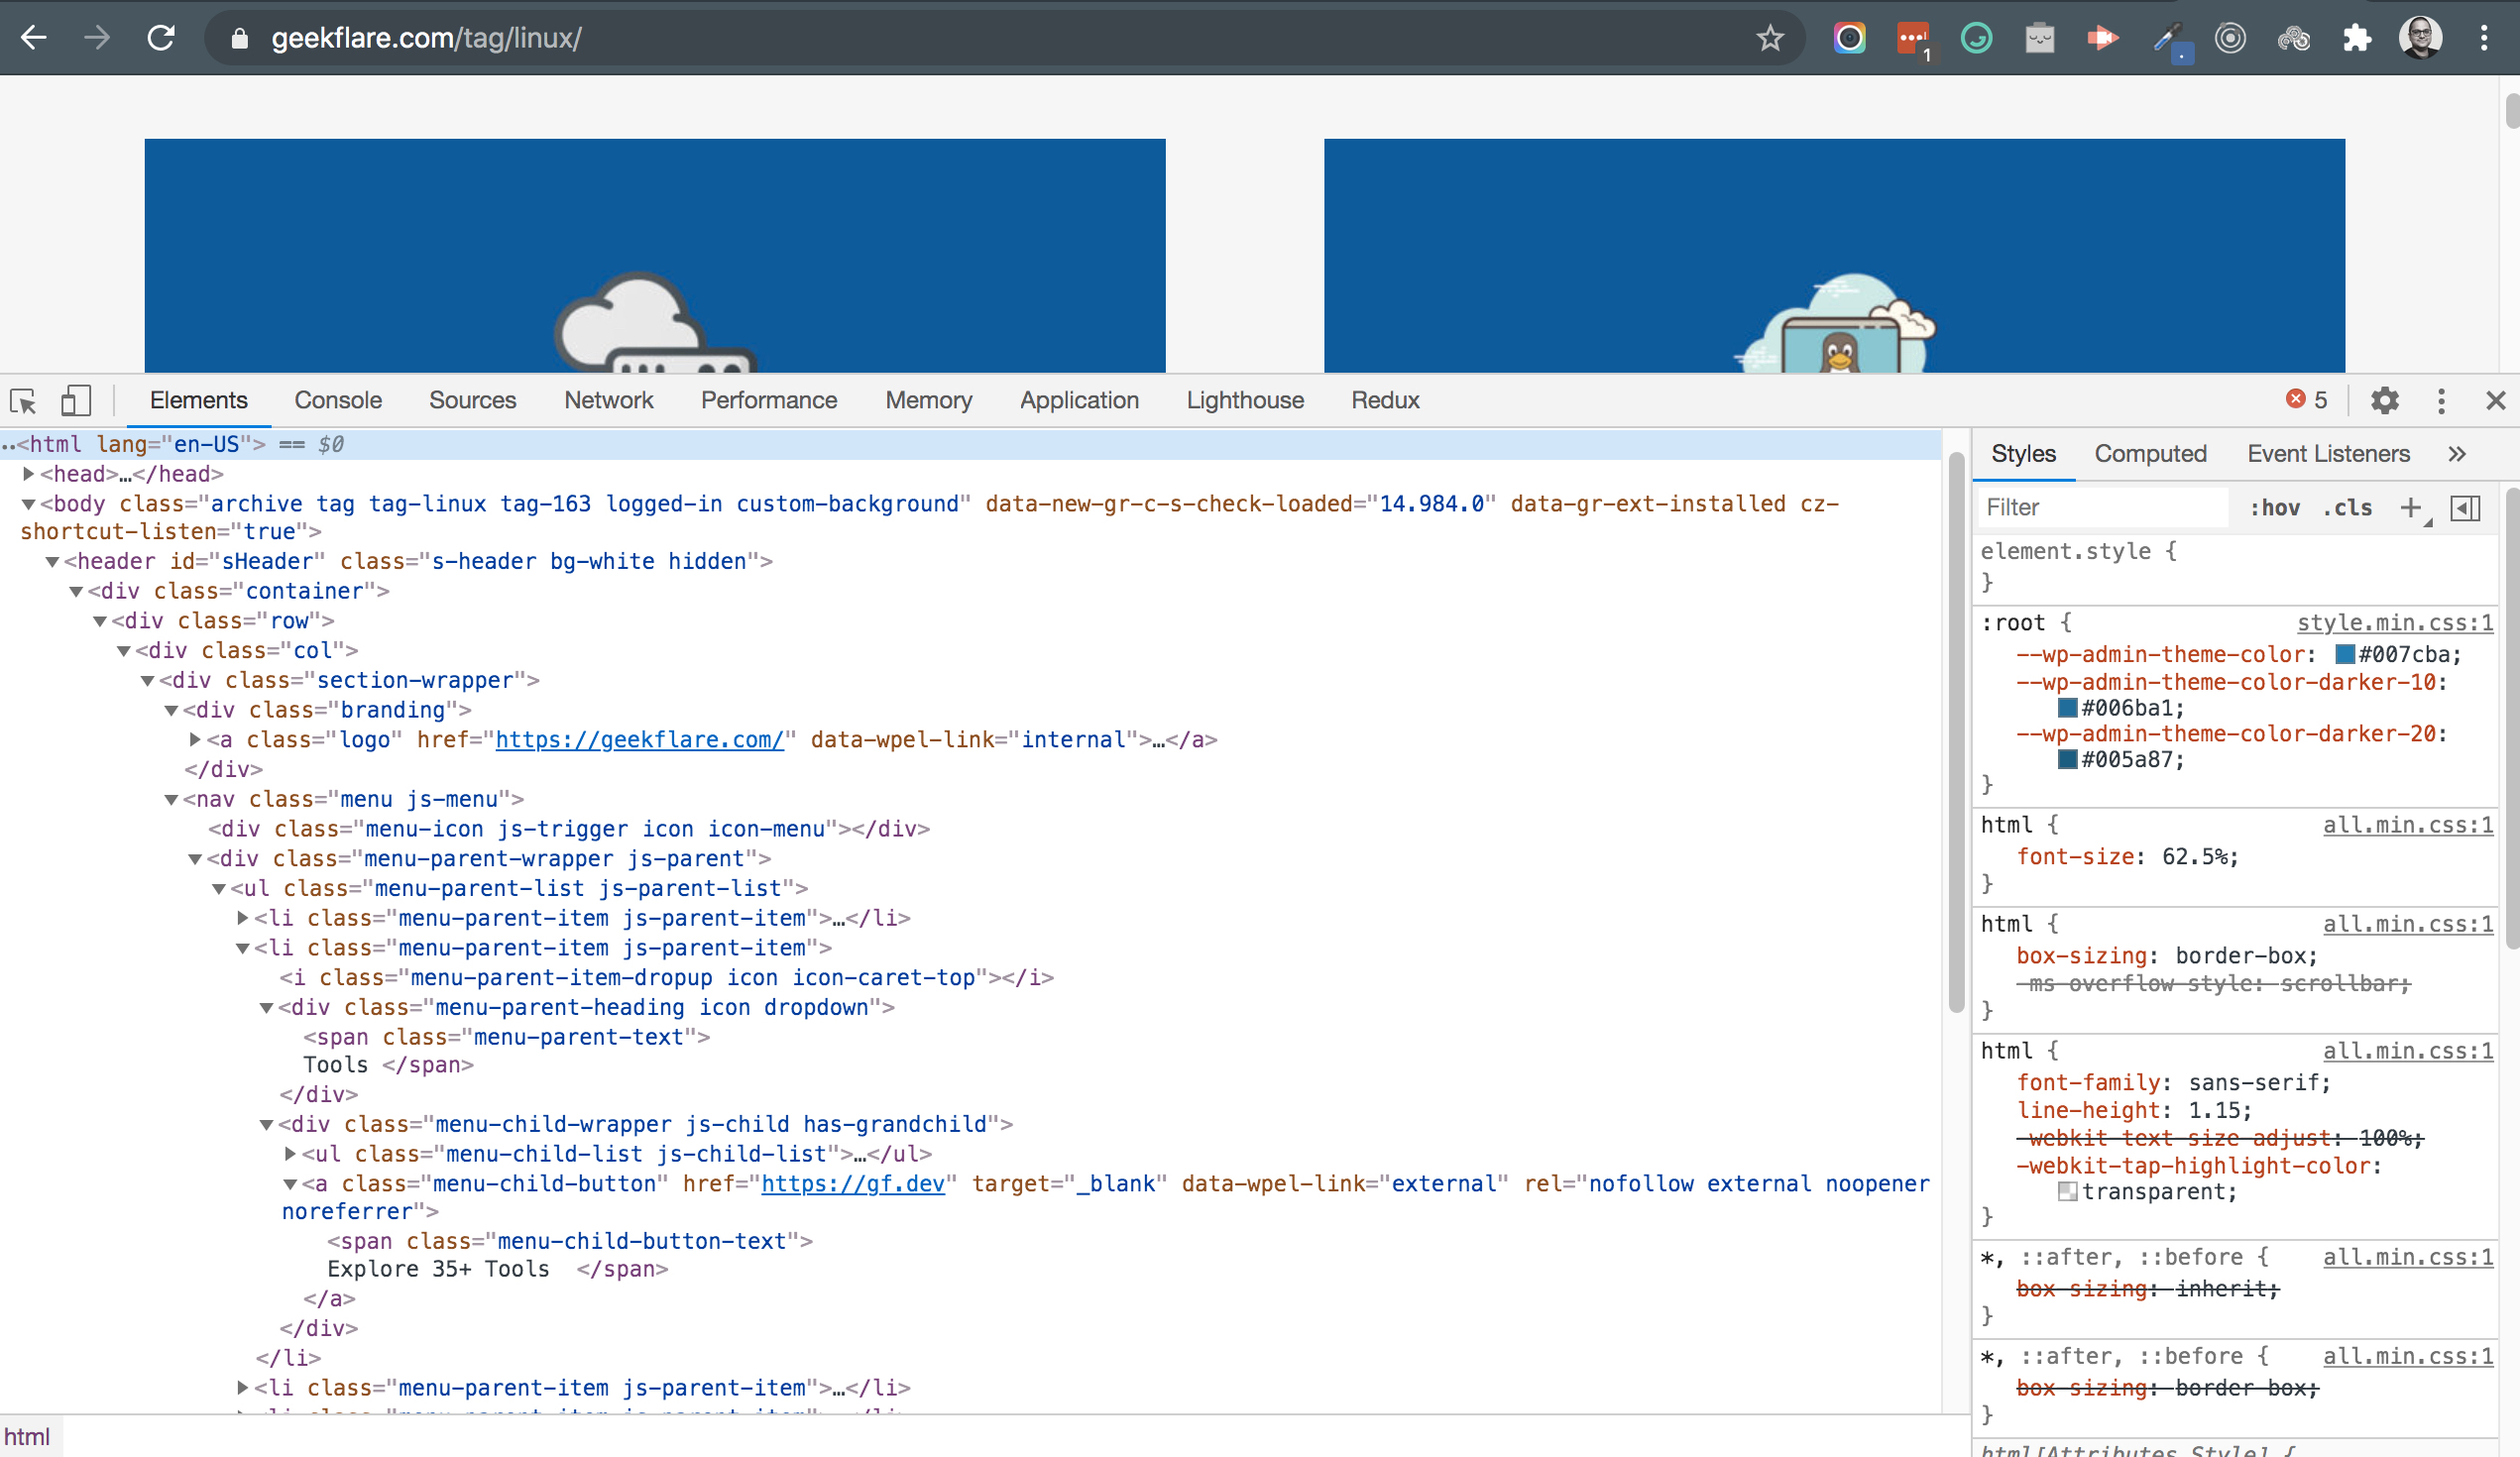
The deeply nested HTML and mysterious, confusing CSS classes are typical of any non-trivial website today, which is where the experience with DevTools is suboptimal, to say the least. 🤭
But there is a DevTools feature called Design Mode, which can lessen the pain in many cases. Using the Design Mode (that’s not the official name, by the way; it’s just what people have named it because of how it gets activated and what it does — don’t worry, we’ll see very soon!), changes to the page can be made visually and live, just like editing a spreadsheet or text editor! The only catch is that this feature isn’t on by default, and activating it is a bit of a headache, especially for non-developers.
In any case, doing so is quite simple; all you need to do is follow the below instructions. Depending on where you sit on the user-sophistication curve, this might be laughably easy or moderately difficult. Here’s what to do:
- Make sure the web page you want to edit is loaded, and you’re currently looking at it (that is, the tab in question is the active one).
- Open the DevTools panel the way you usually do (keyboard shortcut, mouse clicks, whatever). I like using keyboard shortcuts, and on Mac,
Opt Cmd Idoes the job. - Now, with the DevTools open, go to the tab called “Console”. Some of you might be rolling your eyes at how silly, and obvious all this seems, but hey, let’s also think of the (hundreds of?) thousands of people out there who struggle while working with the browser console and JavaScript (for whatever reason).
- Click on the first line next to the cursor, which will then present a typing prompt, and now you can write JavaScript code there (see the screenshot a little further below).
- Now we need to write some JavaScript code. Don’t fret, as what you need to write/type is very short and straightforward:
document.designMode = "on". You can also copy and paste the code from this page (if you do, make sure that the formatting doesn’t get copied — we need only plain text) or if you’re feeling confident, type it out. - Hit Enter/Return.
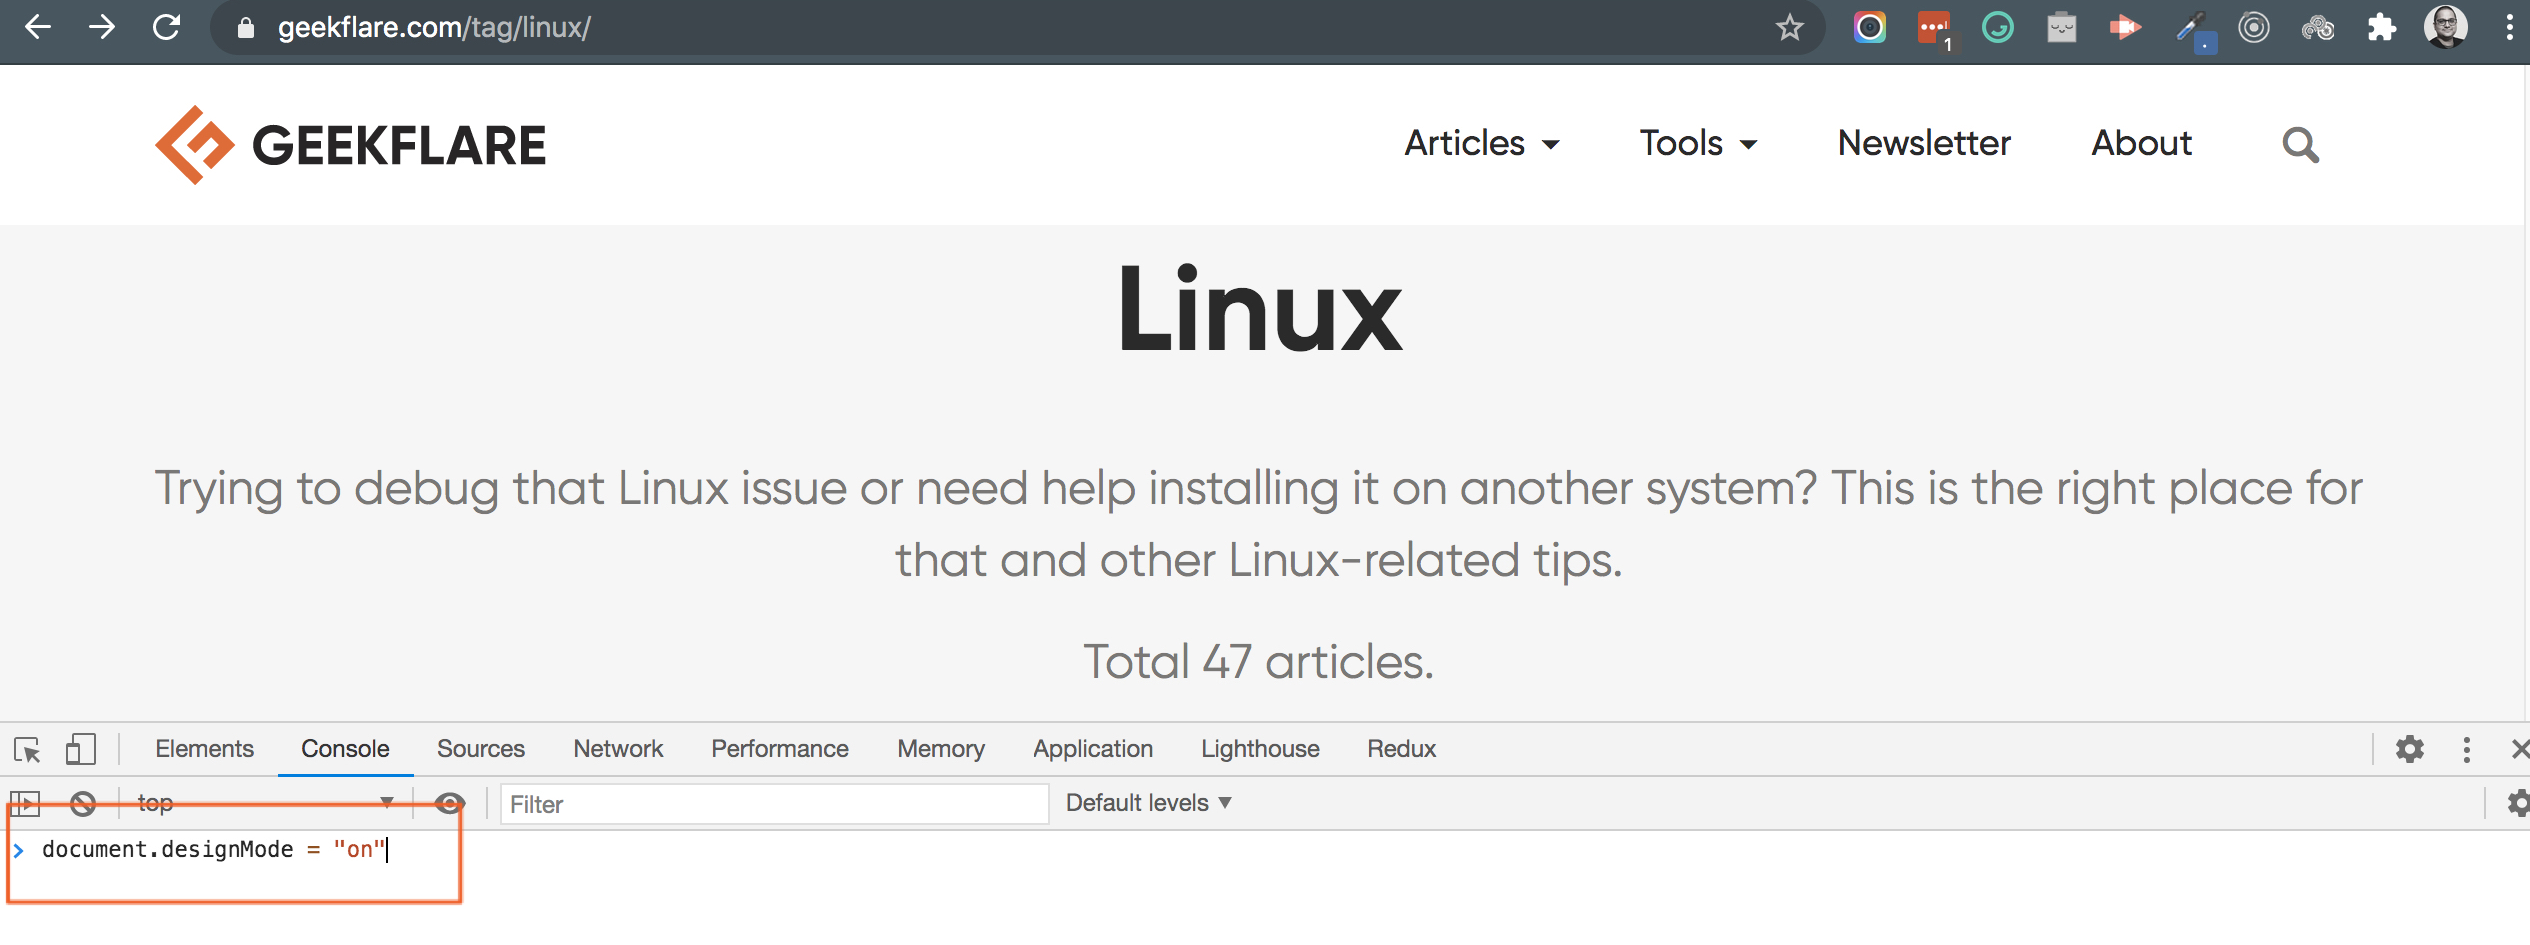
Yup, that’s all!
Now you can freely make edits to the page as if it were a document. Check out this example video where I live-edit the Spotify website using Design Mode:
The Design Mode feature, exciting as it is, is not a silver bullet; you can’t, for example, easily copy-paste buttons, change their appearance, and so on. The actual number of things it can do compared to a dream visual web page editor is very low; however, it does solve use cases where content needs to be changed visually and on-the-fly.
That said, it’s not too far-fetched to claim that the Chrome folks are testing how well this feature is received; if it finds good reception and a strong use case, it’s reasonable to expect that more powerful editing capabilities will soon follow! 🤞🏻🤞🏻
Simulating network conditions
The Network tab in Chrome DevTools is perhaps the one most widely used (I don’t have data on it, of course, but as a web developer, I tend to use the Console tab maybe 20-30% of the time, and the Network tab the rest of the time). It gives us all sorts of information about the requests being made from the page, their type, metadata/headers, status, download progress of assets (images, stylesheets, etc.), load times, and so on. With such incredible usefulness, it’s no wonder that the Network tab is the most common.
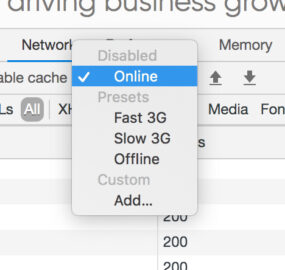
And yet, it’s straightforward to miss the feature we’re discussing; you might not have noticed a harmless dropdown that states the obvious: Online.
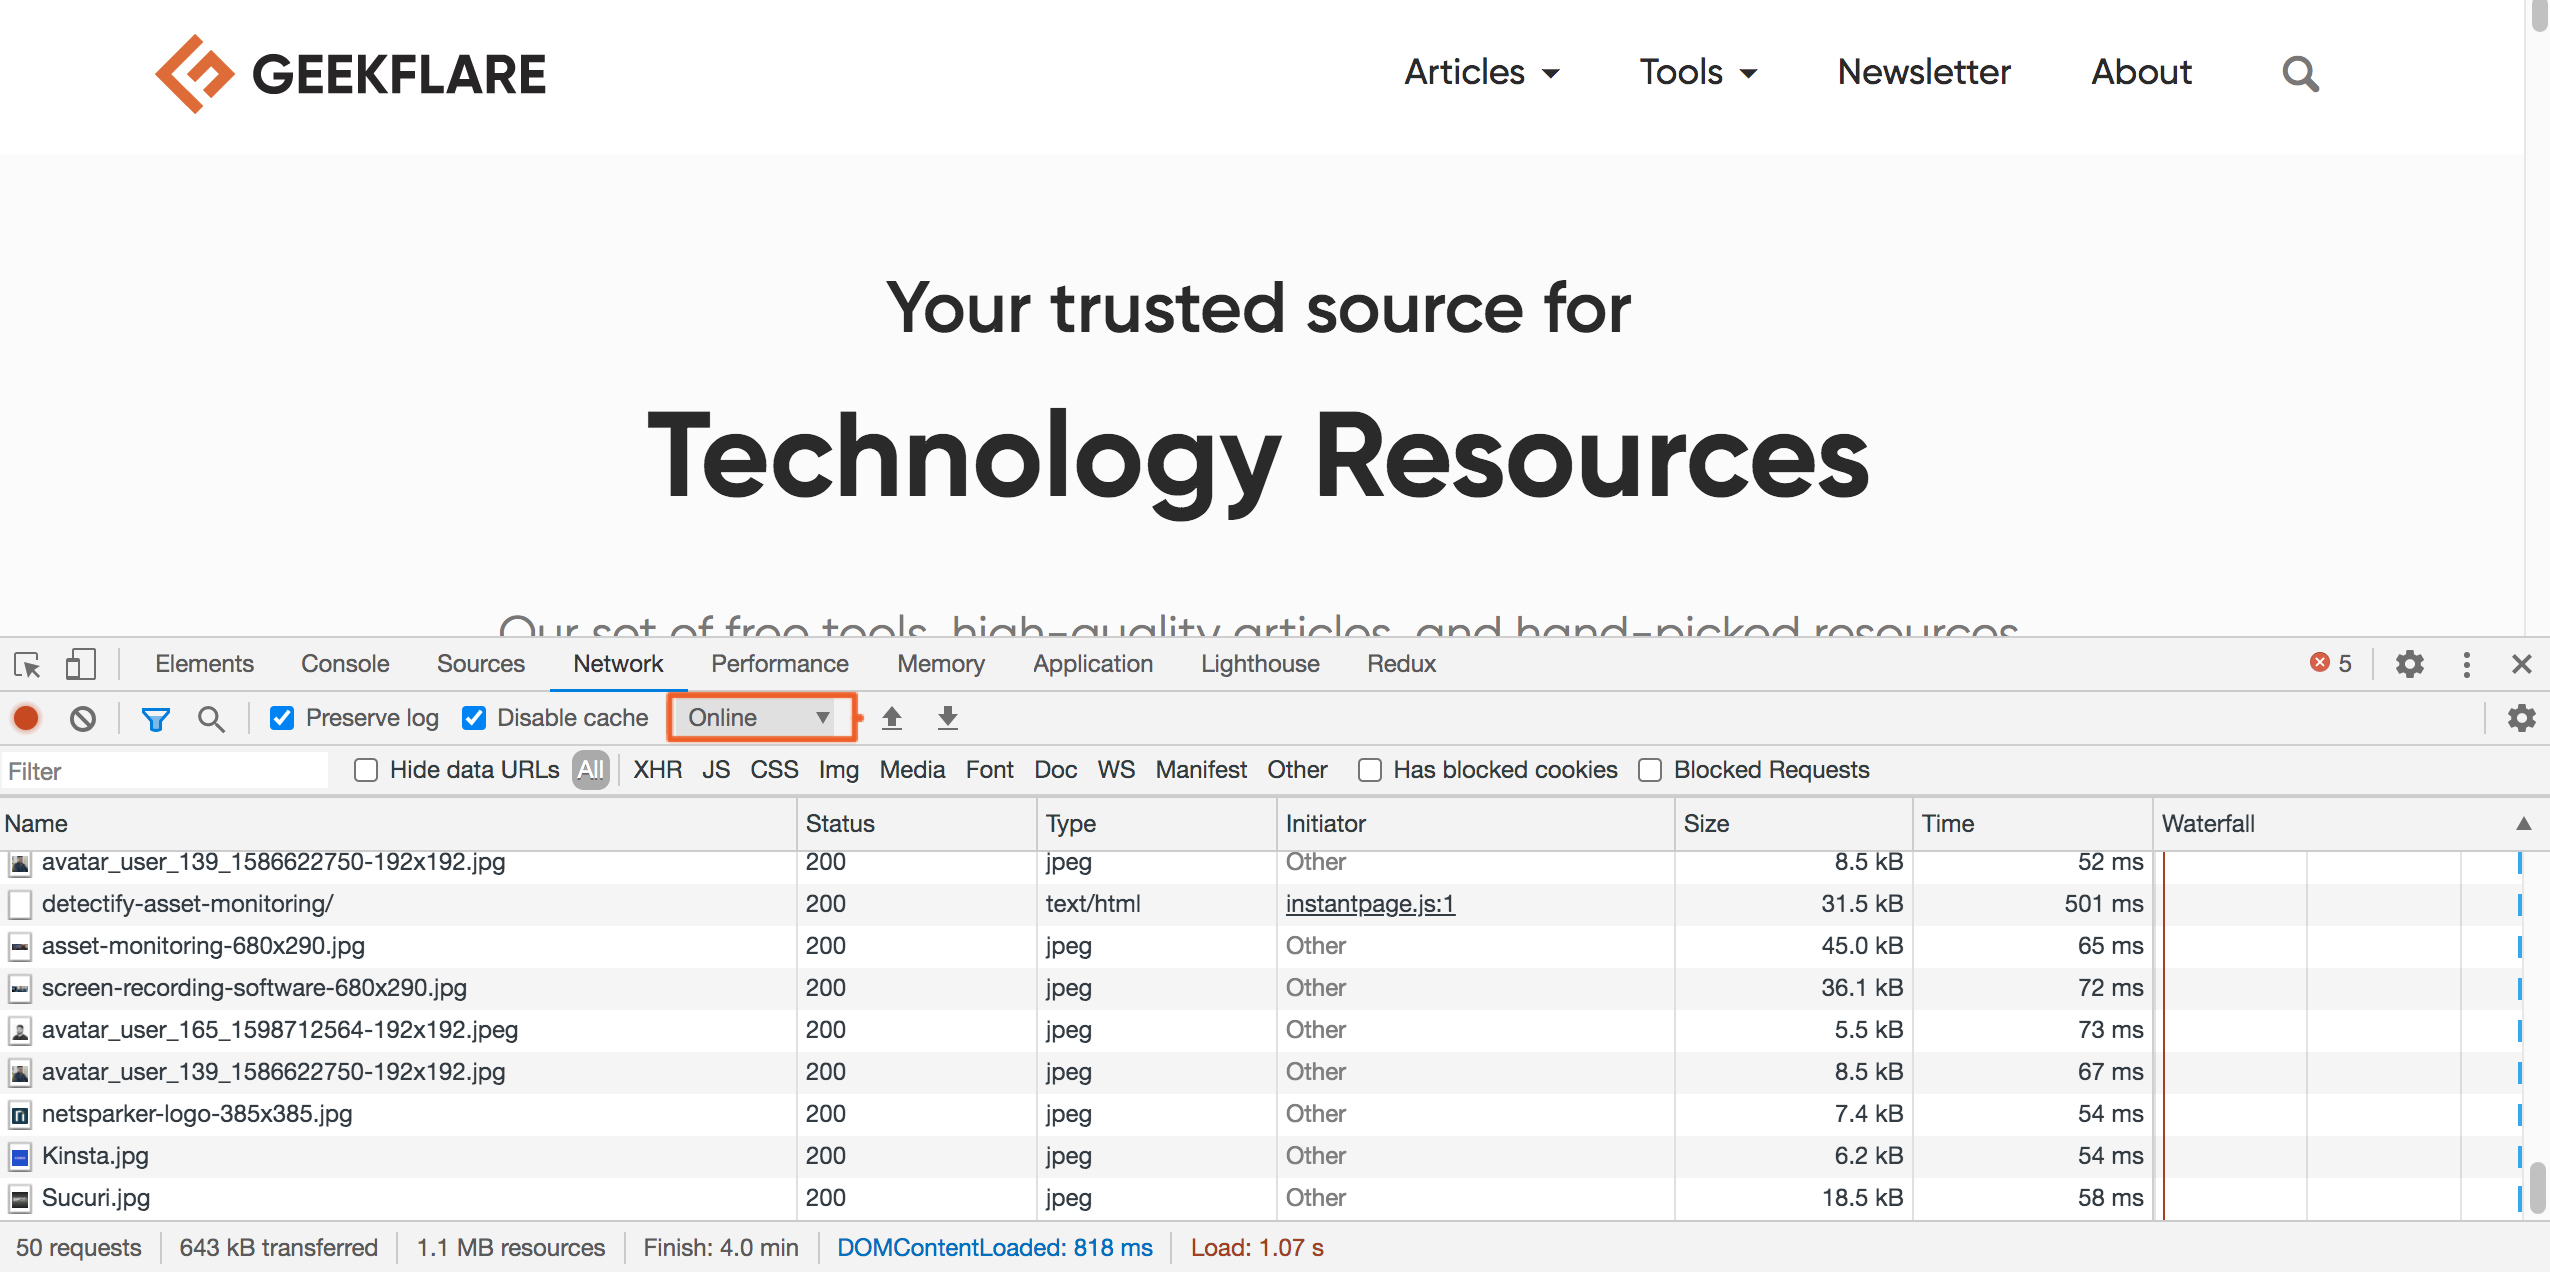
If you click this, you’ll see a dropdown with various options that let you throttle the network speed: Fast 3G, Slow 3G, Offline, etc. While there can be various use cases for this option, the most common is to test website performance on slow networks or web app behavior when offline (assuming such capabilities were added).
Let’s take this for a spin. I’ll set the network to “Slow 3G” and reload the same page from the previous screenshot. Before I do that, notice in the earlier screenshot how on my current network connection (a 40 Mbps broadband), most assets are being downloaded in under 100 milliseconds.
And now, time to see what slow 3G does to it.
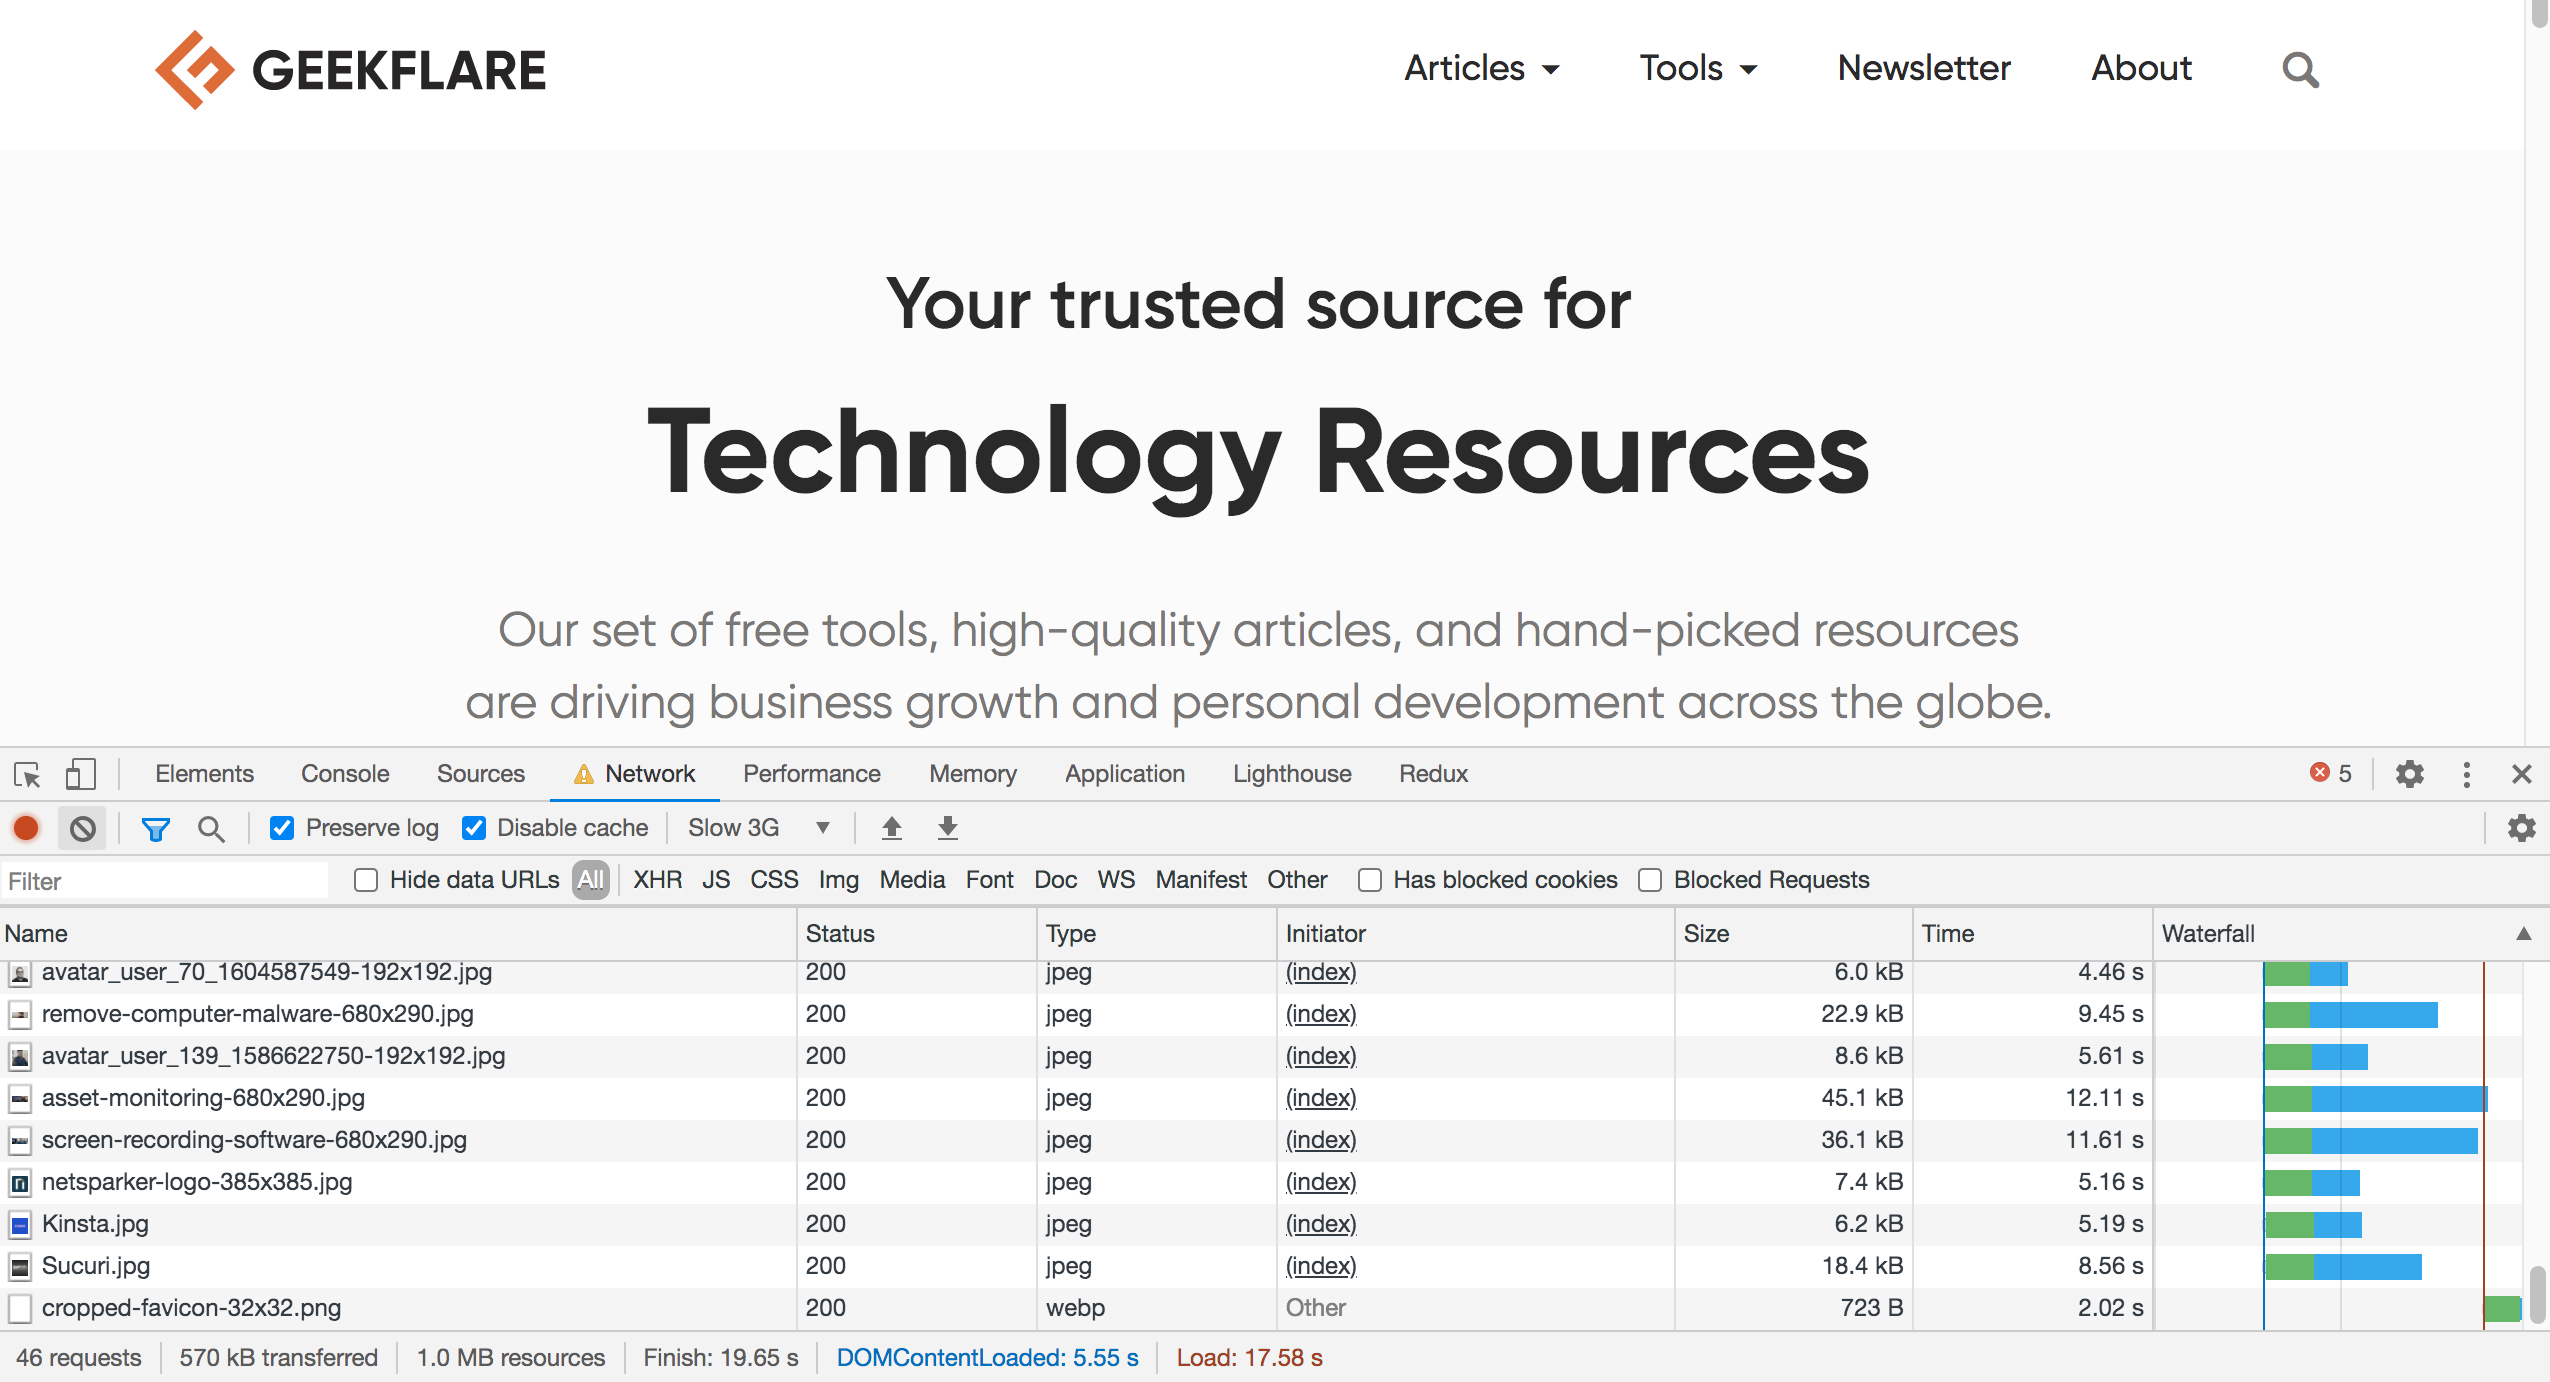
What a difference!
Notice that the loading time for assets is now in the 5-10 seconds range. Also, the site finished loading fully in 17.25 seconds! Yes, I know what you’re thinking, but you have to consider that on a slow 3G network, any modern website will take several seconds to load. Whether you want fast loading on slow networks is another thing, though all in all, it has to be a business decision where the gains justify the effort.
In the screenshot above, notice the warning icon on the Network tab. That’s Chrome’s way of reminding you that you made some non-default, persistent change, and unless you know what you’re doing, you should maybe reset it.
Interactive color picker
Inspecting DOM elements in DevTools is something we all do pretty much every day. We’re also used to the CSS details section shown alongside, and we know we can edit it and see the results immediately.
One tiny convenience hidden among all this is that if you click on a CSS color property, a familiar color picker interface will pop up!
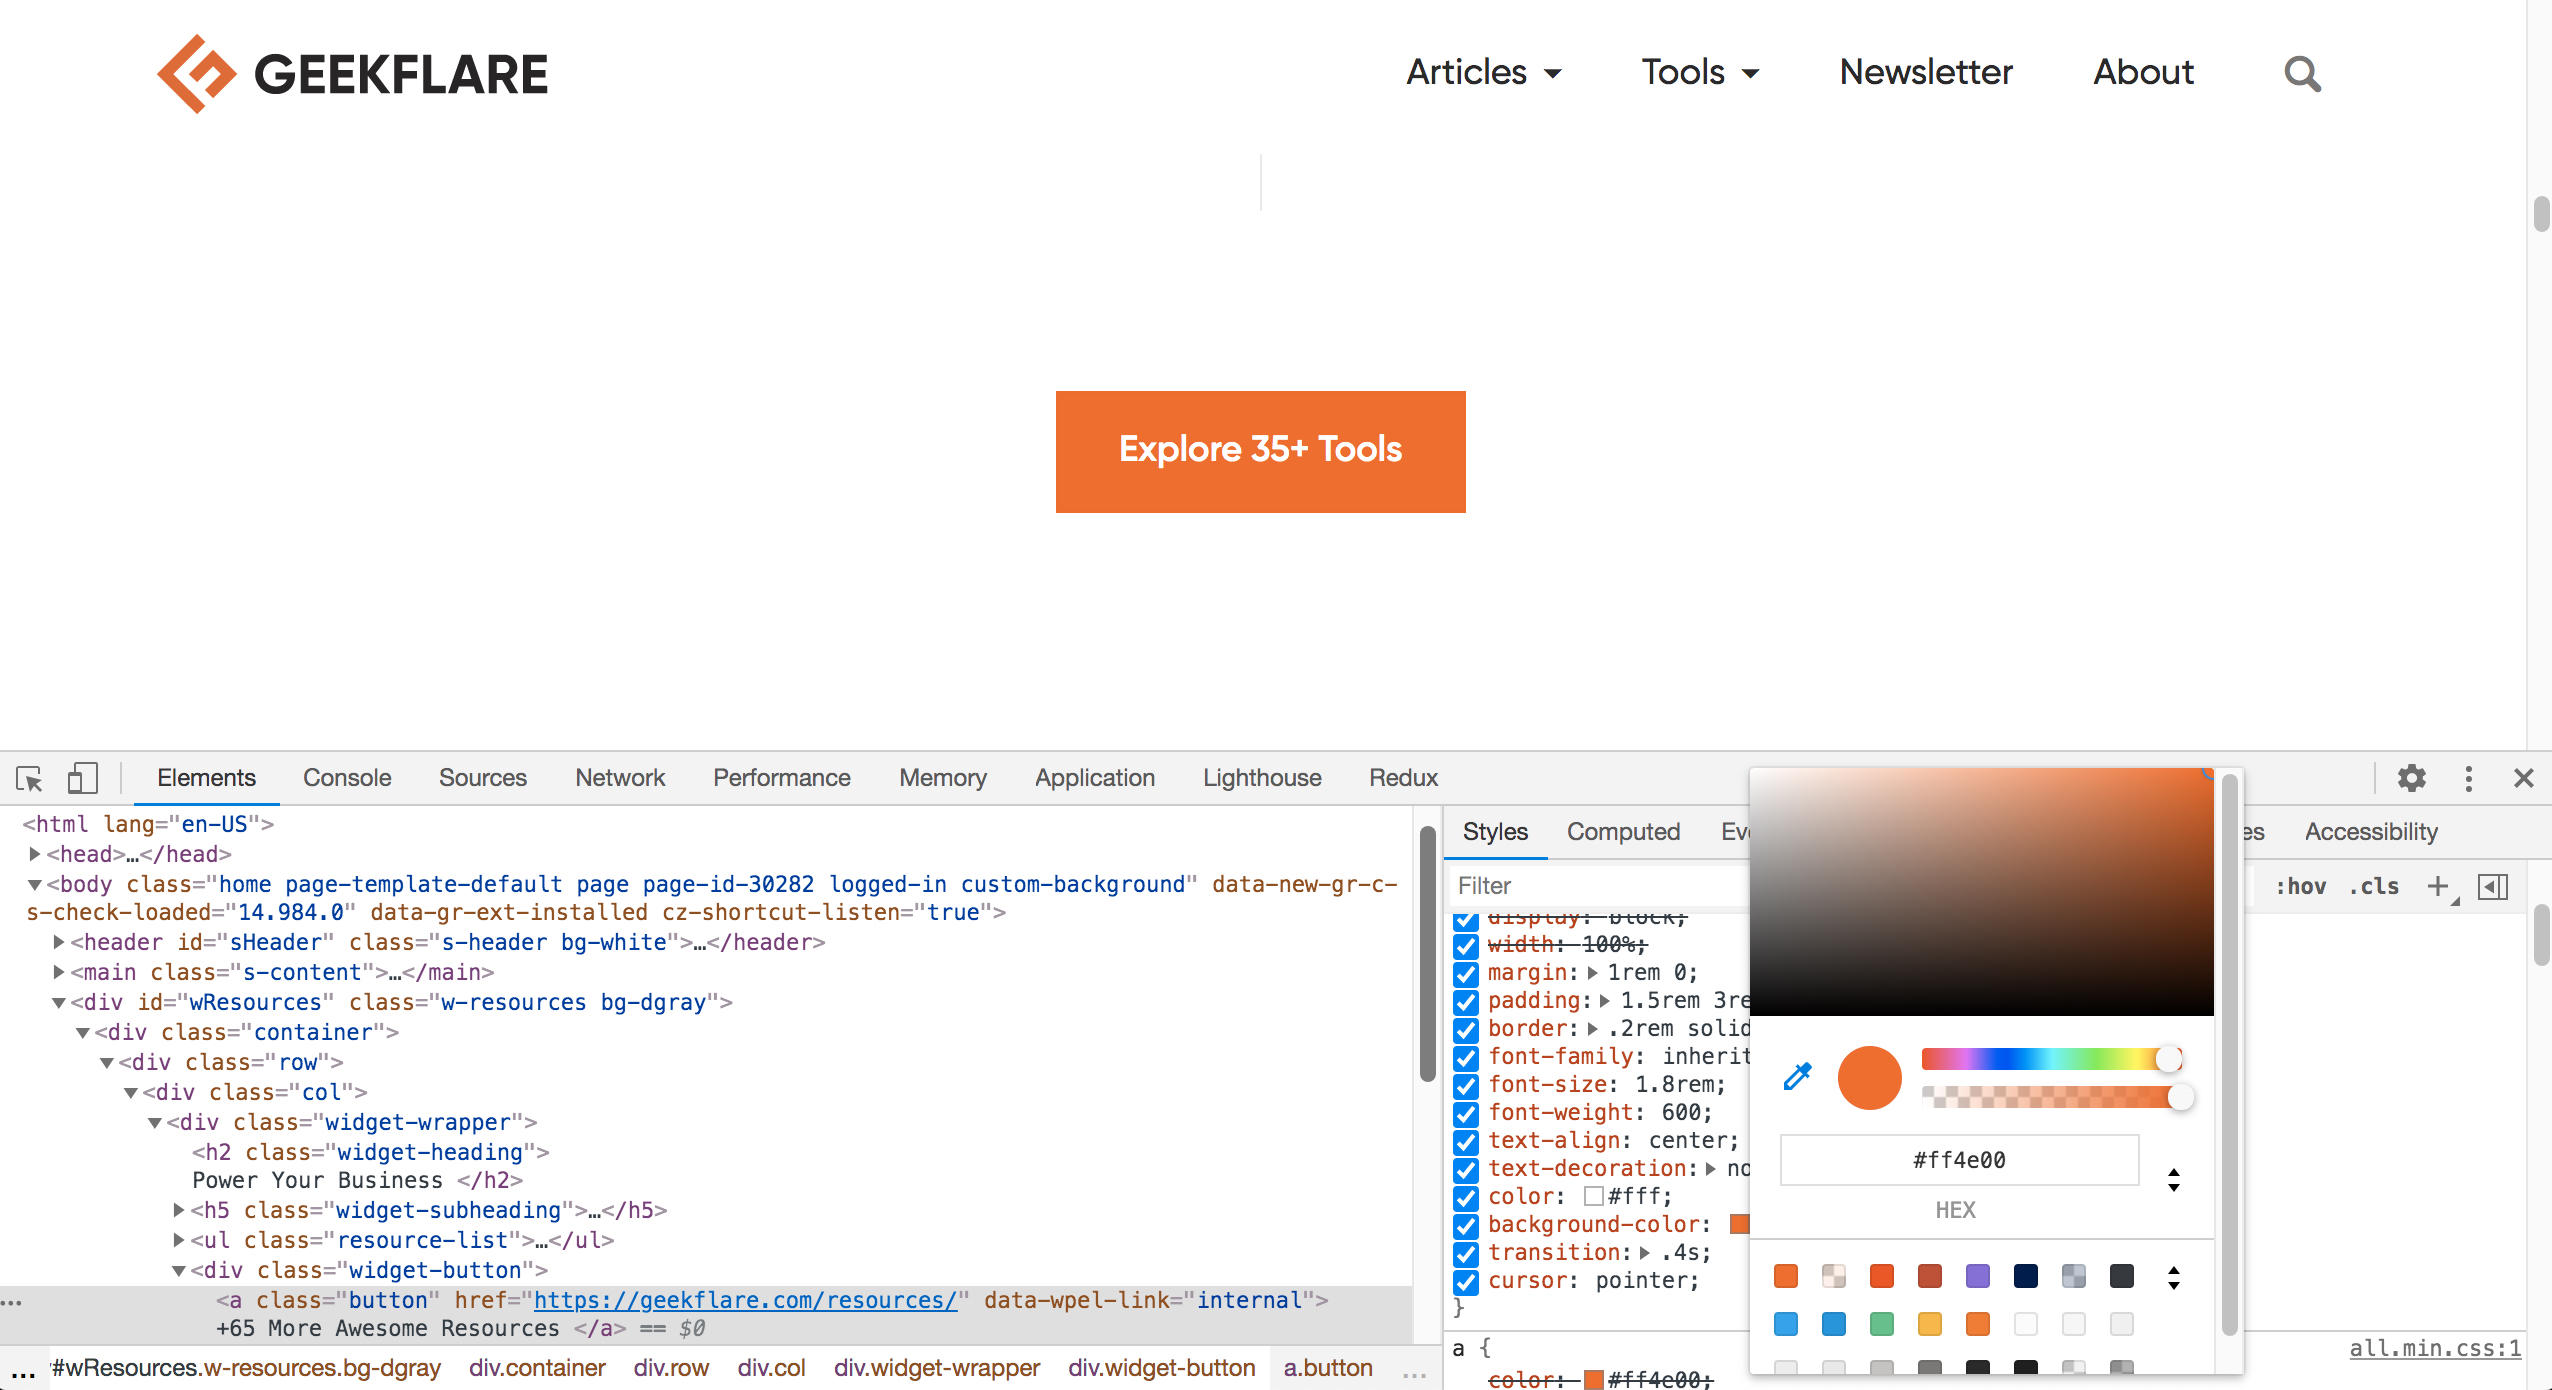
Notice that it’s not a bare-bones, basic color picker. It lets you control transparency, change color systems being used, pick a color directly from the page, and much more.
So, the next time you’re experimenting with a site’s accent colors, for example, you don’t need to work out or guess at the right value for the shade you have in mind! In fact, many people like to design websites directly in the browser; for them, features like these are a godsend! 🙂
Monitoring events on-page elements
We often are in a situation where we wish we knew what was going on with that one specific element we’re interested in. This is especially true when using jQuery in a non-trivial code-base — whether yours or others’; event handlers and logic are spread all over the place, and tracking down a bug can be a nightmare.
Thankfully, Chrome DevTools has a nifty feature for just this. It will observe the indicated element for you and log the events to the console. But there’s a bit of a letdown: this feature doesn’t have element selection capabilities based on CSS class names. So, the jQuery way of $("#email") isn’t available. 🙂
With that said, let’s see how to make it work. We begin by doing a simple “inspect element” using the DevTools inspector. Yes, it’s the very same inspection tool we use every day.
In the screenshot below, I’ve used the inspector tool to highlight the text input. By “highlight” I don’t mean that the element on the page is highlighted (it’s not, as you can see); rather, the inspector cursor was clicked on the text input, and the corresponding HTML code in the DevTools is highlighted.
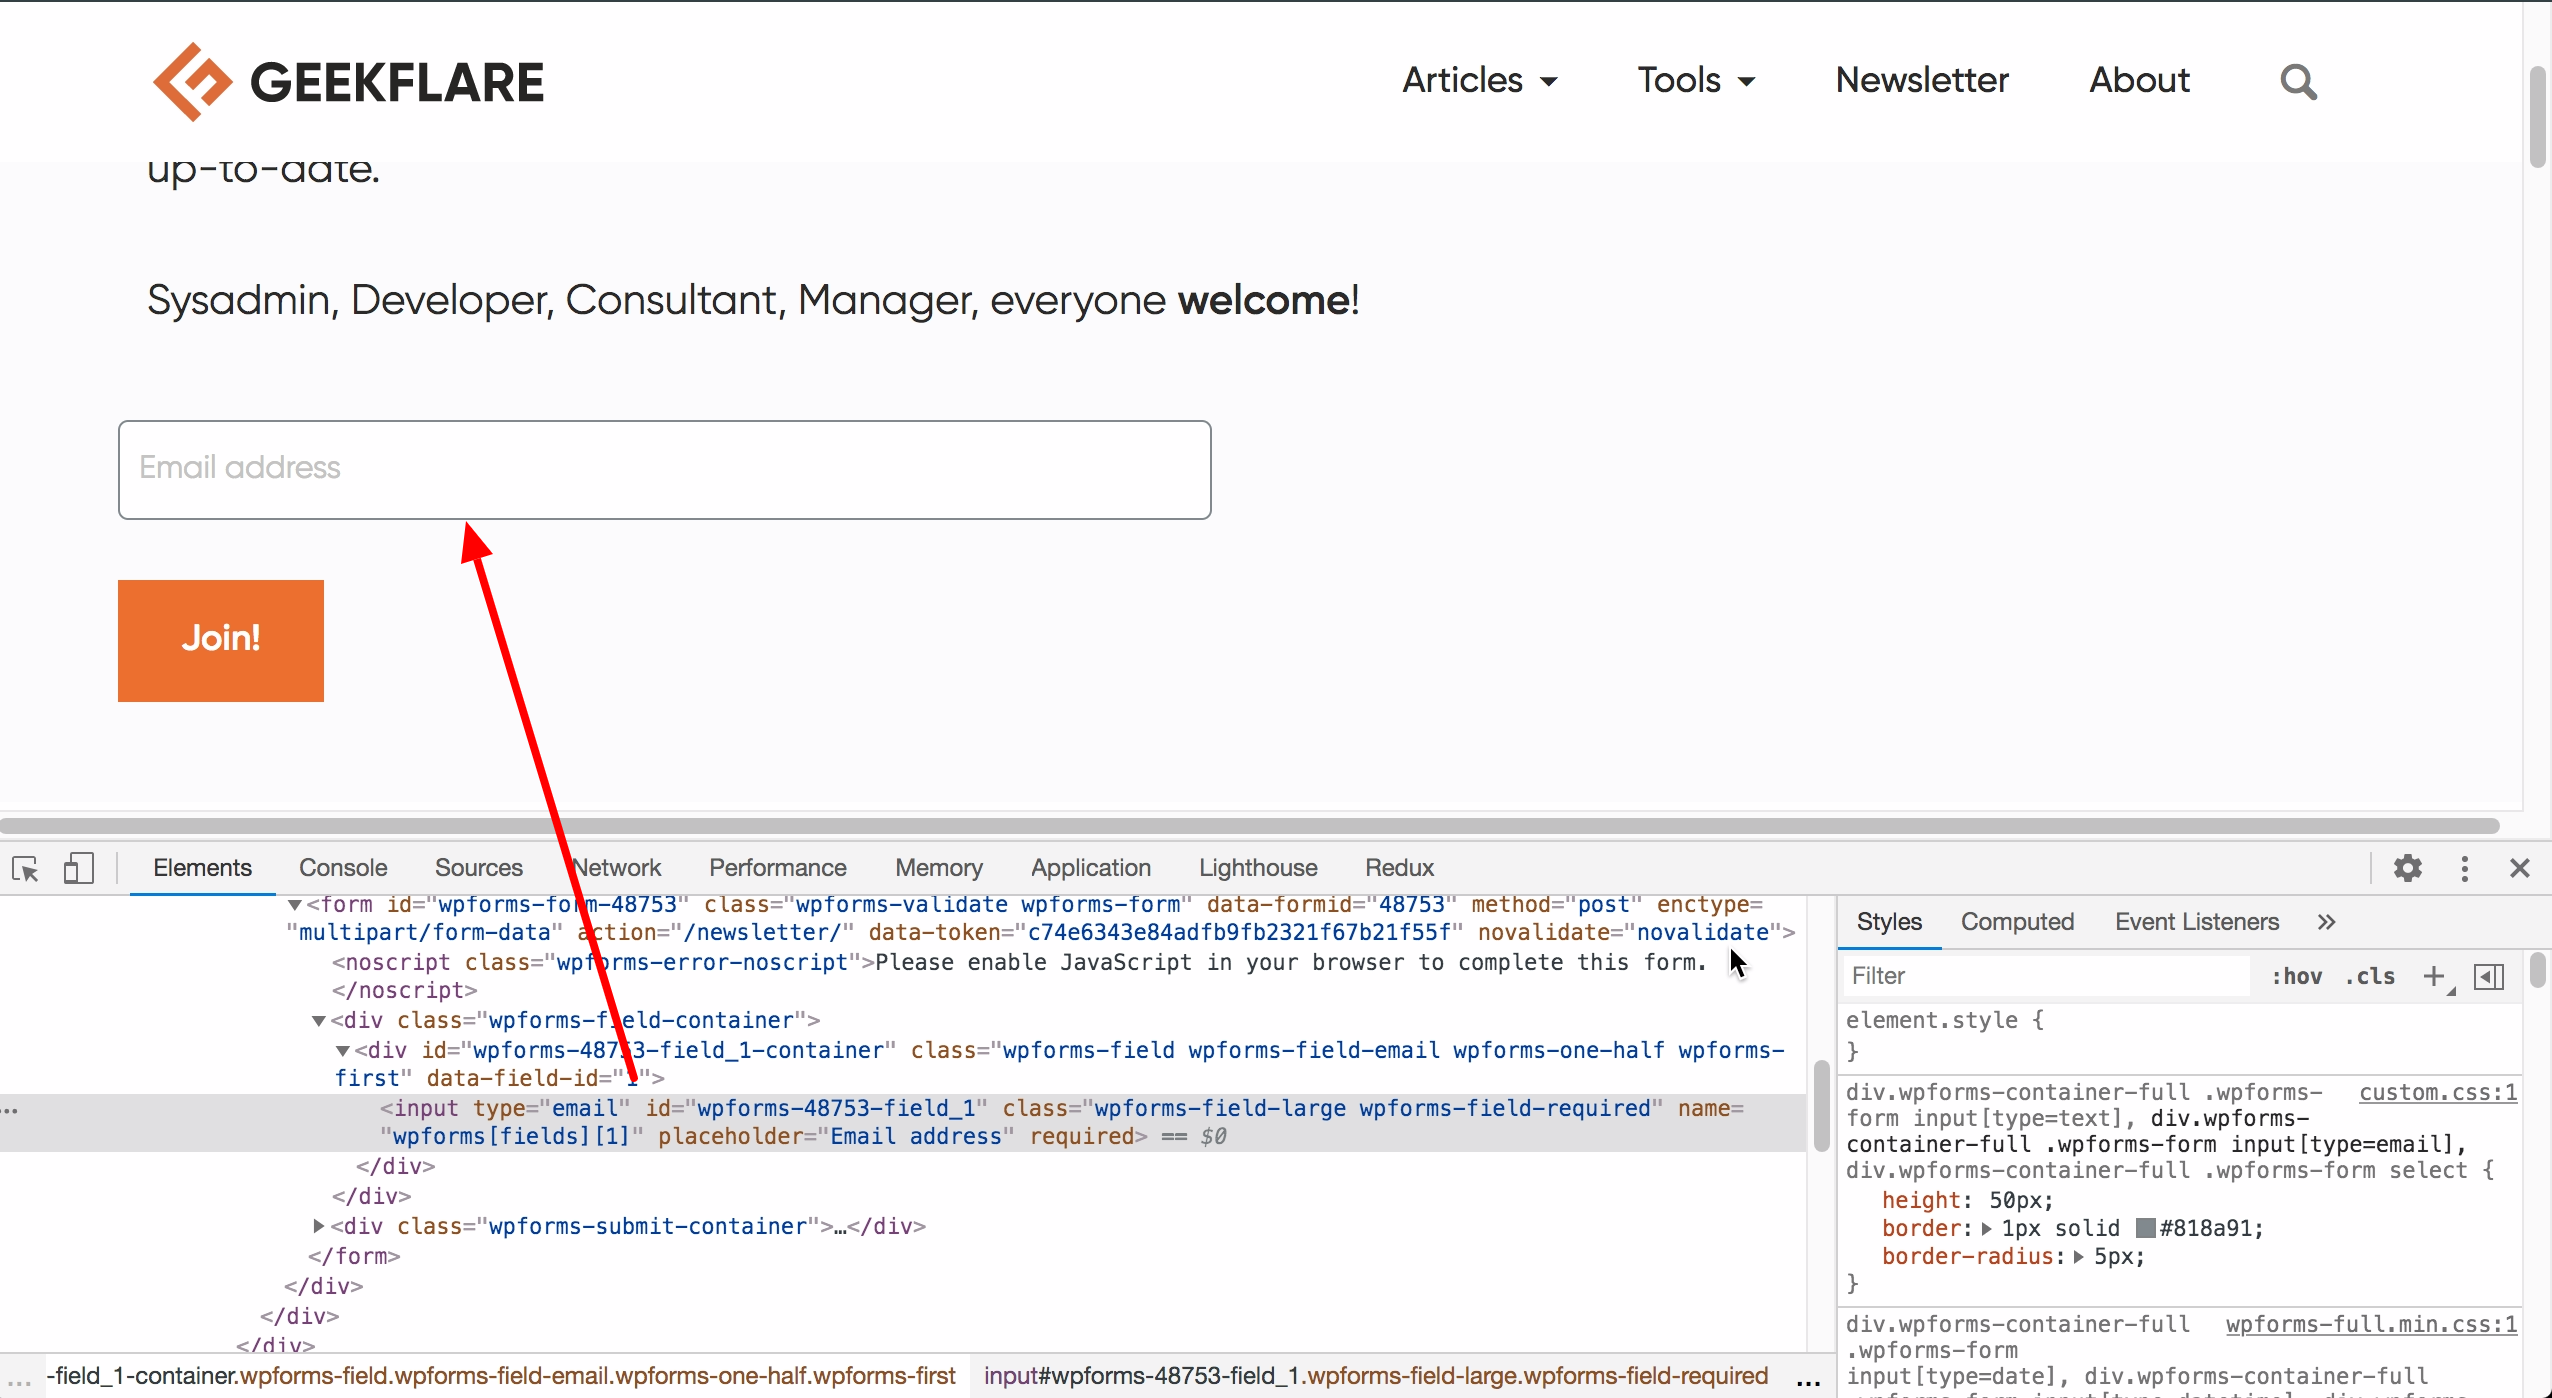
Doing this targets the currently inspected element for event monitoring, which makes the element accessible as a special JavaScript variable called $0. Next, making sure I don’t click elsewhere on the browser window carelessly (especially the HTML code part), I click on the Console and attach an event listener for this text input. For this, all I need is a single line of code: monitorEvents($0, 'mouse'). The “mouse” part here tells Chrome that I’m only interested in watching for mouse-based events.
As soon as I hit Enter/Return, monitoring is activated, and if I now hover over or click on the text input, those events are logged to the console as JavaScript objects:
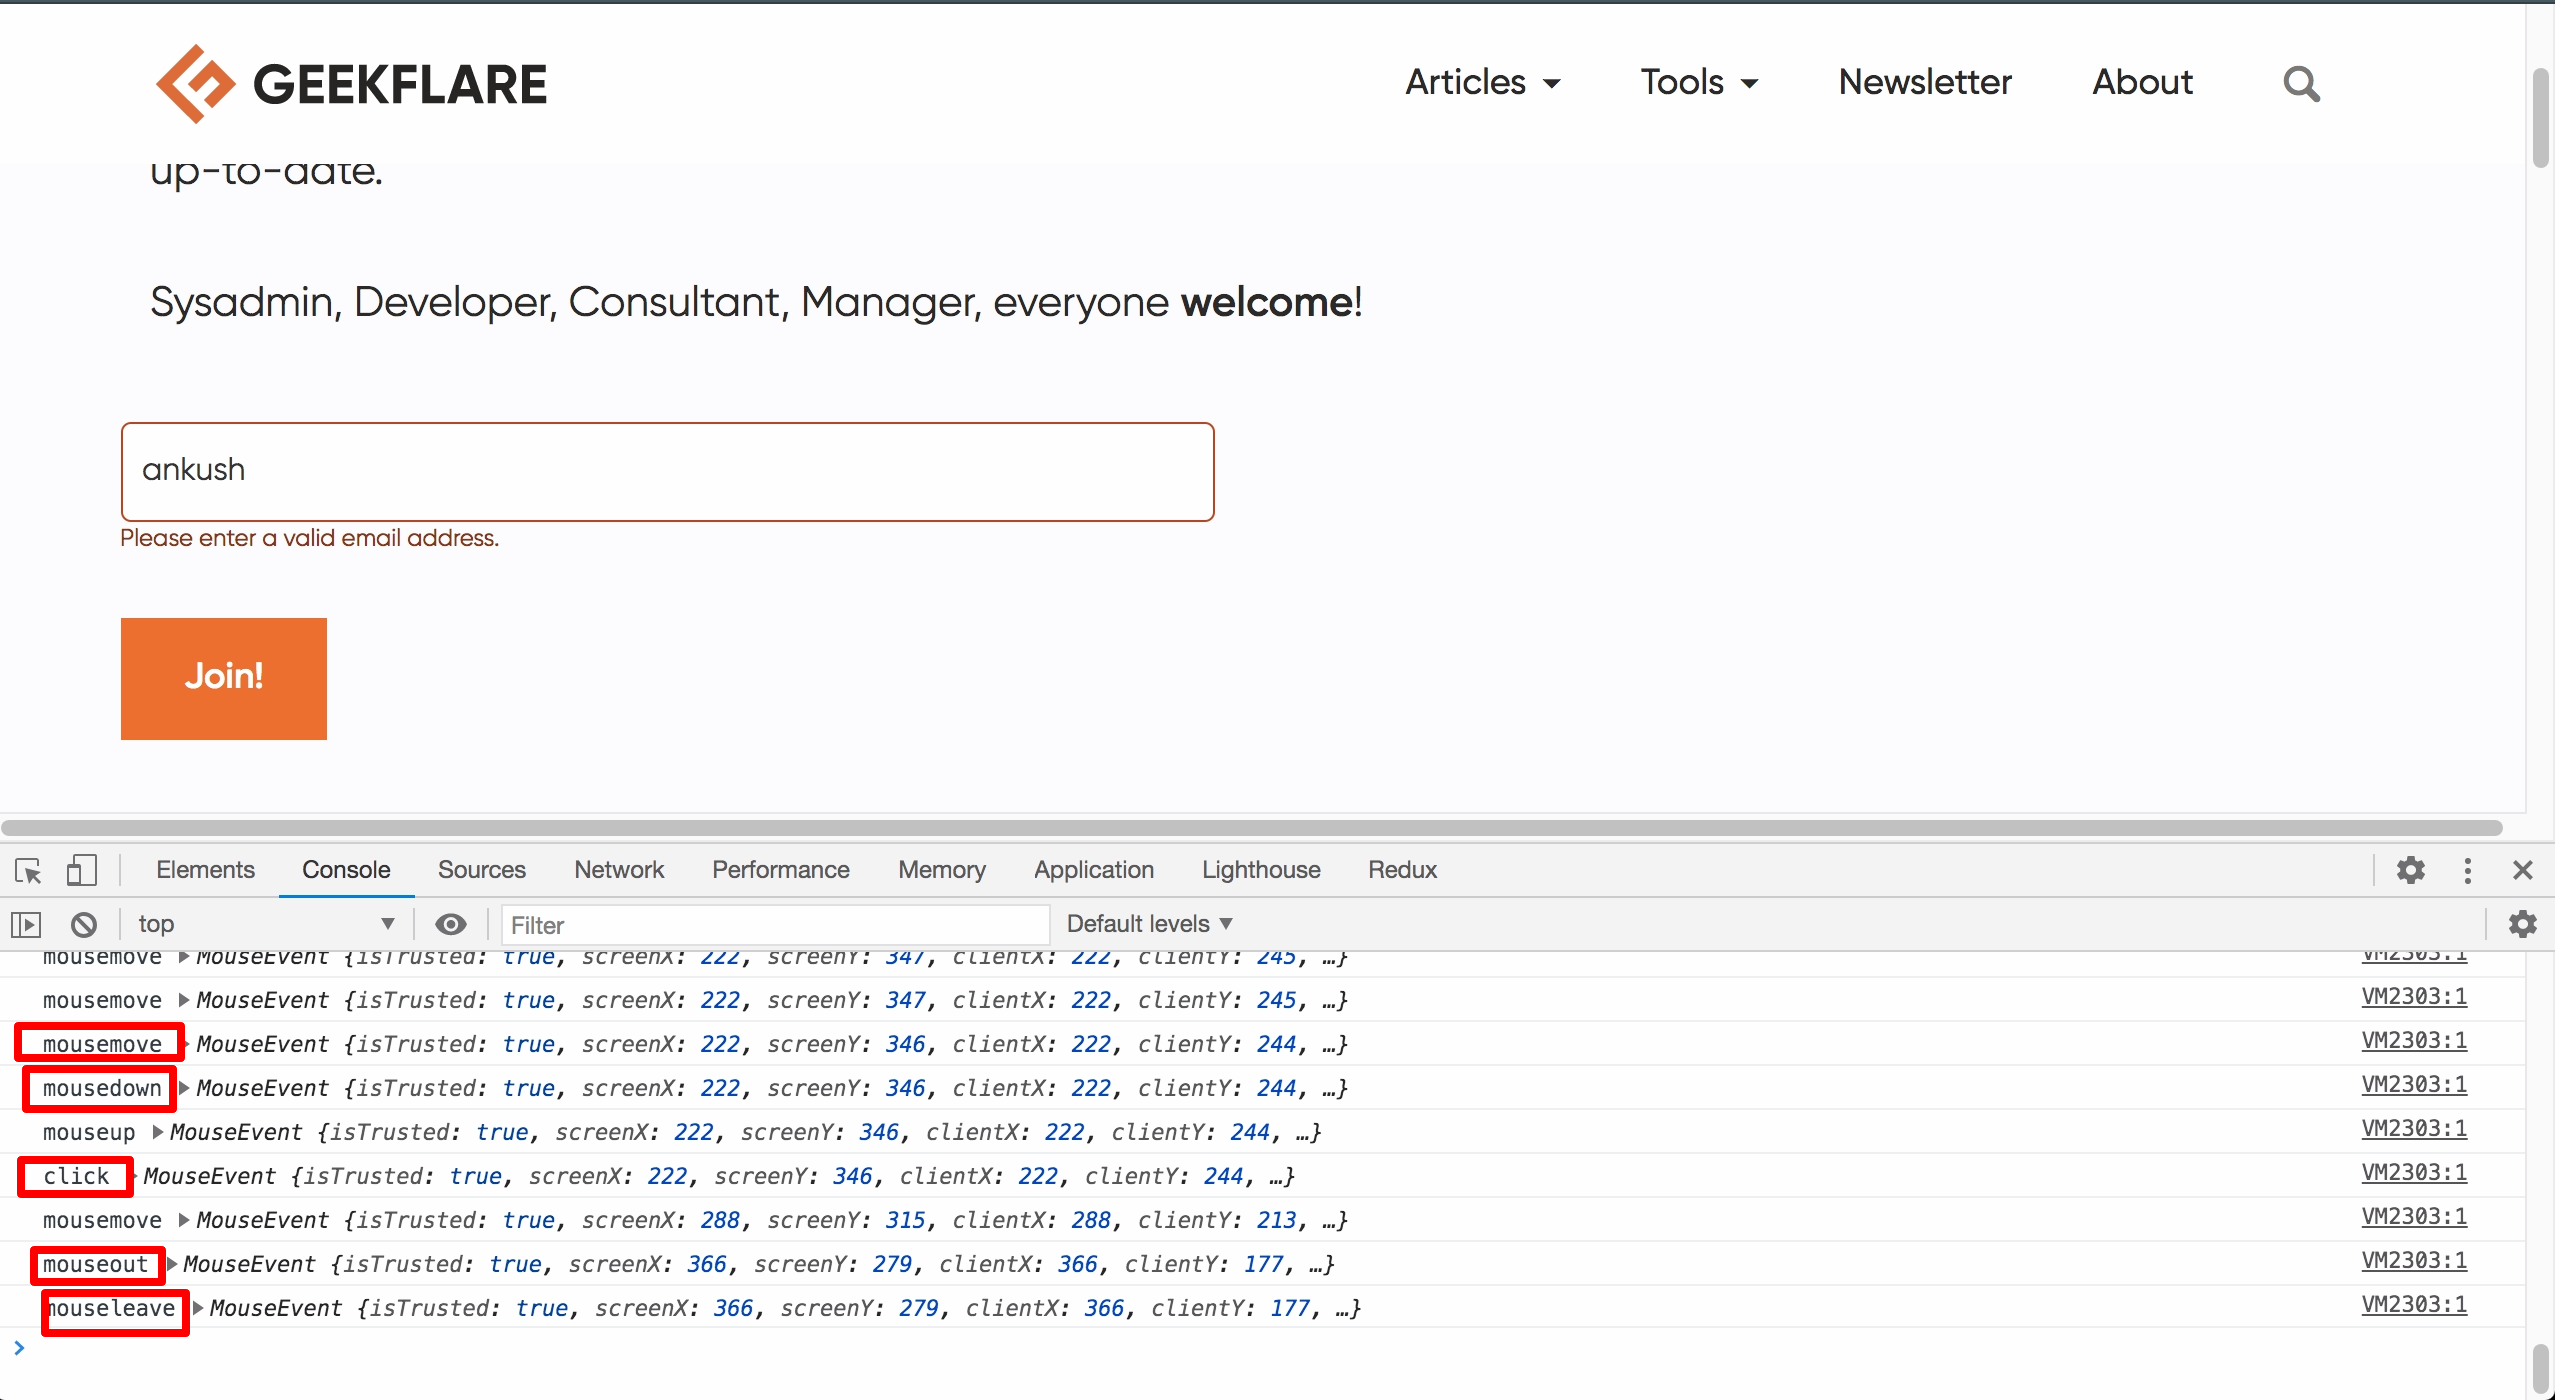
As you can see in the screenshot, several types of mouse events were captured as I clicked on the element, typed my name, and then moved the mouse away (the typing events, being keyboard events, were not logged). The events are JavaScript objects themselves, as is clear from the screenshot; each event object contains a tremendous amount of information. For instance, I expanded the “click” event object, and the number of properties couldn’t fit all in a single screenshot!
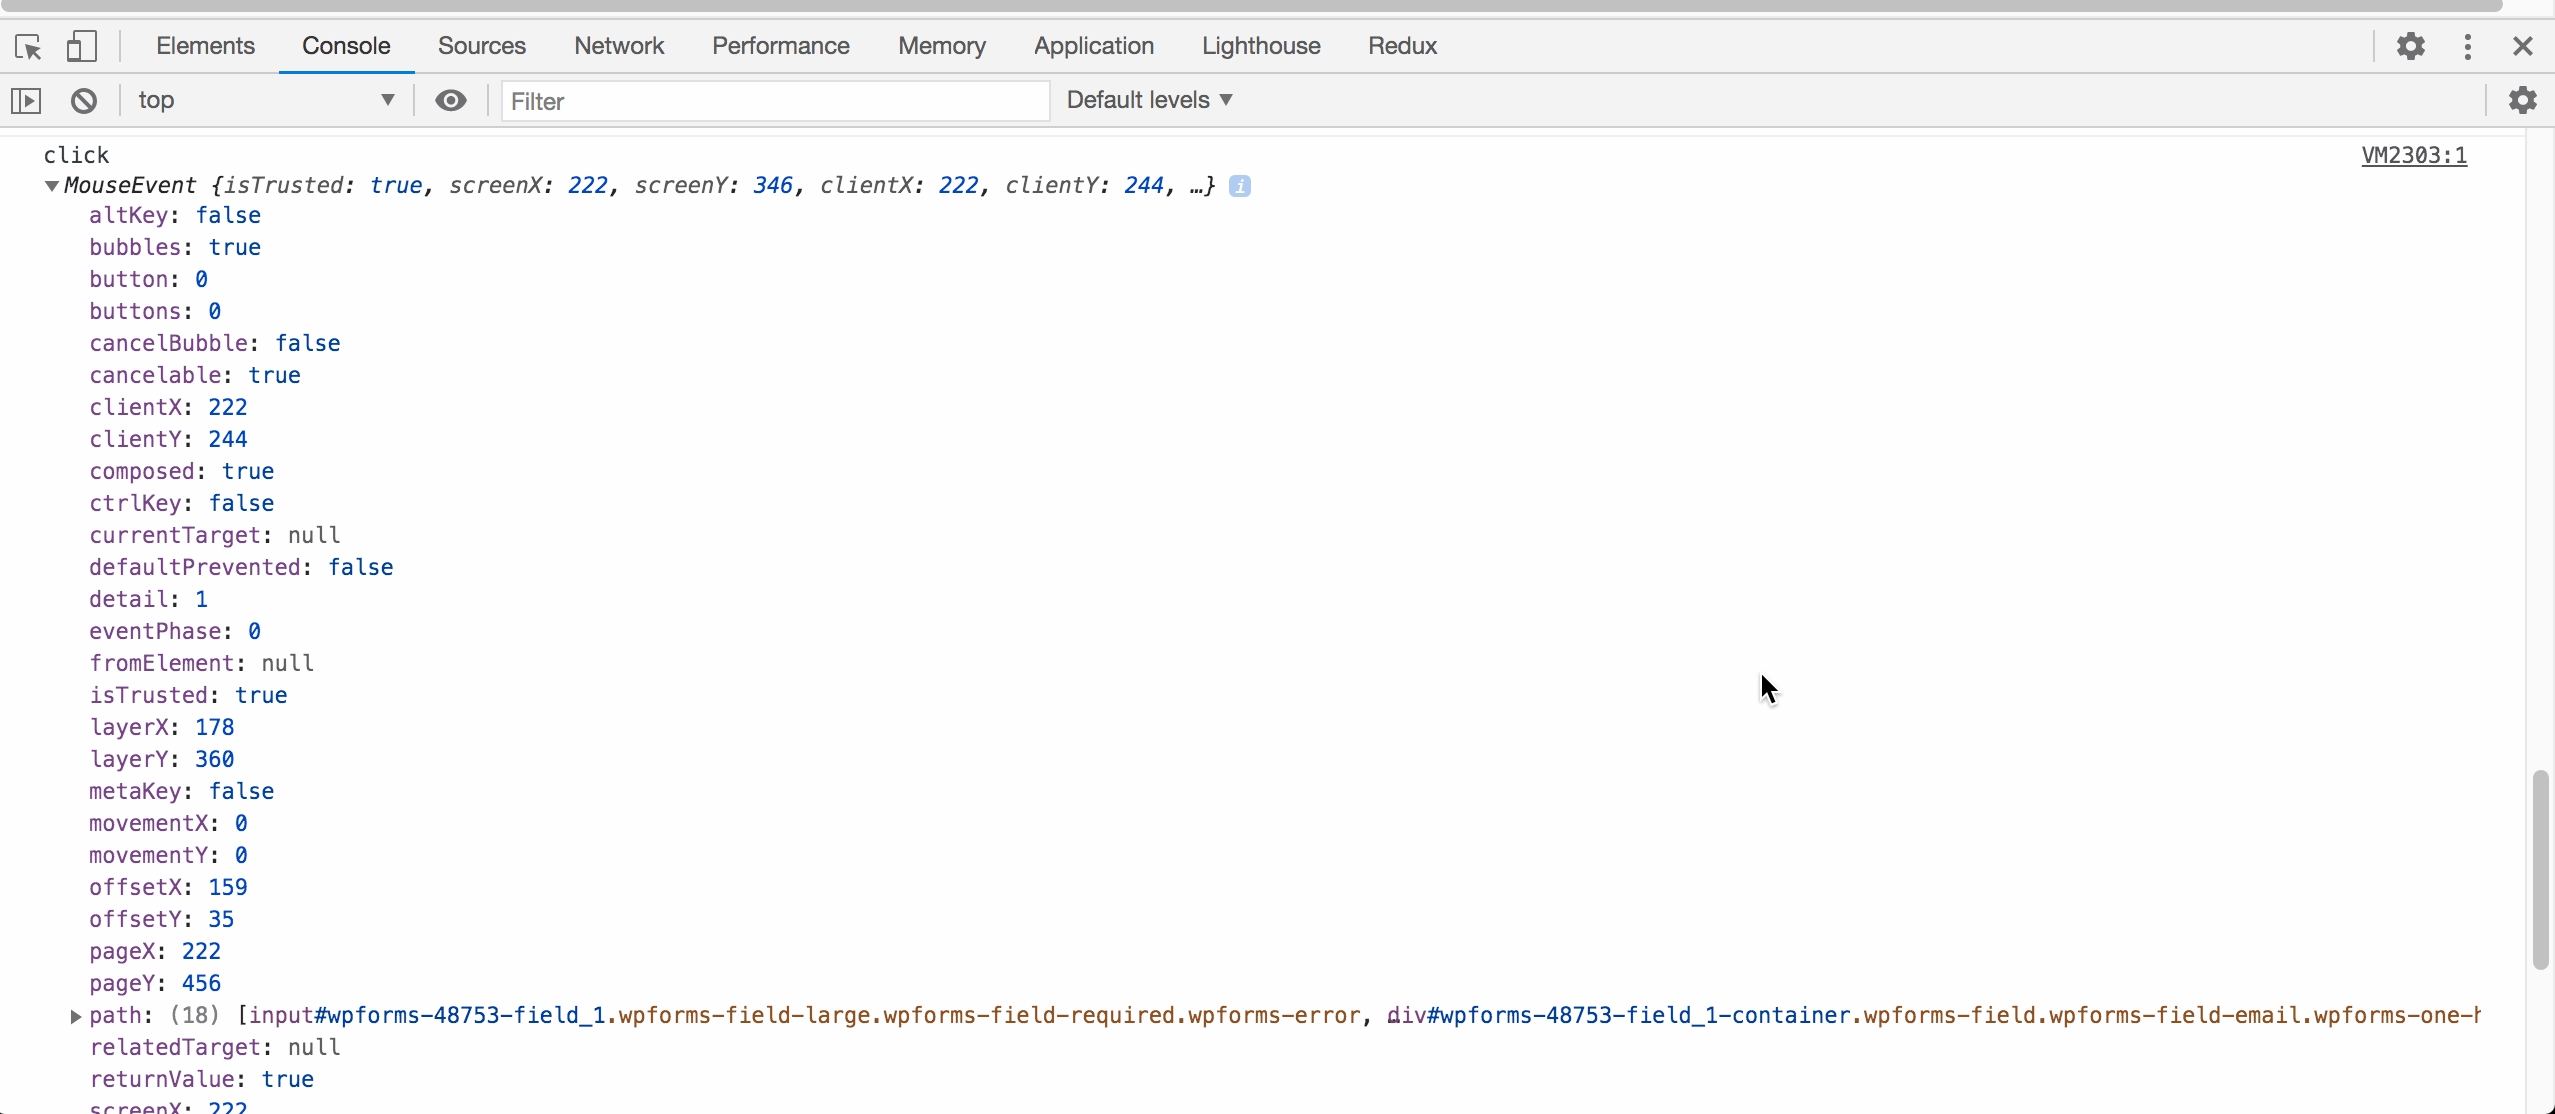
I highly encourage you to try out this feature right away since it’s sure to save you lots of headaches in your upcoming projects!
Website performance reports
These days, website performance makes or breaks a business/website. Even a small increase in performance translates to massive SEO gains as well as user satisfaction. But how do you know which parts of your website need attention and which ones are good already?
Do you need to hire a team of experts and wait patiently for a few days?
Well, there are cases where that needs to be done, but thankfully, Chrome DevTools has the rest of us covered. In the latest versions of Chrome (late 2020), you’ll find a Lighthouse tab in the DevTools. A few months back, it was called Audits, and confusingly enough, that’s the name you’ll find in the official docs as of writing. Anyway, the point is that Lighthouse used to be a trendy website for checking website performance for free, but then Google took it down (no reasons were given). Thankfully, the same powerful functionality later resurfaced in DevTools.
To generate a performance report, all you need to do is hit a single button after the page you’re interested in has loaded:
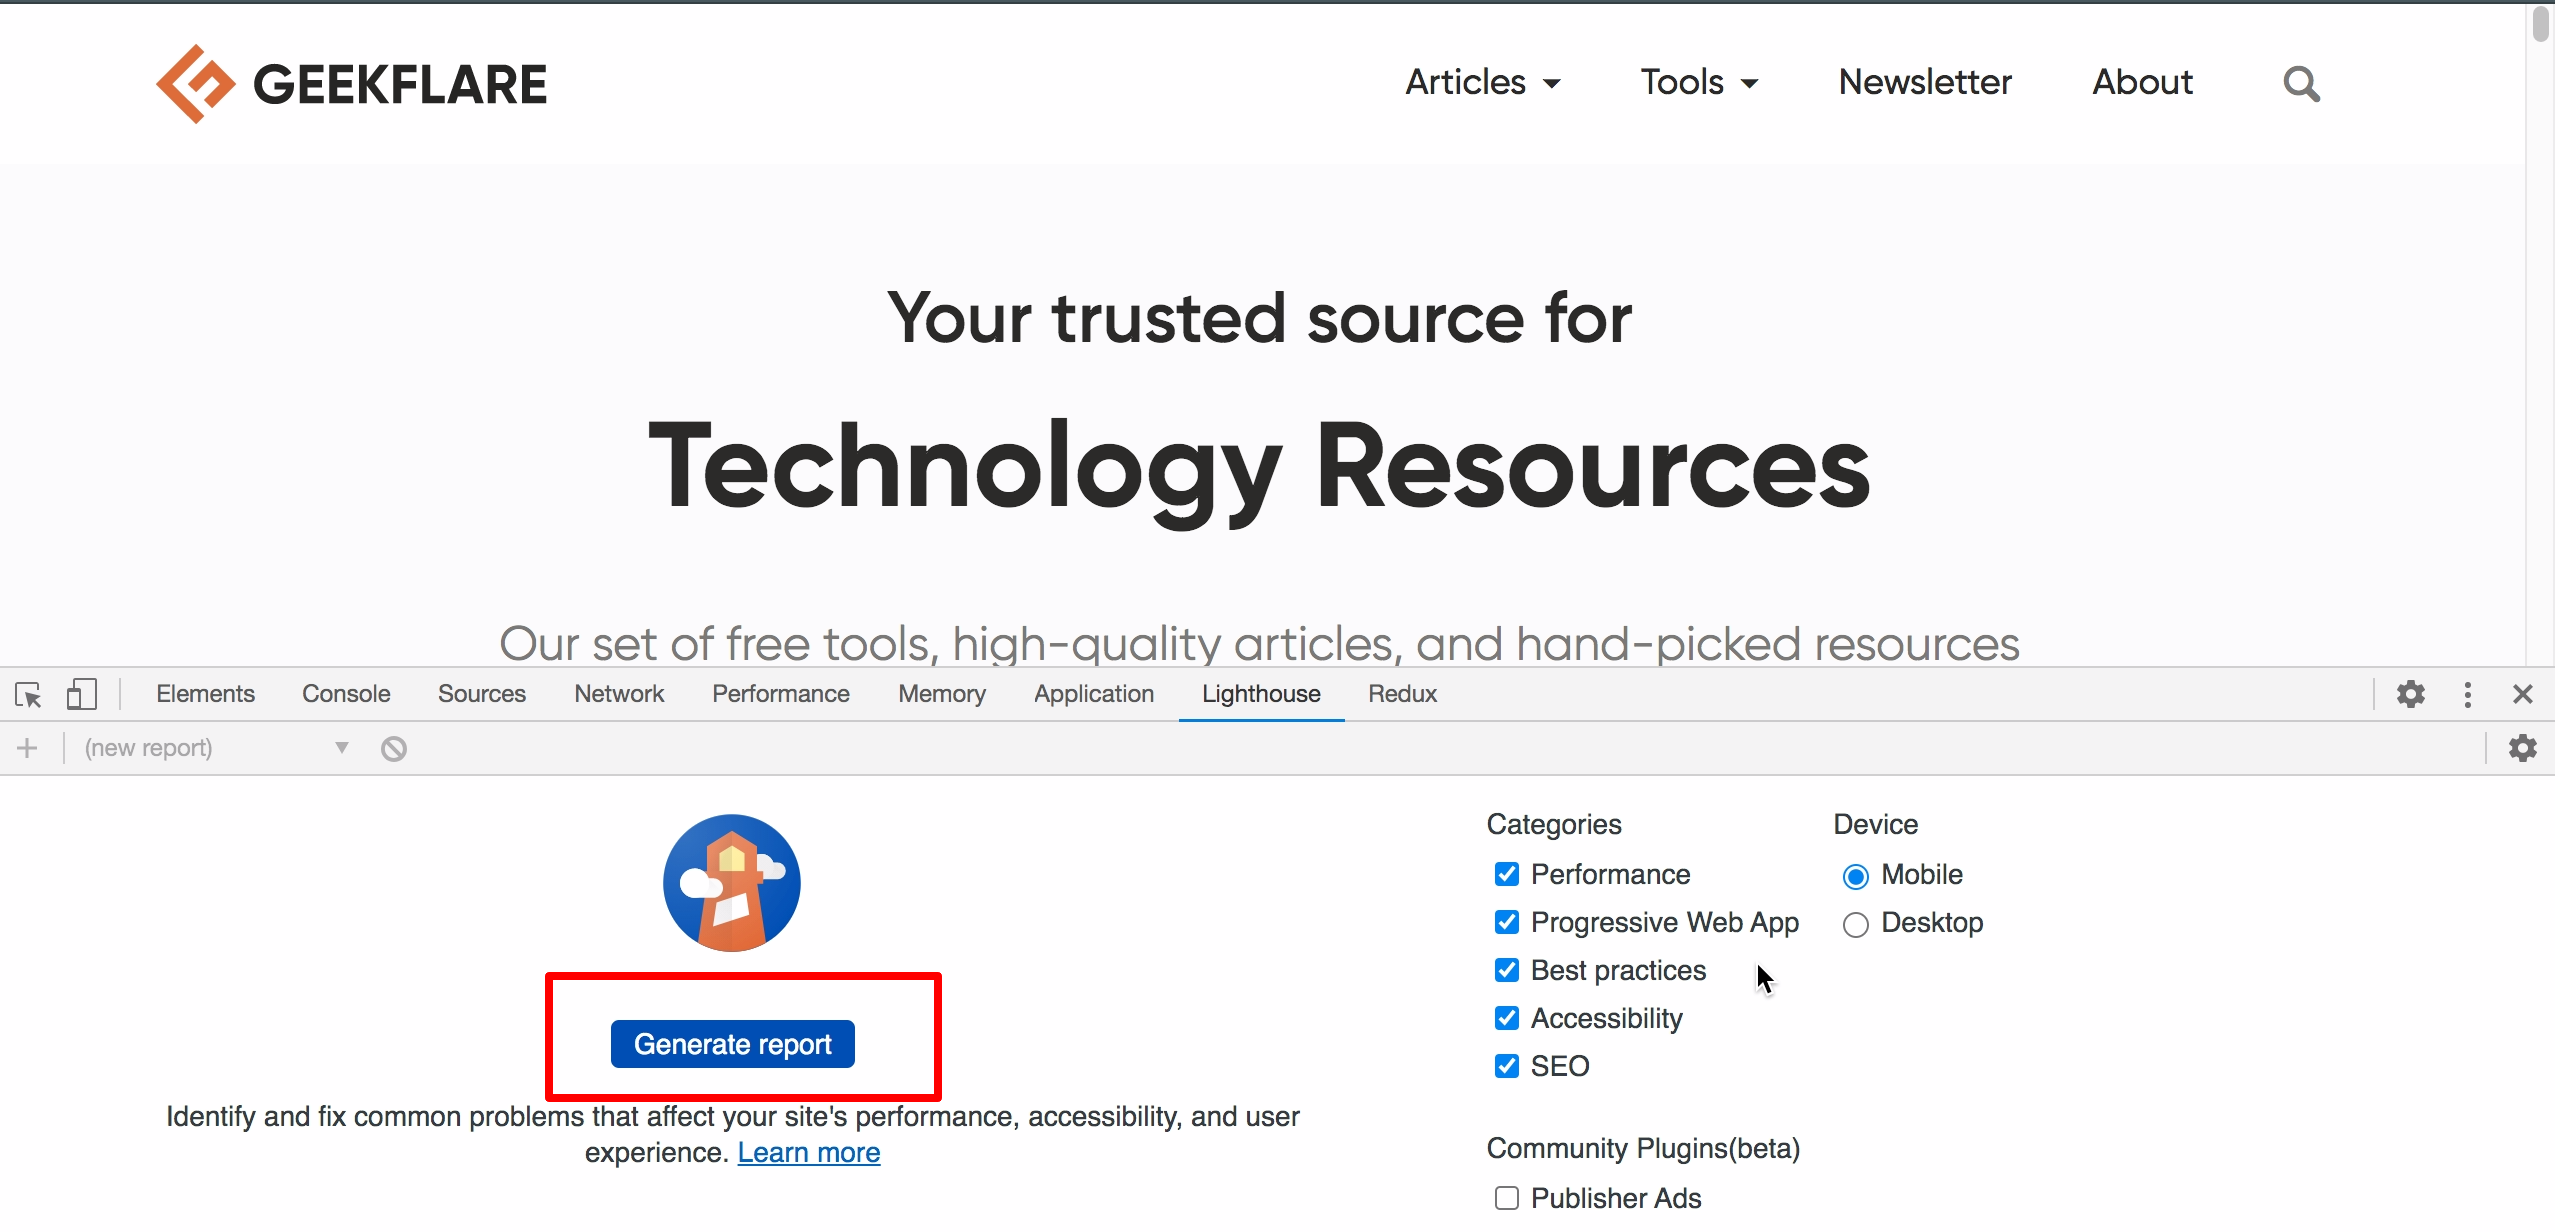
As you can see on the right side in the screenshot, there are a few options to control how much information you want (and, of course, what you want to test for). Once you’re happy with the settings, hit that big blue button, sit back, and relax. A few seconds later, you’ll have a beneficial report looking something like this:
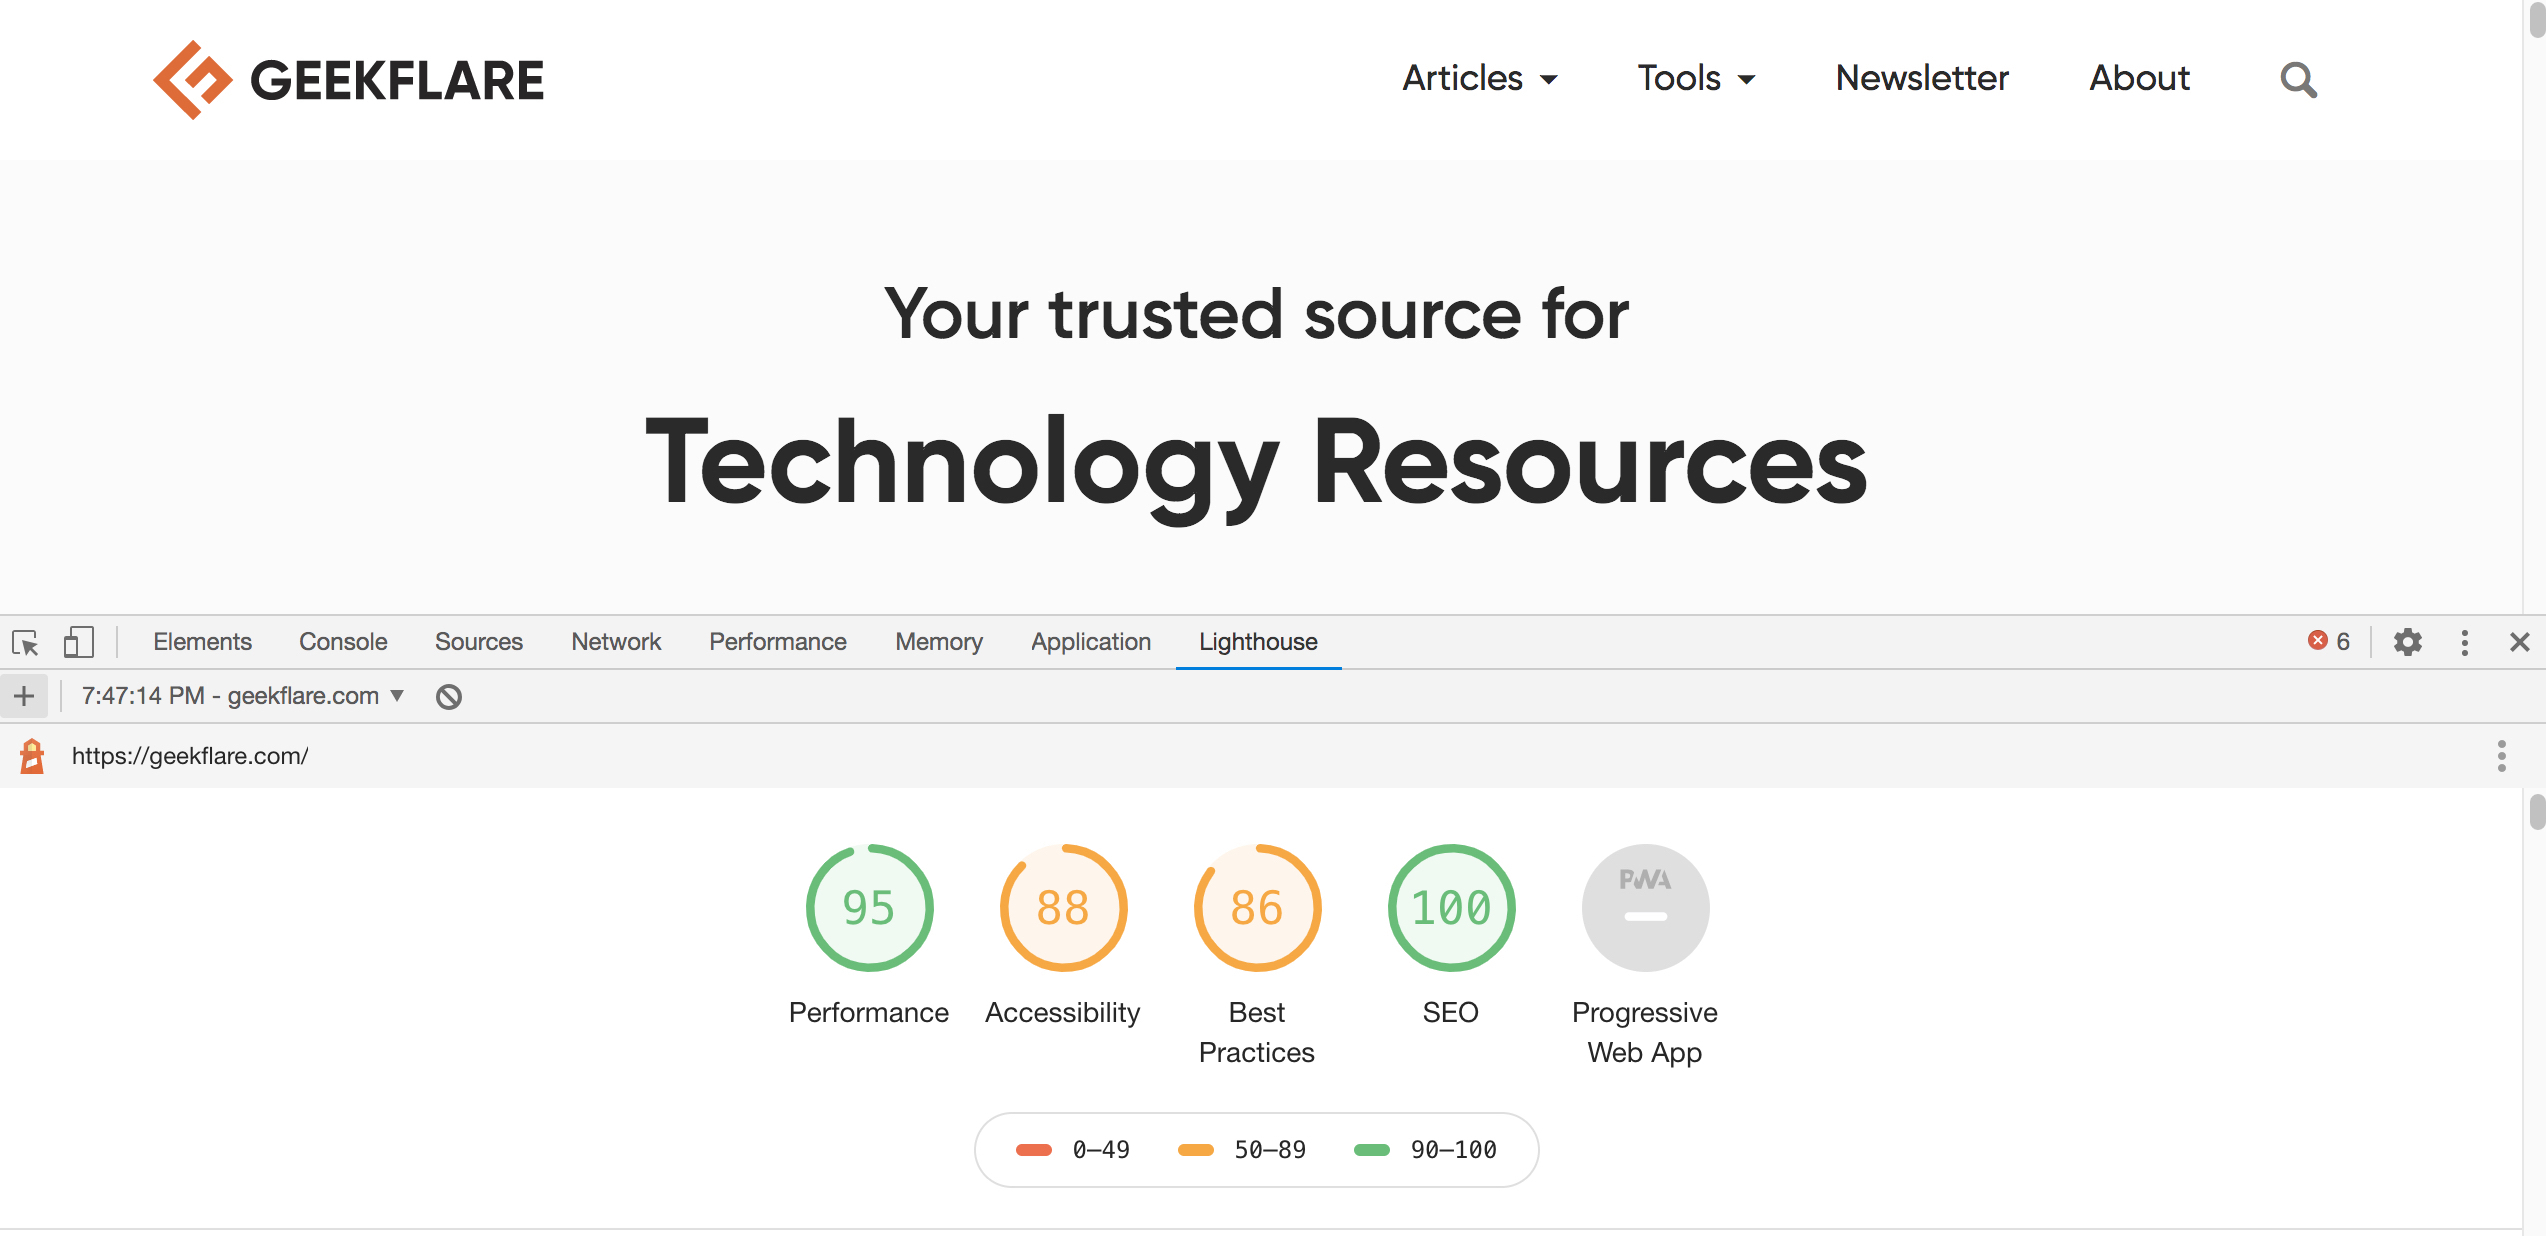
The numbers you see in the above screenshot show the overall score for each category. The category for Progressive Web Apps (PWAs) is greyed out, likely because this website has no PWA capabilities. Also, as you can tell by the scroll bar size in the screenshot (to the very right), it’s a long report.
Here’s what a part of the section on performance looks like:
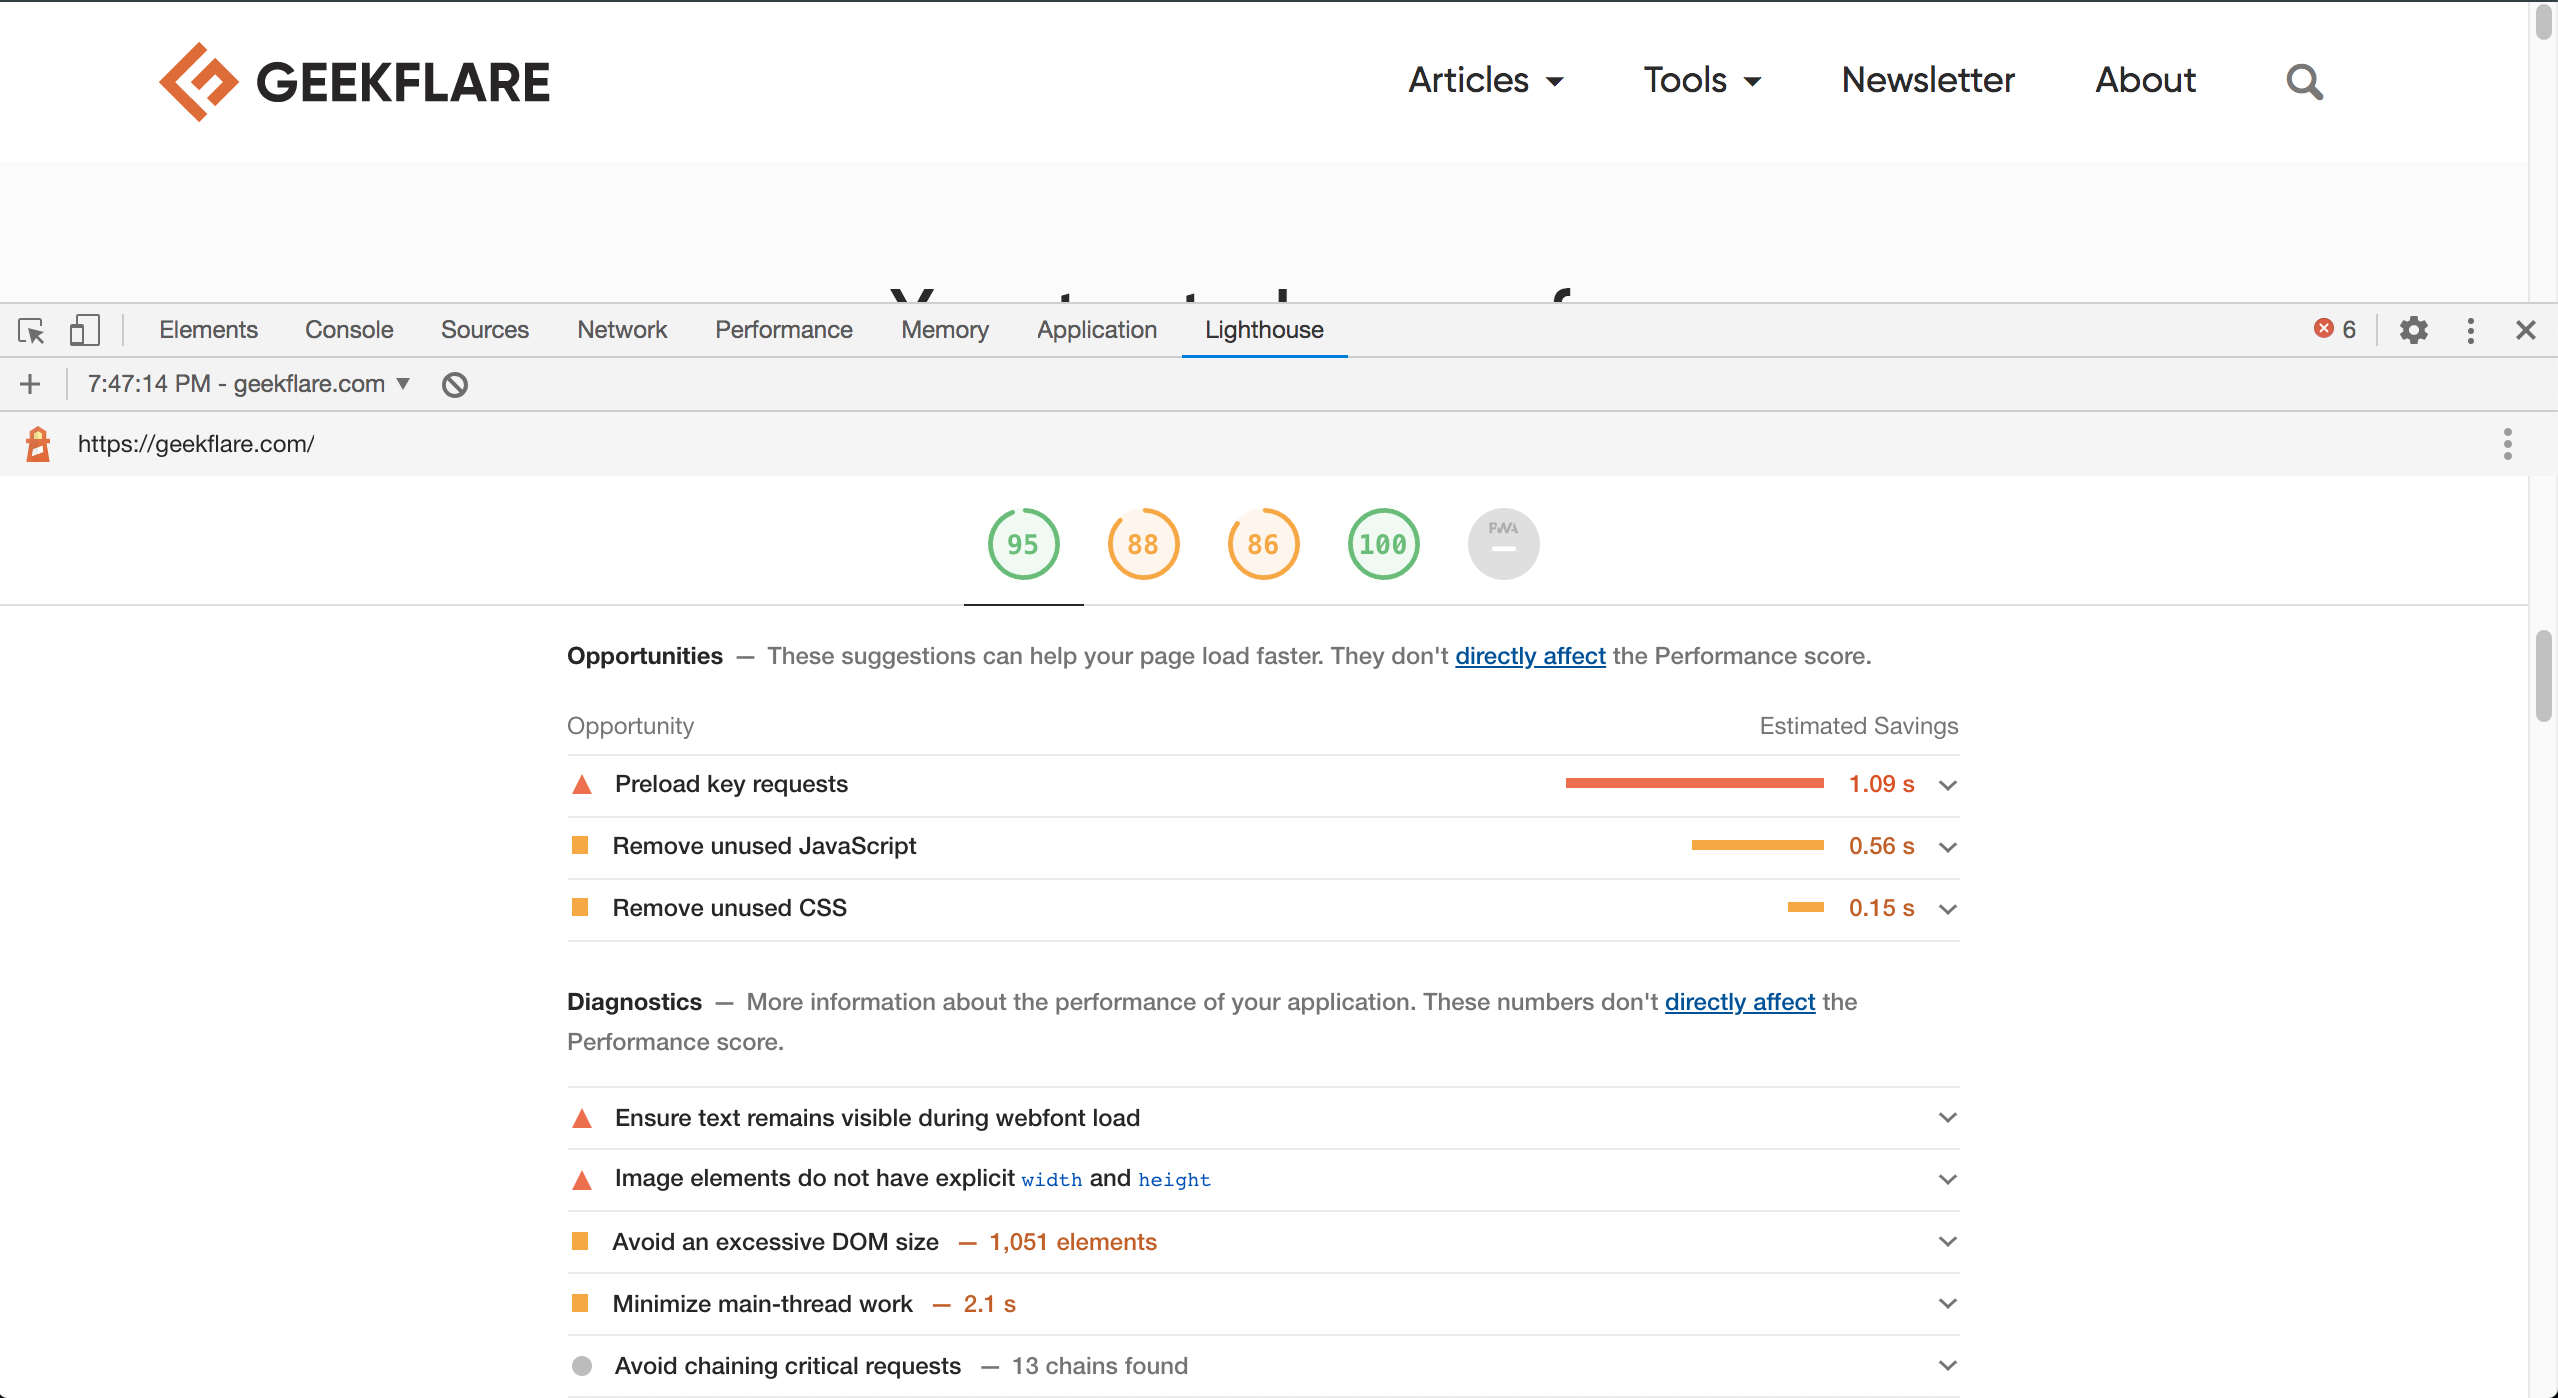
I won’t claim that Lighthouse and its suggestions are the holy grail of website performance, but these are extremely helpful; that’s because website owners and developers rarely have a clue about what issues exist and how exactly to address them.
Honestly, even I feel lost as a web developer, as performance and testing tend to be specializations of sorts. As such, Lighthouse is a little-known, under-appreciated tool, now part of the Chrome DevTools, that is of immense use for business owners and developers/sysadmins alike.
Code-editing prowess
The Sources tab in DevTools lets us access various files loaded by the website. It also has capabilities like code editing, saving snippets, etc. This much should come as no surprise to web developers. However, DevTools also has a few conveniences built-in that make life easier for developers used to their favorite code IDEs.
DevTools uses some well-known keyboard shortcuts that will save you time and minimize code-wrangling frustration. For example, Ctrl D (or Cmd D on Mac) can be used to highlight multiple occurrences of a word. Similarly, holding Ctrl (or Cmd on Mac) and clicking at multiple places in the code gives you multiple cursors. Have a look at the video below to get a better idea:
If you think this is cool, make sure to dive into the official docs to take advantage of all code-editing features the DevTools has to offer.
Control DOM element state
Sometimes we’re testing or debugging something, but the behavior we’re chasing is only available in a particular element state. Depending on what state it is, you might end up having a terrible time; for me, it’s the “hover” state, as I remember wasting countless minutes trying to time the hover action or tacking on additional, temporary CSS, etc.
Thankfully, Chrome DevTools has an easy way to change the state of an inspected element. What’s more, the option to do so is right there if we right-click the element (in the Elements tab), but given the number of features and the pressures of a day’s work, it’s easy to overlook this:
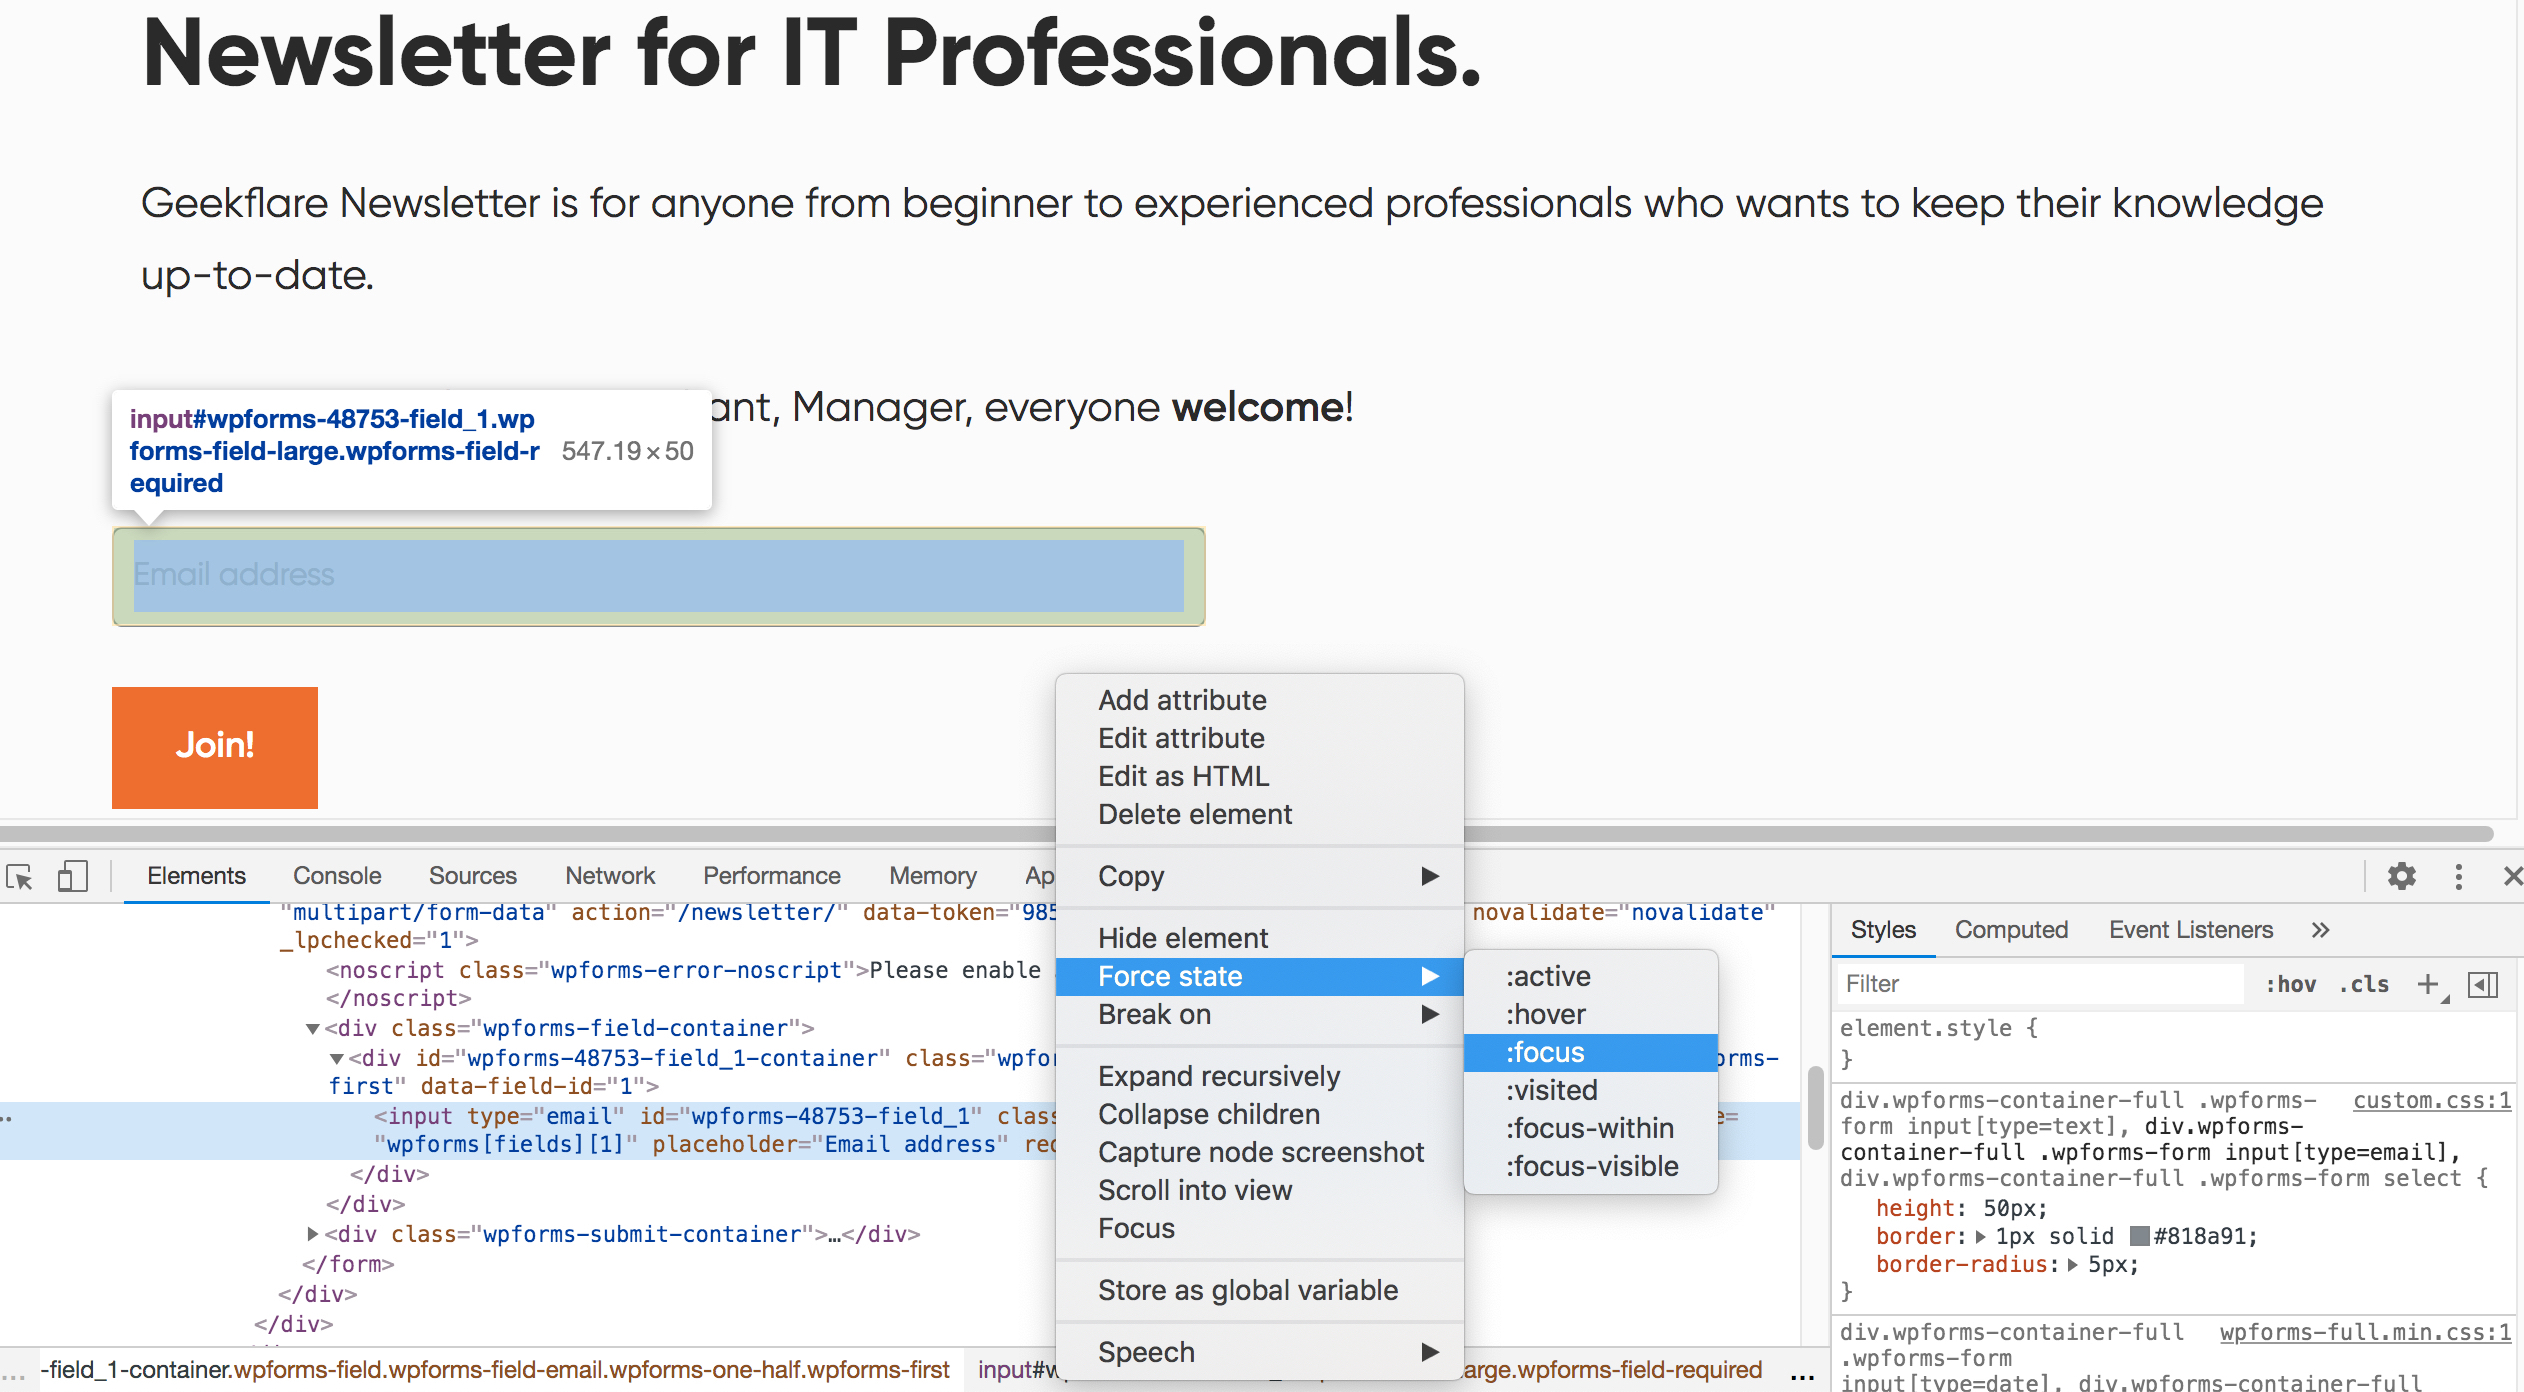
Yes, it’s really that simple!
Now, you don’t need to bake conditional testing logic into your code, write additional CSS or jump through some other hoops when observing an element in a different state.
Tools panel
Last but definitely not least on this list is the Tools panel. It’s another of those incredibly useful features that are well-hidden and can only be seen using keyboard shortcuts. As the name suggests, the Tools panel is not a single tool but a dashboard of sorts where almost all of DevTool’s functions are available. Since there are way too many functions offering the overall DevTools functionality, a search bar is available right at the top.
To activate the Tools panel, make sure you’re in the DevTools panel and then hit Ctrl Shift P (or Cmd Shift P for Mac users):
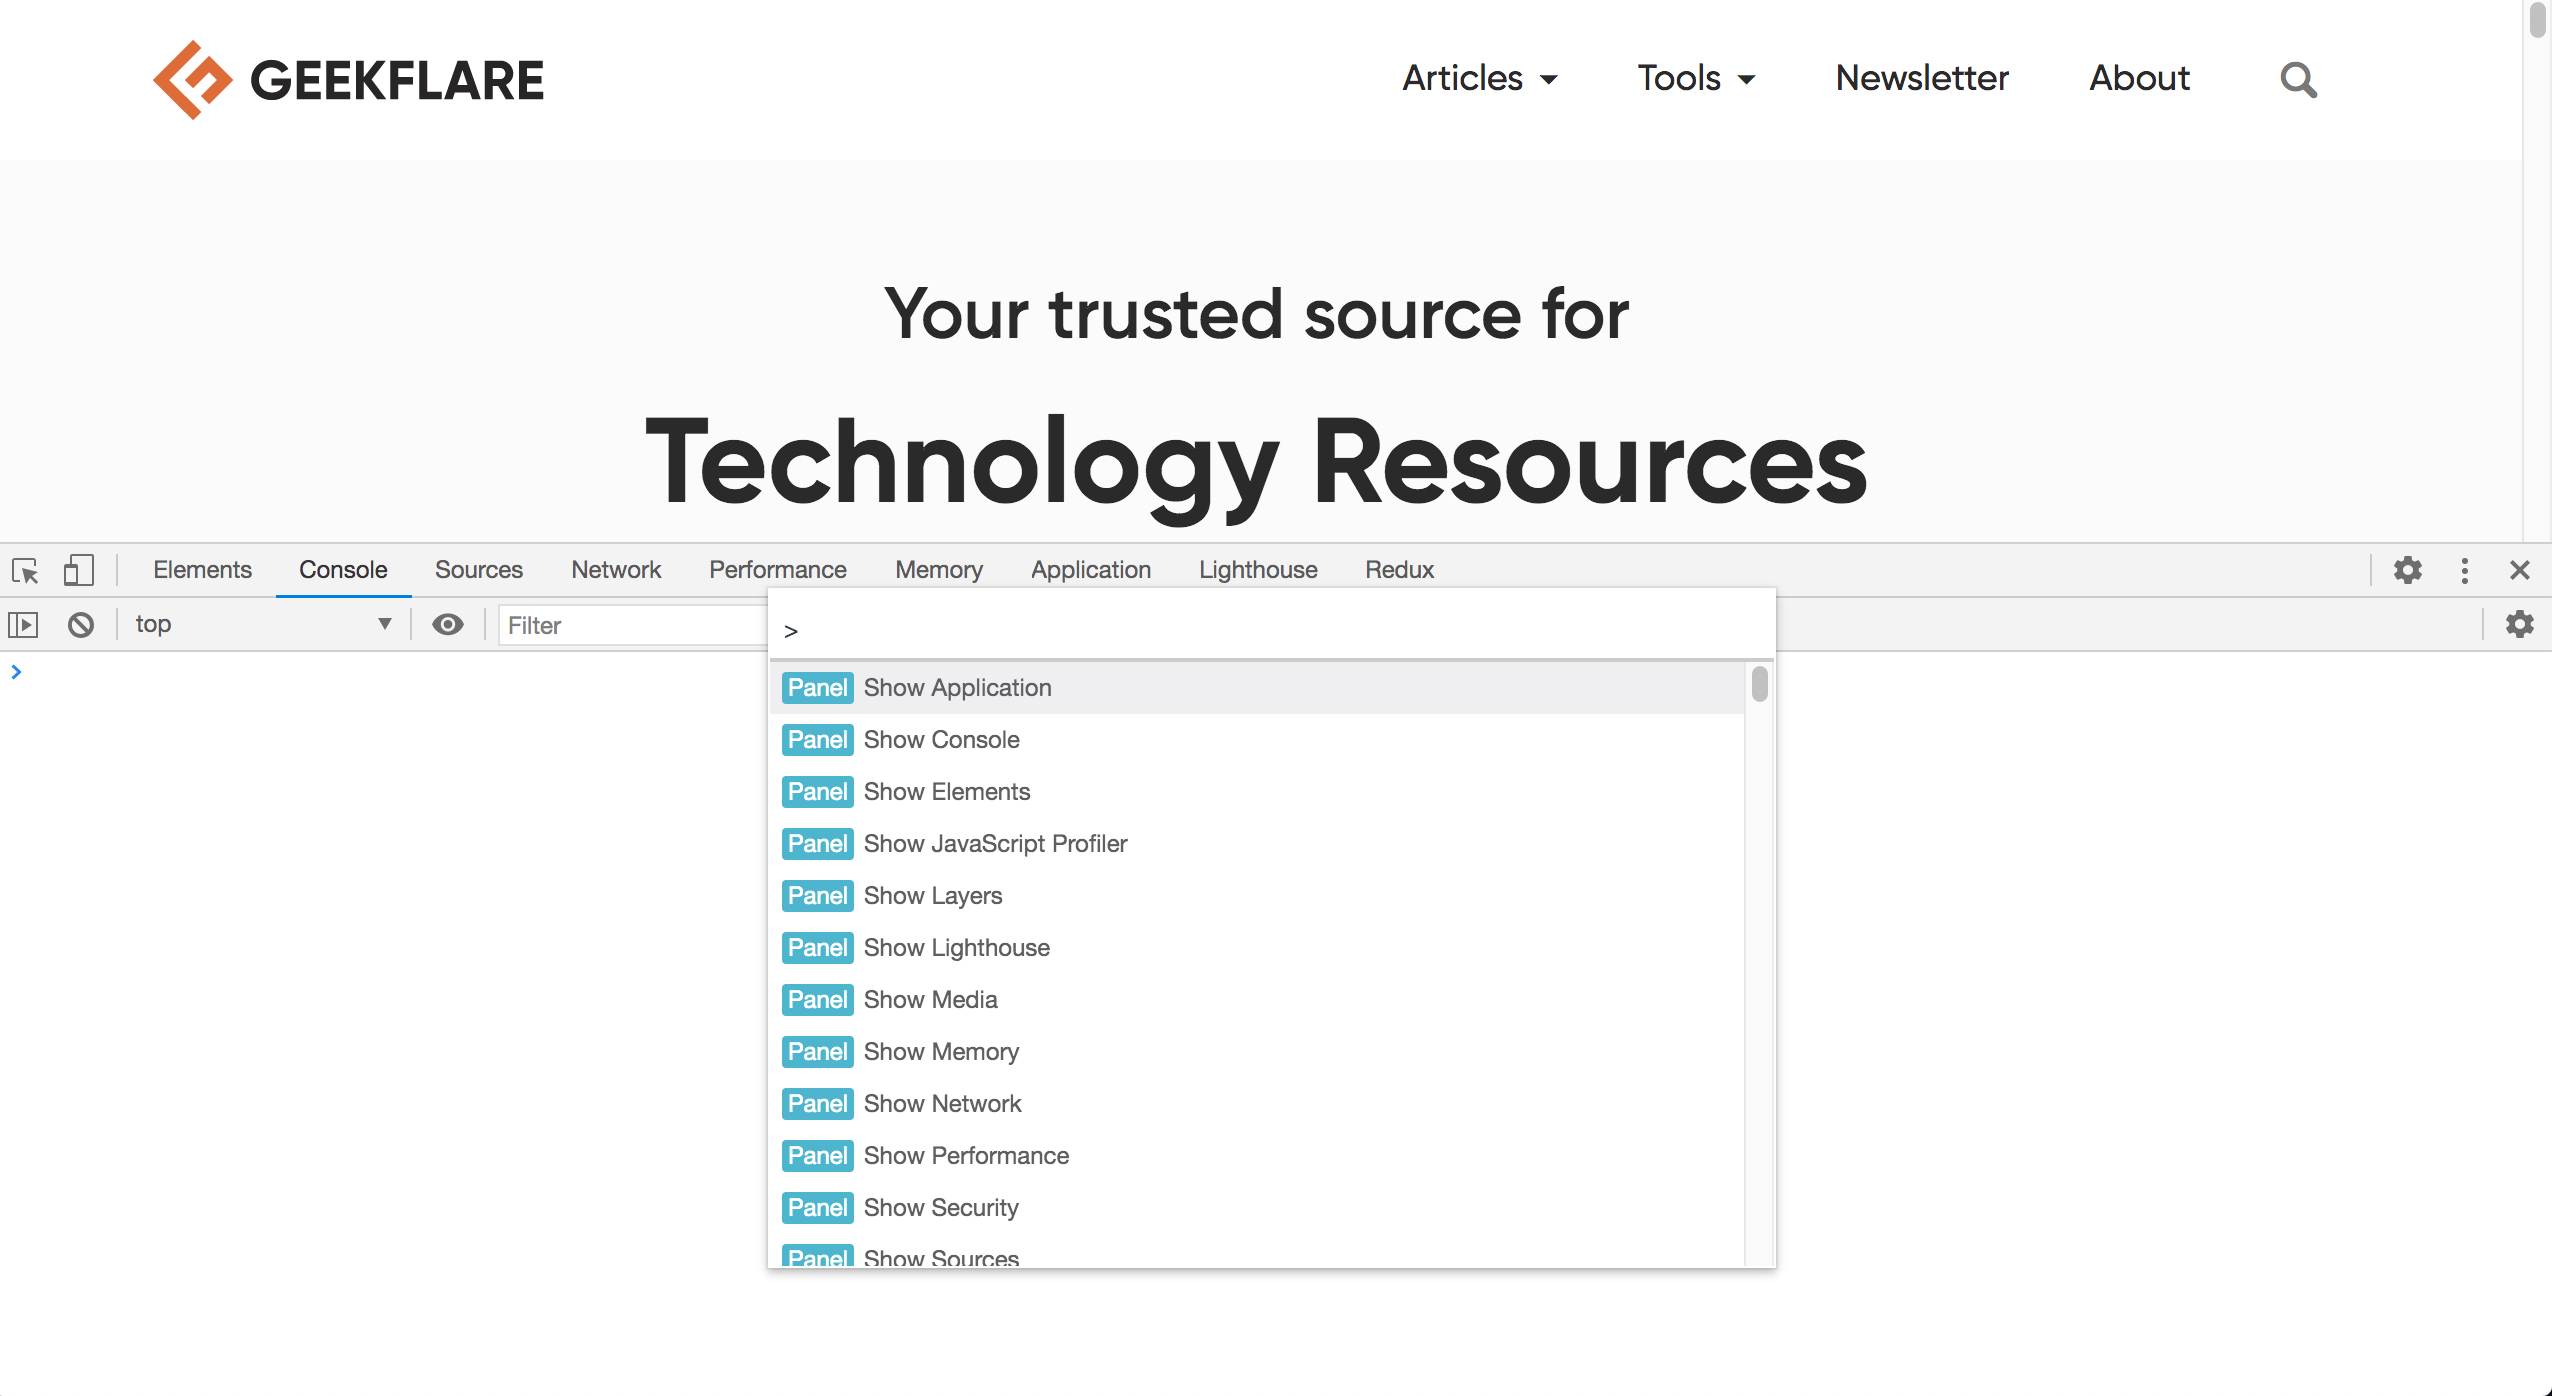
The Tools panel is full of capabilities and surprises. For instance, did you know that you could take a screenshot directly from the DevTools?
I bet not, because you’d have to fire up the Tools panel and type “screenshot” in the search bar to uncover that:
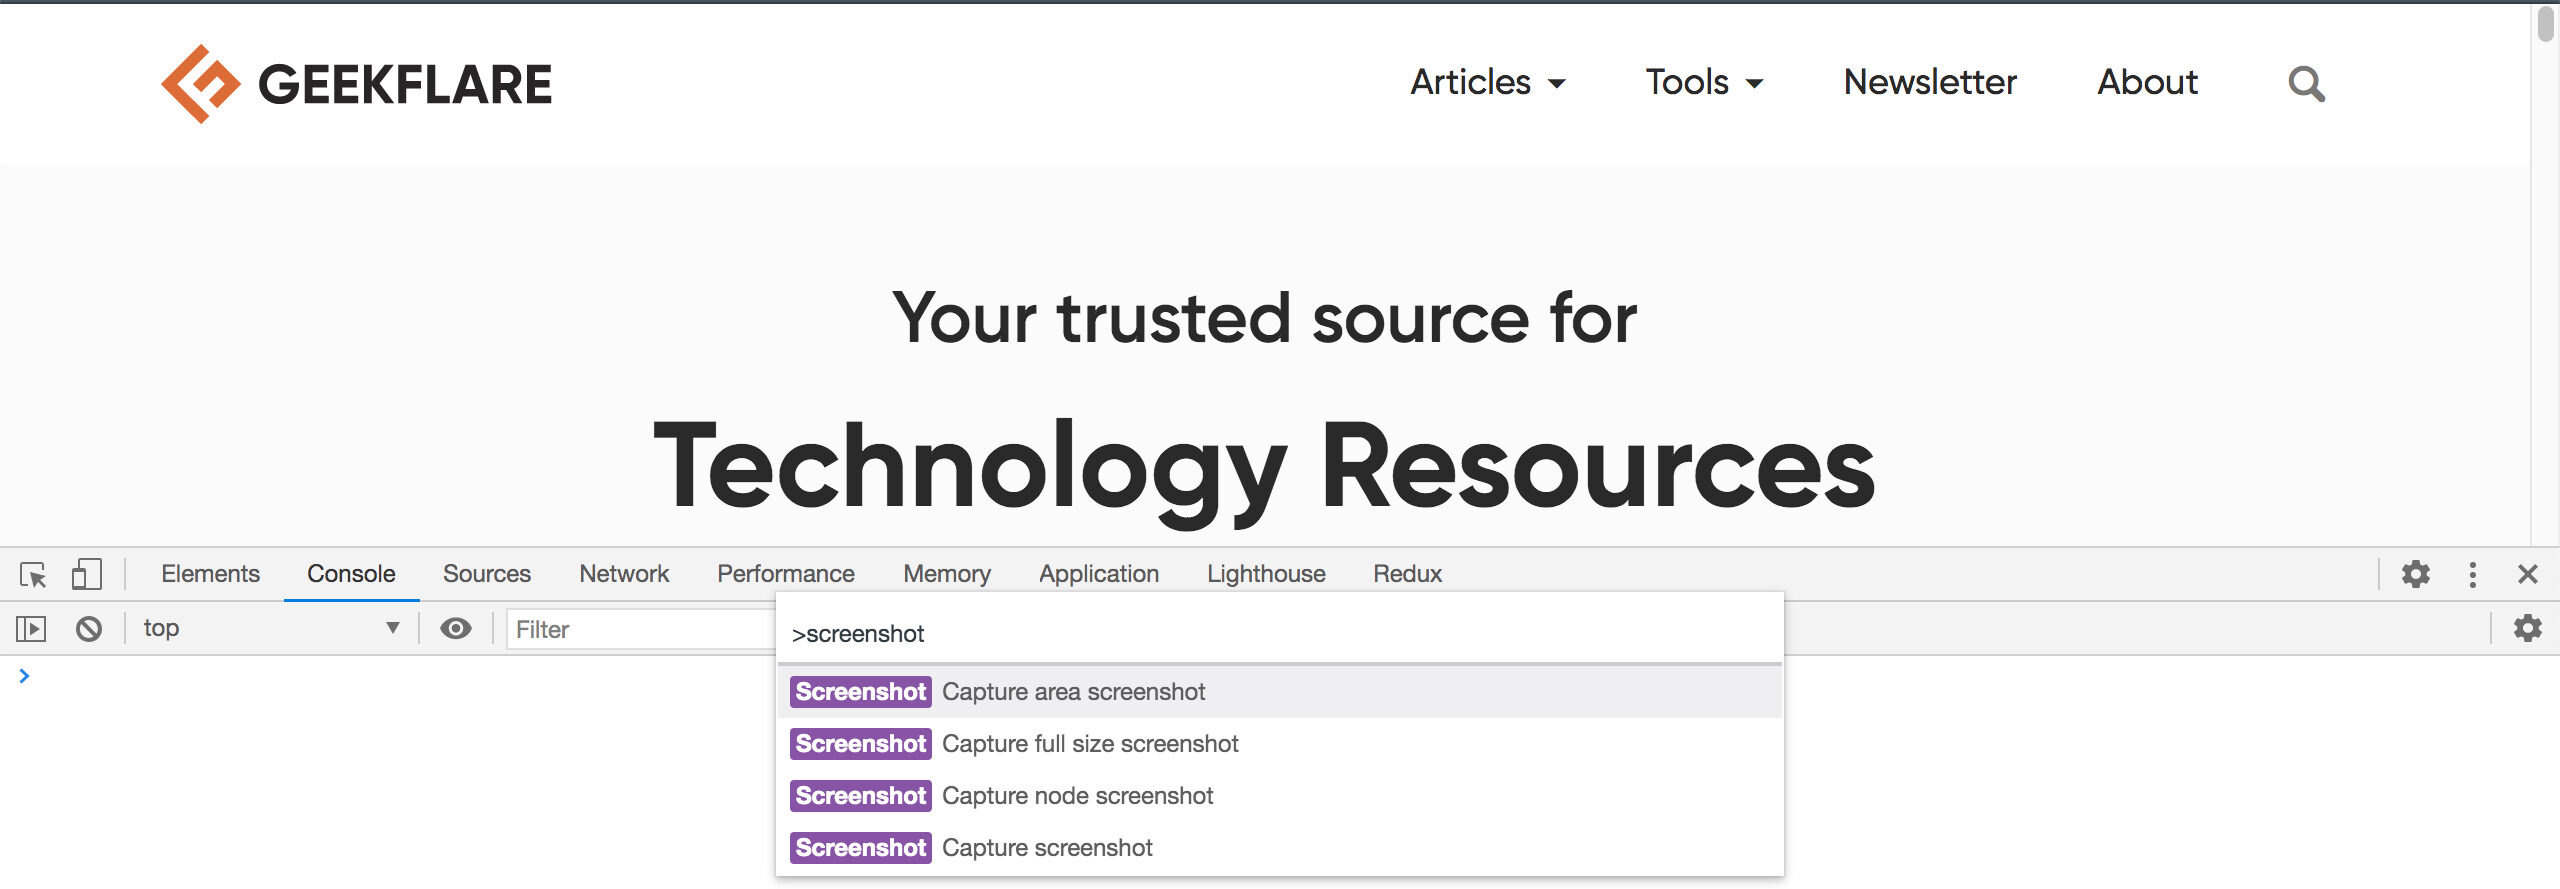
You’ll also notice several options for taking screenshots, including one for the selected DOM node! Explore the Tools panel more, and I assure you won’t be disappointed!
If you need to take a screenshot of any webpage remotely, check out the Geekflare Screenshot tool.
Conclusion
The Chrome browser itself is feature-rich, but where it really shines is the DevTools offering. As we saw in this article, there are quite a few well-hidden features–and others hiding in plain sight–that a vast majority of users don’t know about. Why are these features hidden?
I guess that some of these are very experimental (such as Design Mode), and the Chrome developers want to make it hard for everyday users to find these features. For the rest of the many features, I believe it’s simply a case of information overload: if there are, say, 120 features, with some of them having sub-features and so on, it’s pretty much impossible to design the right UI for such a scenario. Also, Google historically hasn’t done a great job with its products’ UX, so there’s that. 🤷🏻♂️
Regardless, I hope you found some of these features useful. But more importantly, I hope this article gave you a sense of what’s hiding where so that the next time you want to explore or search for something particular, you know where to go to “dig deep”. 😆


