
Monitoring the real-time state and behavior of the system and each of its components is crucial for any system administrator. Guider is an open-source performance analyzing tool for Linux operating systems. It is designed to measure the use of system resources, analyze it and improve the performance of the operating system.
In this tutorial, I will show you how to install and use Guider on Ubuntu 20.04.
Prerequisites
- A server running Ubuntu 20.04.
- A root password is configured on your server.
Install Guider
Guider is a Python-based tool so you will need to install Python and PIP to your system. You can install both using the following command:
apt-get install python3 python3-pipOnce both packages are installed, install the Guide by running the following command:
pip3 install --pre guiderOnce installed, verify the version of Guider with the following command:
guiderYou should get the following output:
   _____       _     _
  / ____|     (_)   | |
 | |  __ _   _ _  __| | ___ _ __
 | | |_ | | | | |/ _` |/ _  '__|
 | |__| | |_| | | (_| |  __/ |
  _____|__,_|_|__,_|___|_|  ver.3.9.8_210326 on python_3.8


Usage:
    $ /usr/local/bin/guider COMMAND|FILE [OPTIONS] [--help]

Author:
    Peace Lee ([email protected])

Bugs:
    [email protected] | https://github.com/iipeace/guider/issues

Copyright:
    Copyright 2015-2021, Guider
    License GPLv2.
    This is free software
Set Guider Buffer Size
Guider uses buffer size to perform all operations. The default buffer size is very low. You can check it with the following command:
cat /sys/kernel/debug/tracing/buffer_size_kbYou should see the following output:
7 (expanded: 1408)
It is recommended to set it to the required values. You can set the value to 40960 with the following command:
echo 40960 | tee /sys/kernel/debug/tracing/buffer_size_kbHow to Use Guider
Before starting, list all options available with Guider using the following command:
guider --helpYou should see the following output:
/ G.u.i.d.e.r   ver.3.9.8 /
--------------------------

Usage:
    $ /usr/local/bin/guider COMMAND|FILE [OPTIONS] [--help]

COMMAND:
    [CONTROL]       cli
                    event
                    list
                    send
                    server
                    start

    [LOG]           logdlt
                    logjrl
                    logkmsg
                    logsys
                    printdlt
                    printjrl
                    printkmsg
                    printsys

    [MONITOR]       atop
                    bgtop
                    btop
                    cgtop
                    ctop
                    dbustop
                    disktop
                    dlttop
                    ftop
                    mtop
                    ntop
                    ptop
                    pytop
                    rtop
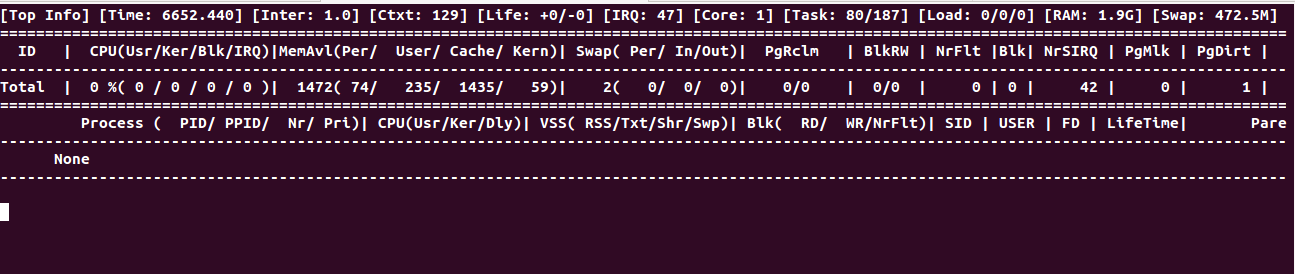
To print the real-time usage of Linux processes, run the following command:
guider topYou should see the following screen:
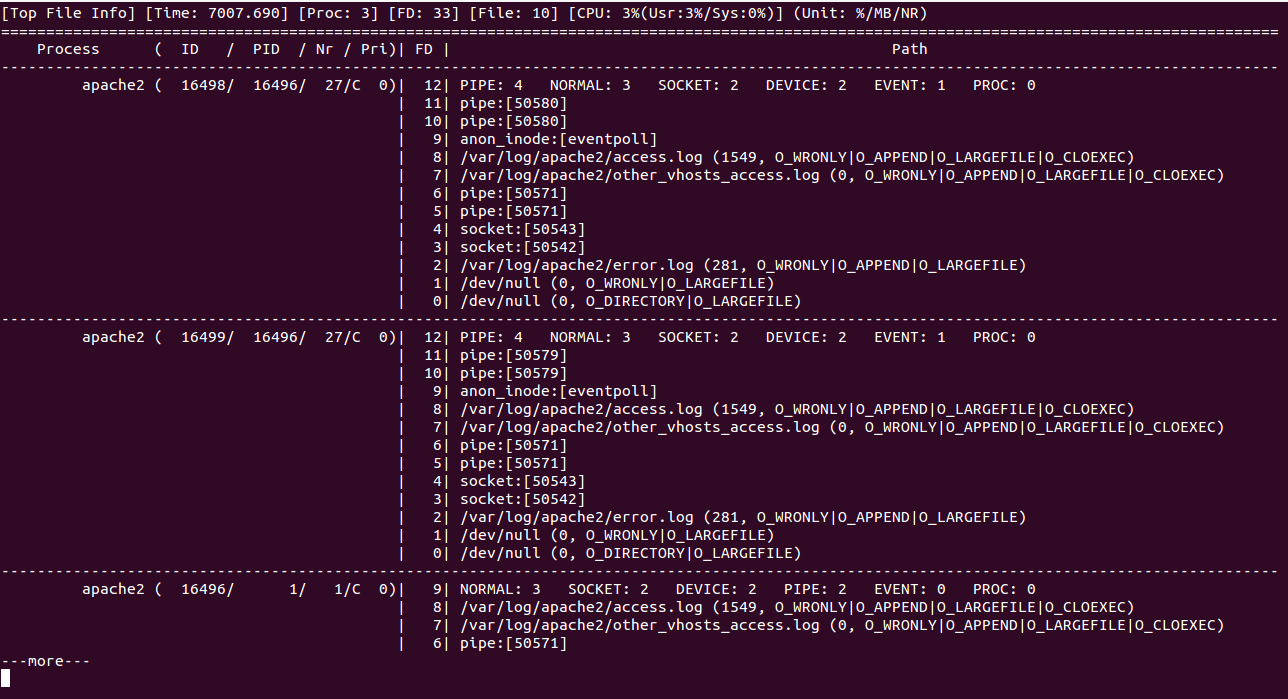
To print the real-time usage of the Apache process, run the following command:
guider ftop -g apache2You should see the following screen:
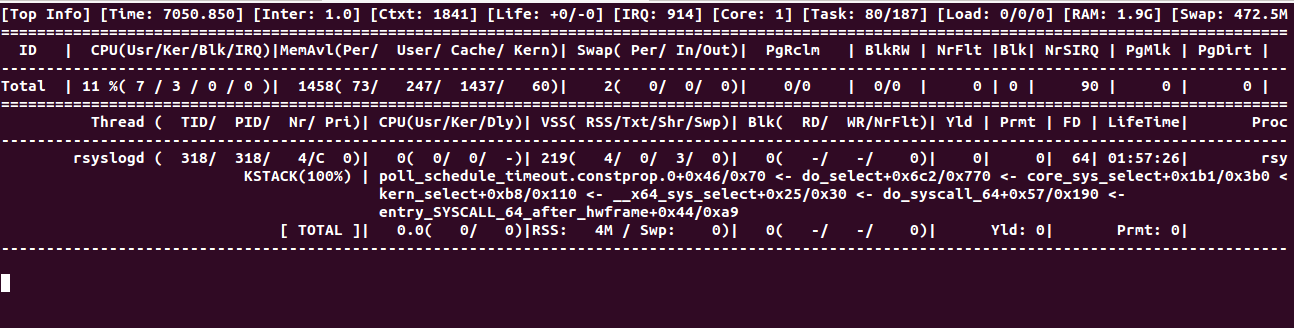
To analyze the syslog, run the following command:
guider stacktop -g syslogYou should see the following screen:
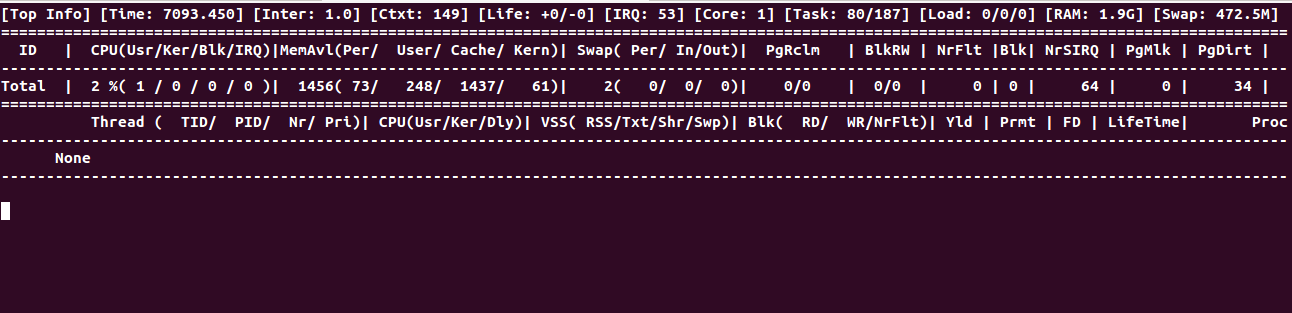
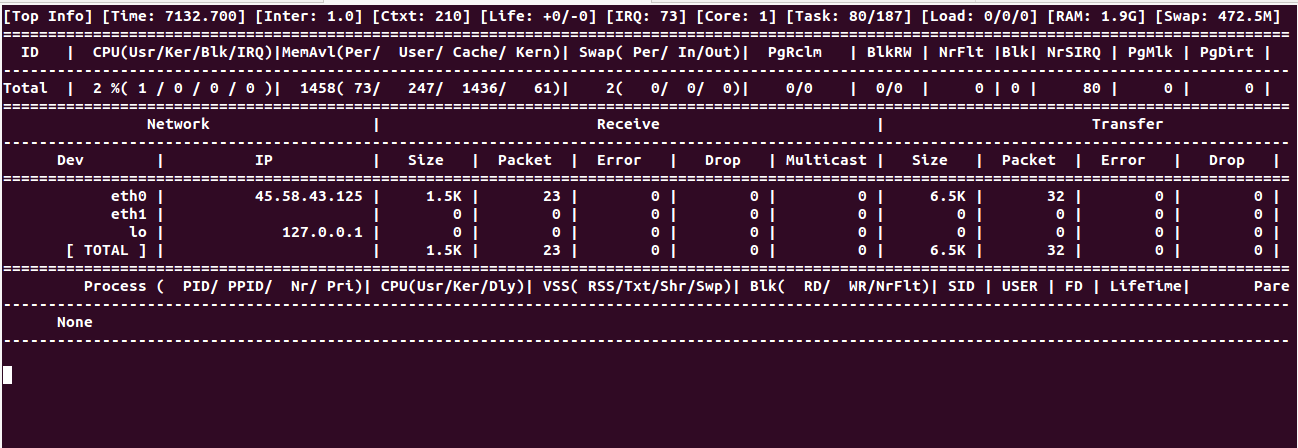
To print the real-time usage of Memory, CPU and Swap, run the following command:
guider ptop -g yesYou should see the following screen:
To print the network use in real-time, run the following command:
guider ntopYou should see the following screen:Advertisement
To print the systemd related information, run the following command:
guider printenv -g systemdYou should see the following output:
   _____       _     _
  / ____|     (_)   | |
 | |  __ _   _ _  __| | ___ _ __
 | | |_ | | | | |/ _` |/ _  '__|
 | |__| | |_| | | (_| |  __/ |
  _____|__,_|_|__,_|___|_|  ver.3.9.8_210326 on python_3.8


[ systemd(1) ]
-----------------------------------------------------------------------------
biosdevname=0
HOME=/
init=/sbin/init
NETWORK_SKIP_ENSLAVED=
TERM=linux
BOOT_IMAGE=/boot/vmlinuz-5.4.0-29-generic
drop_caps=
PATH=/usr/local/sbin:/usr/local/bin:/usr/sbin:/usr/bin:/sbin:/bin
PWD=/
rootmnt=/root
-----------------------------------------------------------------------------

[ systemd(582) ]
-----------------------------------------------------------------------------
LANG=en_US.UTF-8
PATH=/usr/local/sbin:/usr/local/bin:/usr/sbin:/usr/bin:/sbin:/bin
NOTIFY_SOCKET=/run/systemd/notify
HOME=/root
LOGNAME=root
USER=root
SHELL=/bin/sh
INVOCATION_ID=57fe5ba9493341f2ae3bcda335ace1ca
JOURNAL_STREAM=9:17085
XDG_RUNTIME_DIR=/run/user/0
-----------------------------------------------------------------------------
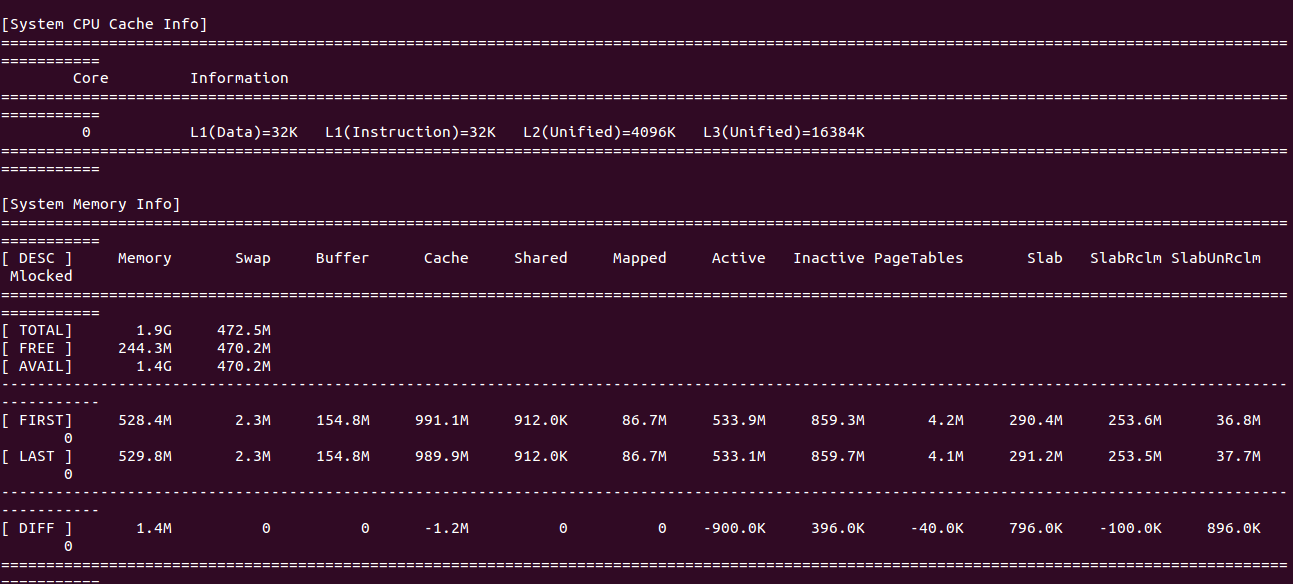
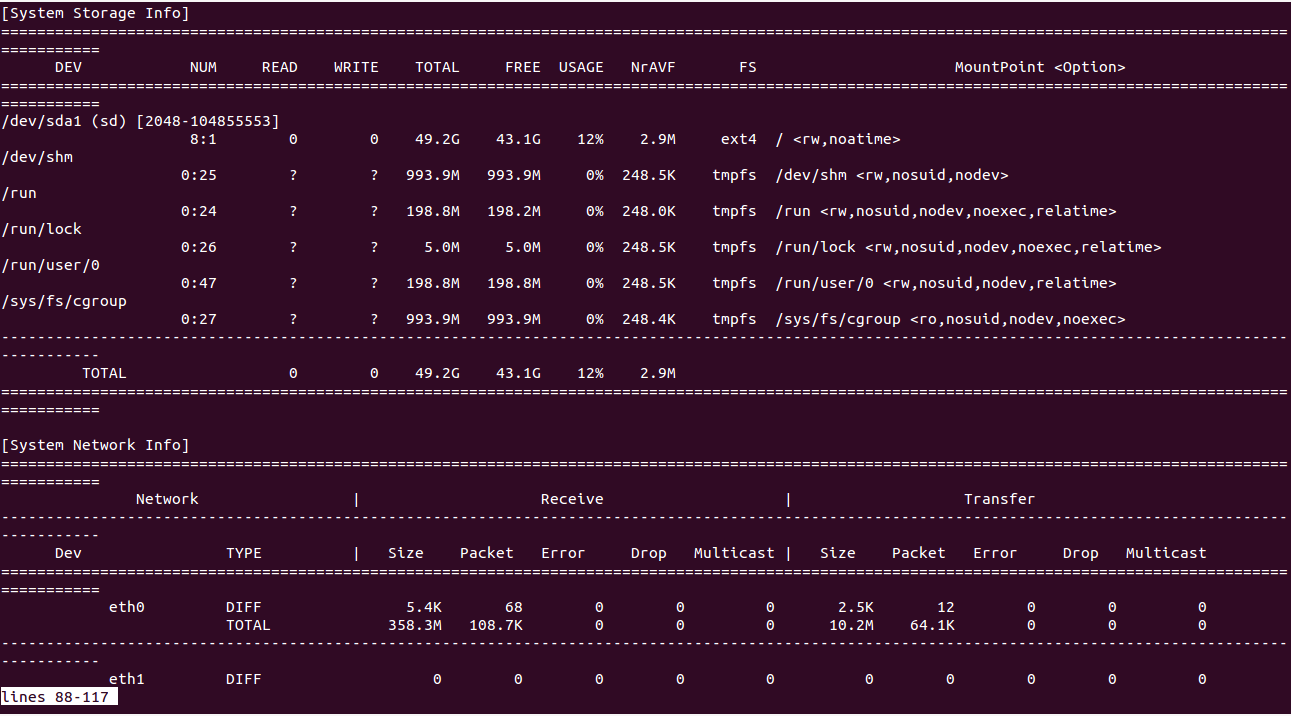
To generate a complete system analysis report including, system info, OS info, CPU info, memory info, and disk info, run the following command:
guider rec -a -e mYou should see the following screen:
To trace the system and save the data in a file, run the following command:Advertisement
guider top -o .The above command will save the data in a file guider.out.
You can inspect it with the following command:
cat guider.outConclusion
In the above guide, you learned how to install and use the Guider System Performance Analysis tool on Ubuntu. I hope this will help you to analyze the operating system usage and give an idea to improve the performance.
About Hitesh Jethva
Over 8 years of experience as a Linux system administrator. My skills include a depth knowledge of Redhat/Centos, Ubuntu Nginx and Apache, Mysql, Subversion, Linux, Ubuntu, web hosting, web server, Squid proxy, NFS, FTP, DNS, Samba, LDAP, OpenVPN, Haproxy, Amazon web services, WHMCS, OpenStack Cloud, Postfix Mail Server, Security etc.


