
Nagios is an open-source monitoring system for servers, networks, and applications. It also provides proactive problem resolution with a real-time tracking IT infrastructure. Nagios monitors the health and performance of servers and network applications.
In this guide, we will show you how to install the Nagios Monitoring Tool on the Almalinux 9 server. You will install Nagios via EPEL, which makes the Nagios package easy to install.
Prerequisites
Before you start, ensure that you have the following:
- An AlmaLinxu 9 server.
- A non-root user with sudo privileges.
- A SELinux with status permissive.
Enable Repository EPEL and CRB (CodeReady Build)
Before installing Nagios, you must add the EPEL repository and enable the Code Ready Build (CRB) on your AlmaLinux server. This is because the Nagios package is only available in EPEL, and some perl package dependencies for Nagios are available on the CRB repository.
First, execute the following command to enable the CRB repository on your AlamaLinux server.
sudo dnf config-manager --set-enabled crb
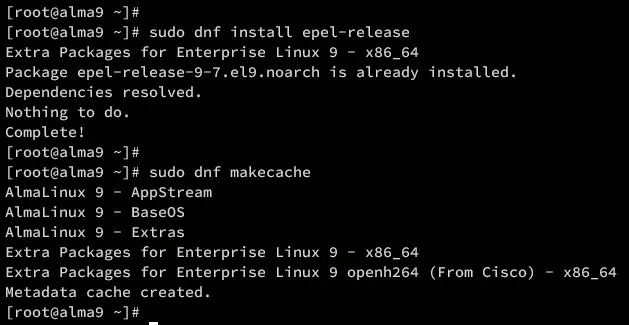
Secondly, execute the command below to add the EPEL repository to your system.
sudo dnf install epel-release
Lastly, refresh available repositories on AlmaLinux using the command below.
sudo dnf makecache
Installing Nagios on AlmaLinux
With the EPEL and CRB repository added, you can now install Nagios on your AlmaLinux server. You can compile it manually, but for faster deployment, you will install Nagios via EPEL.
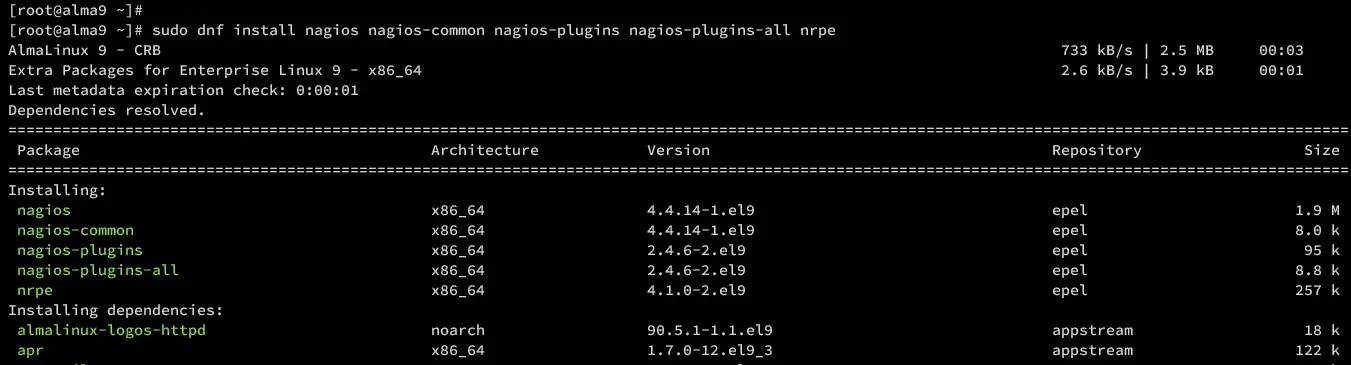
Execute the dnf command below to install Nagios, Nagios Plugin, and the Nagios NRPE plugin to your AlmaLinux. Type y to proceed with the installation.
sudo dnf install nagios nagios-common nagios-plugins nagios-plugins-all nrpe
Once the installation is complete, start and enable the Nagios service using the following command.
sudo systemctl start nagios
sudo systemctl enable nagios
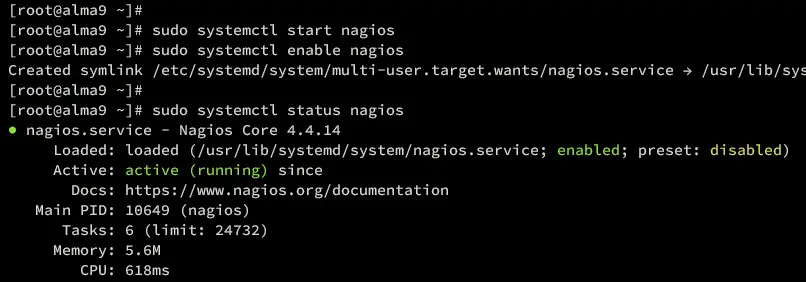
Then, verify the Nagios service to ensure that the service is running.
sudo systemctl status nagios
Below you can see the nagios service running on the AlmaLinux server.
Next, start and enable the httpd service by executing the following command.
sudo systemctl start httpd
sudo systemctl enable httpd
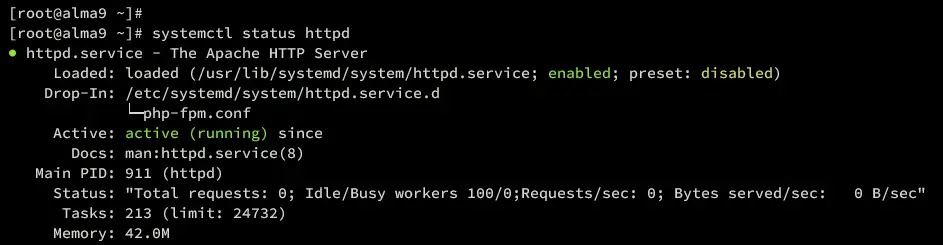
Once started, verify the httpd service using the command below.
sudo systemctl status httpd
Ensure the httpd service status is running like this:
Configuring Nagios Monitoring
Now that you have installed Nagis, the next step is to configure your Nagios installation by setting up the authentication, changing the default password for nagiosadmin, and verifying the httpd configuration.
Before that, you must know below some of the configuration files and directory-related Nagios:
- /etc/nagios: the main configuration directory for Nagios.
- /etc/httpd/conf.d/nagios.conf: the main configuration for integration between Nagios and the httpd web server.
- /etc/nagios/nagios.conf: Nagios configuration file.
- /etc/nagios/cgi.cfg: the main configuration for the Nagios web application, which is running under CGI.
- /etc/nagios/passwd: the default password file for Nagios authentication. Based on Apache/httpd basic_auth module.
Execute the following nano editor command and open the Nagios CGI configuration /etc/nagios/cgi.cfg.
sudo nano /etc/nagios/cgi.cfg
Find the use_authentication option and make sure it’s enabled with value 1.
# AUTHENTICATION USAGE
# This option controls whether or not the CGIs will use any
# Authentication when displaying host and service information, as
# well as committing commands to Nagios for processing.
#
# Read the HTML documentation to learn how the authorization works!
#
# NOTE: It is a really *bad* idea to disable authorization, unless
# You plan on removing the command CGI (cmd. cgi)! Failure to do
# so will leave you wide open to kiddies messing with Nagios and
# possibly hitting you with a denial of service attack by filling up
# your drive by continuously writing to your command file!
#
# Setting this value to 0 will cause the CGIs to *not* use
# authentication (bad idea), while any other value will make them
# use the authentication functions (the default).use_authentication=1
Save the file and exit the editor.
Run the command below to restart the nagios service and apply your changes.
sudo systemctl restart nagios
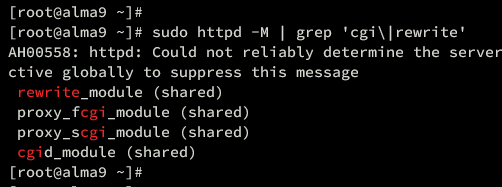
Next, execute the following command to ensure that the cgi and rewrite modules on httpd are enabled.
sudo httpd -M | grep 'cgi|rewrite'
If enabled, you will see an output like this:
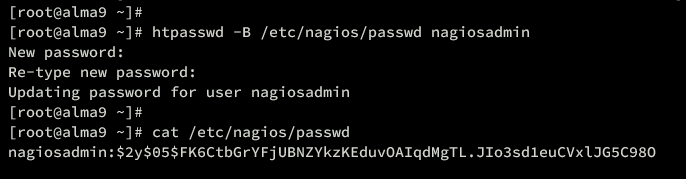
Lastly, you can now update the default password for nagiosadmin using the htpasswd command below. Input your new password and repeat. With the -B parameter, you will be using bcrypt, instead of MD5.
htpasswd -B /etc/nagios/passwd nagiosadmin
Setting Up Firewalld
Now that you have configured Nagios, in the next section you must open the HTTP port in firewalld.
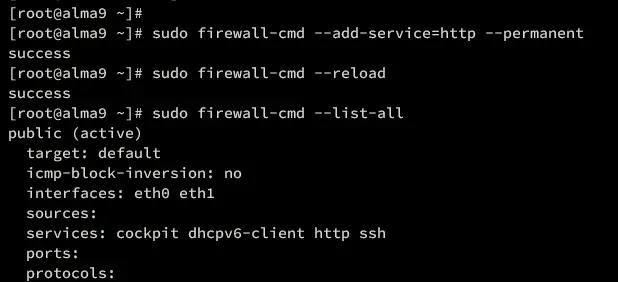
Execute the following command to enable the http service in firewalld.
sudo firewall-cmd --add-service=http --permanent
Now reload firewalld to take effects on your modifications.
sudo firewall-cmd --reload
lastly, execute the command below to verify the list-enabled rules in firewalld. Ensure you have the http service enabled in your firewalld rules.
sudo firewall-cmd --list-all
Logging into Nagios Monitoring
At this point, you have completed and configured your Nagios installation. In the next step, you will verify your installation by accessing it from your web browser.
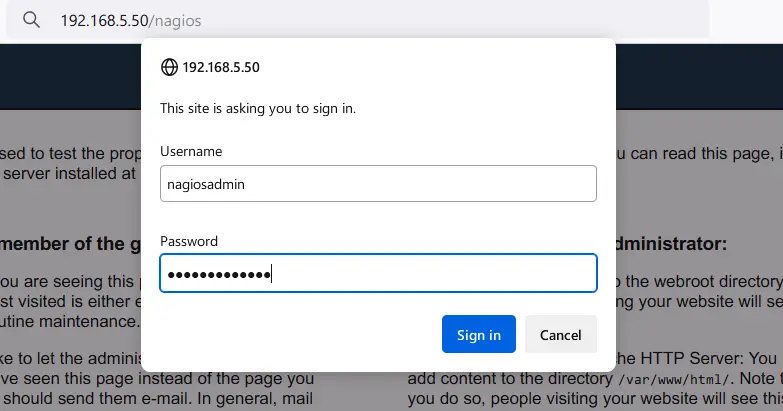
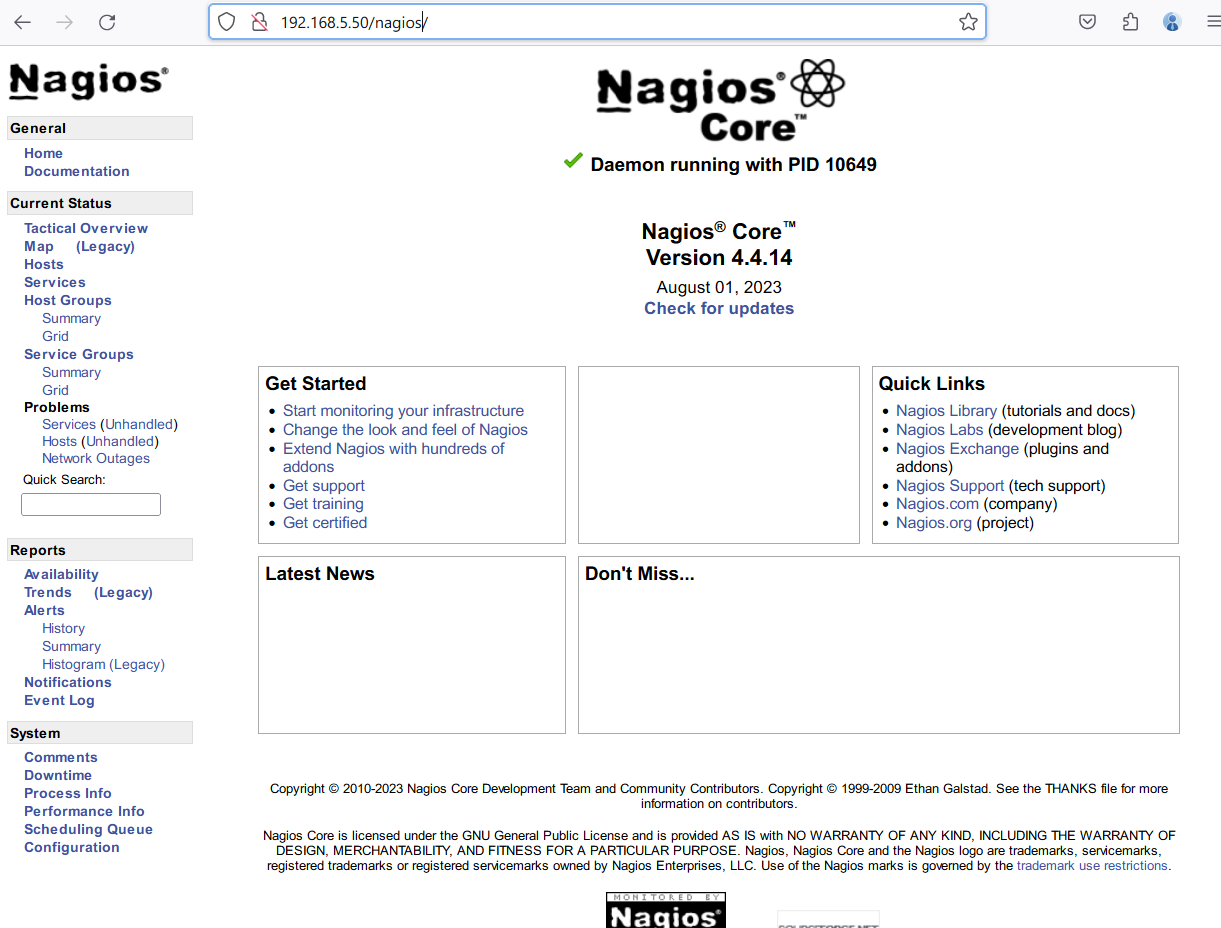
On your local machine, open the web browser and visit the server IP address followed by the /nagios path (http://192.168.5.50/nagios). When prompted for authentication, input the default user Nagios admin and input your password, then click Sign In to confirm.
If you have the correct password for the nagiosadmin user, you will be presented with the Nagios administration dashboard like the following:
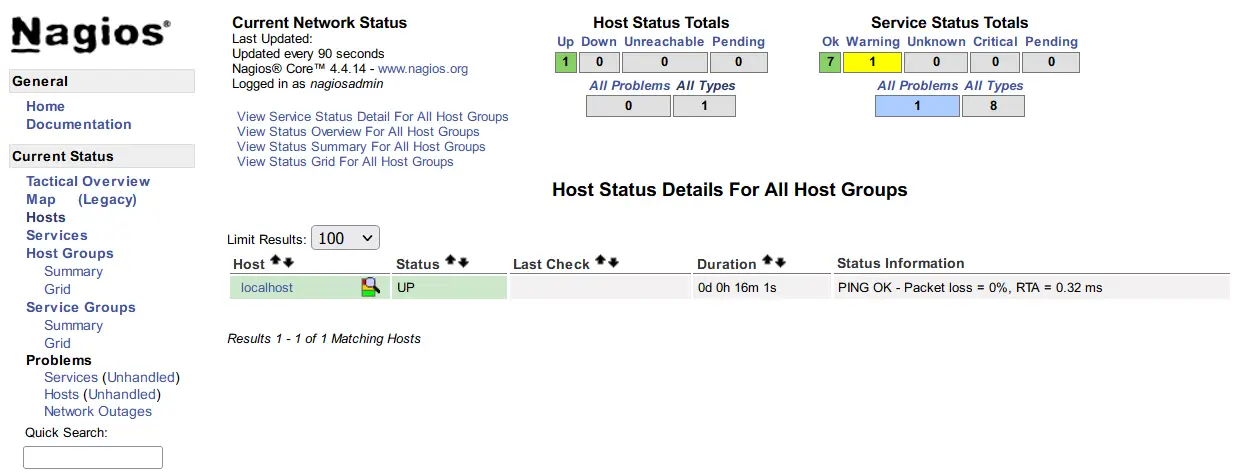
Next, click on the Hosts menu to get the list of hosts/machines in your Nagios system. You should see your local host of AlmaLinux is monitored by Nagios.
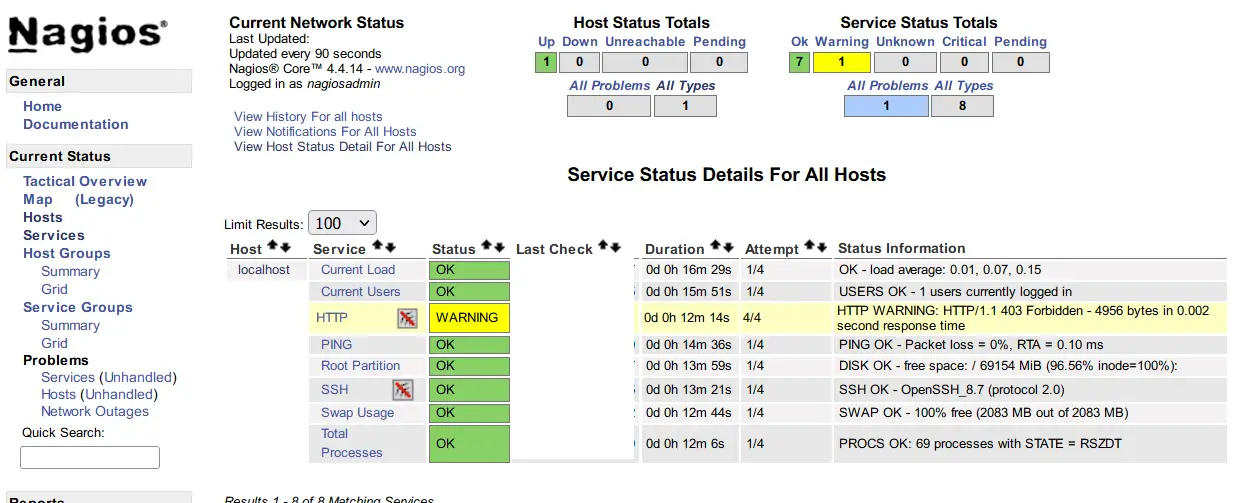
Now click on the Services menu to get the list of services on your monitoring system. In this example, you should see the default monitoring for your Nagios server with some services such as HTTP, SSH, Process monitoring, load system, logged-in users, and also partition details.
Now you have finished the nagios installation.
Conclusion
Congratulations! You have finished the installation of the Nagios monitoring Tool on the Almalinux 9 server. You have installed Nagios with the httpd web server and PHP, you have also enabled Nagios authentication and changed the default password for nagiosadmin. From here, you can now add a host to monitor via the Nagios plugin and Nagios NRPE plugin.


