Zabbix is an open source monitoring software for companies. It is not limited to monitoring servers, but can also monitor network devices, cloud services, virtual machines and containers, databases and applications, IoT sensors, etc. The open source monitoring tool Zabbix is built on security: Communication between Zabbix components is encrypted by default. Zabbix is 100% open source and can be used both on-premise and in the cloud. It also supports distributed monitoring and high availability.
Thanks to extensive support from software and hardware providers, Zabbix can be integrated into numerous applications and services. For example, the integration of Zabbix with cloud services such as Google Cloud and Amazon Web Services or the integration of Zabbix with Prometheus and Grafana, etc.
The main component of Zabbix (server and agent) is written in C, the frontend in PHP. You can install Zabbix with different database backends, including MySQL, PostgreSQL, TimescaleDB, Oracle and SQLite. Zabbix is a free monitoring tool released under the GNU GPL v2 license.
In this tutorial you will set up the Zabbix Enterprise Monitoring Solution on the Rocky Linux Server. You will install Zabbix with PostgreSQL as database backend and the web server Apache2/httpd. This will allow you to monitor your server infrastructure with a free and enterprise-grade solution. You can monitor virtual machines, Linux, Windows, applications and services, clouds and also network devices.
Prerequisites
You will need the following infrastructure requirements for this tutorial:
- A fresh Rocky Linux server – This will be used as the Zabbix server on which you install the Zabbix Monitoring Solution.
- A Linux host – This will be used as an example for monitoring Linux hosts/machines with Zabbix.
- You will also need administrative sudo rights on all of these servers. You can use a direct “root” user or a non-root user who can run the “sudo” command.
Installing the Zabbix packages
In this first step, you will set up the Zabbix repository for the Rocky Linux system and install some of the basic packages of the Zabbix monitoring tool. The official Zabbix repository provides a repository for several Linux distributions, including Rocky Linux, a CentOS/RHEL-based distribution. You also activate some additional package repositories such as PHP 7.4 and the PostgreSQL database.
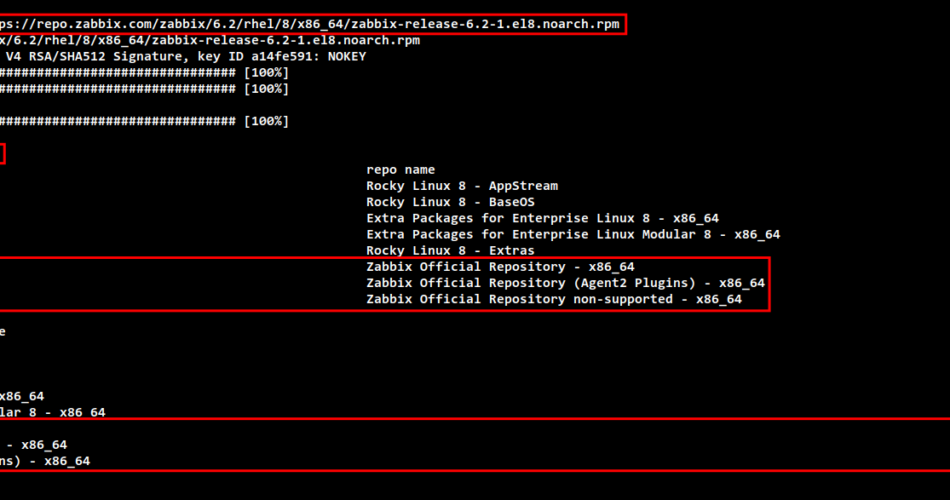
Run the following command to add the Zabbix repository to your Rocky Linux system. At the time of writing, we are installing the latest version of Zabbix 6.2. You can also download a different version of Zabbix from the official Zabbix download page.
sudo rpm -Uvh https://repo.zabbix.com/zabbix/6.2/rhel/8/x86_64/zabbix-release-6.2-1.el8.noarch.rpm
Next, run the following dnf command to check and verify the repository list on the Rocky Linux system. Then create a new repository metadata cache.
You should see that the Zabbix repository has been added to the Rocky Linux system.
sudo dnf repolist
sudo dnf makecache

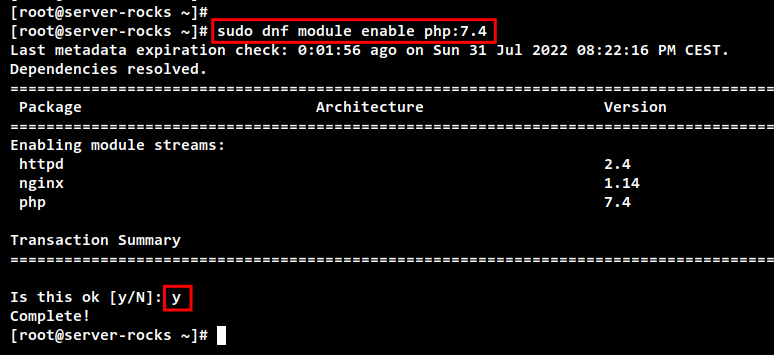
Zabbix requires PHP packages that are used for the Zabbix front-end (user dashboard). At the time of writing, PHP v8.0 is not yet supported. Therefore, you need to set up the PHP repository module v7.4.
Execute the following dnf command to enable the PHP repository module for PHP v7.4. Enter y when prompted to configure.
sudo dnf module enable php:7.4
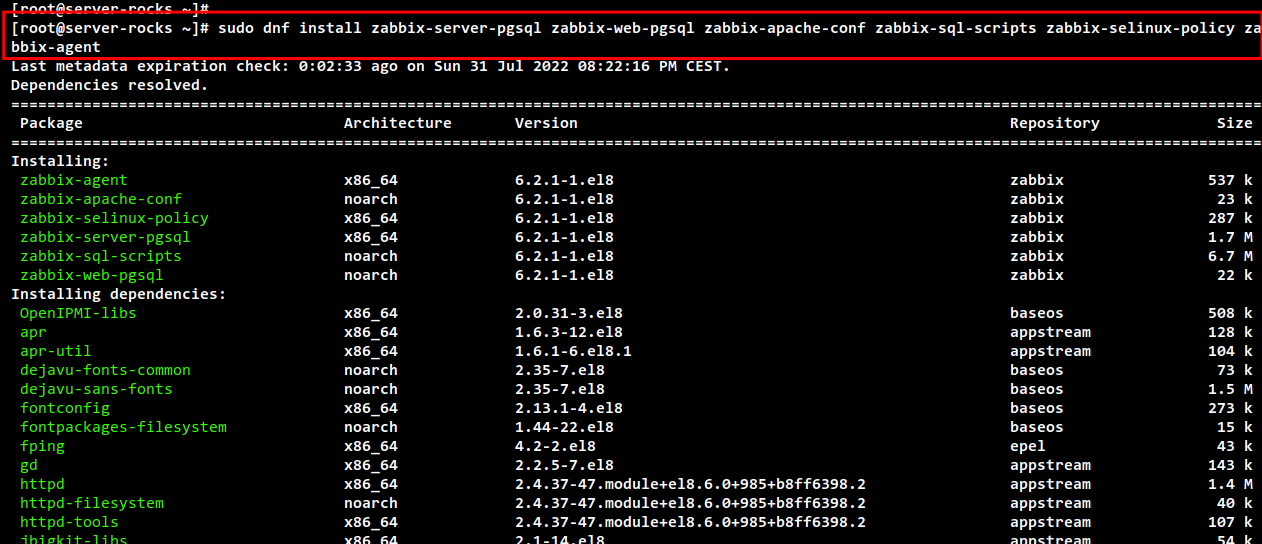
Now install Zabbix with some package dependencies for Zabbix Monitoring Stack with the following dnf command. Enter Y to confirm the installation and press ENTER. The installation of Zabbix should start.
sudo dnf install zabbix-server-pgsql zabbix-web-pgsql zabbix-apache-conf zabbix-sql-scripts zabbix-selinux-policy zabbix-agent
Installation of PostgreSQL Server
Zabbix supports RDBMS like MariaDB/MySQL and PostgreSQL for the database backend. In this example we will install Zabbix with PostgreSQL as database backend. So you install the PostgreSQL server and set up the database and user for Zabbix.
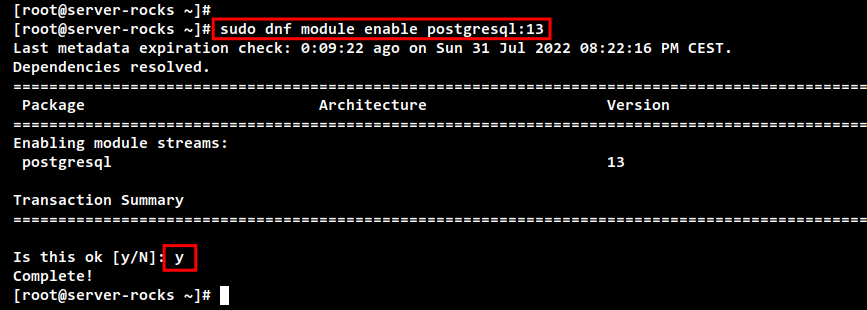
The latest version of Zabbix requires at least PostgreSQL v13. Execute the following dnf command to activate the PostgreSQL repository module for v13.
Enter y to confirm and activate the repository module“postgresql:13“.
sudo dnf module enable postgresql:13
Install the PostgreSQL server with the following command. Enter Y to confirm the installation and press ENTER to continue.
sudo dnf install postgresql-server postgresql-contrib
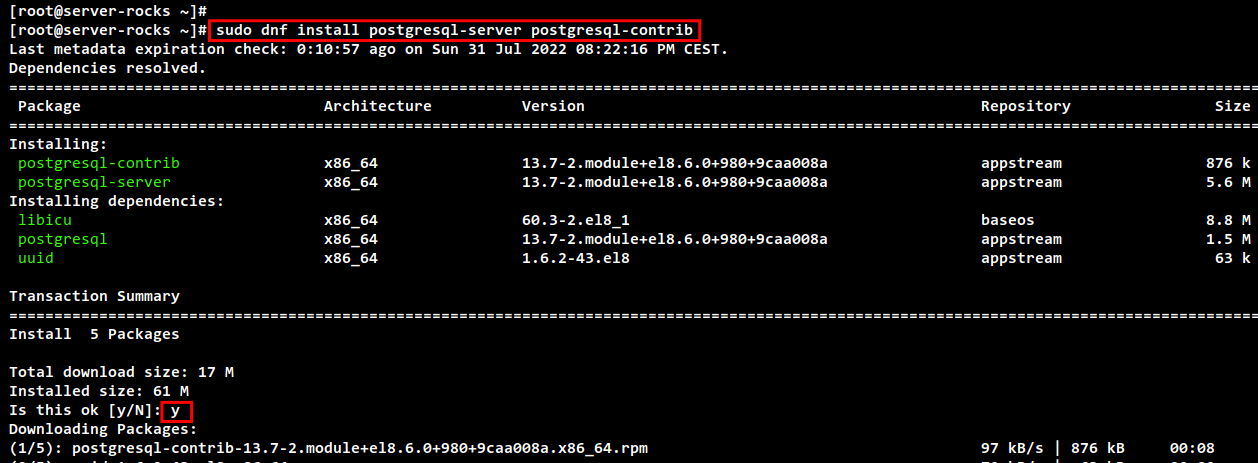
The PostgreSQL server should now be installed on your computer. Now execute the following command to initialize the configuration of the PostgreSQL server.
sudo postgresql-setup --initdb
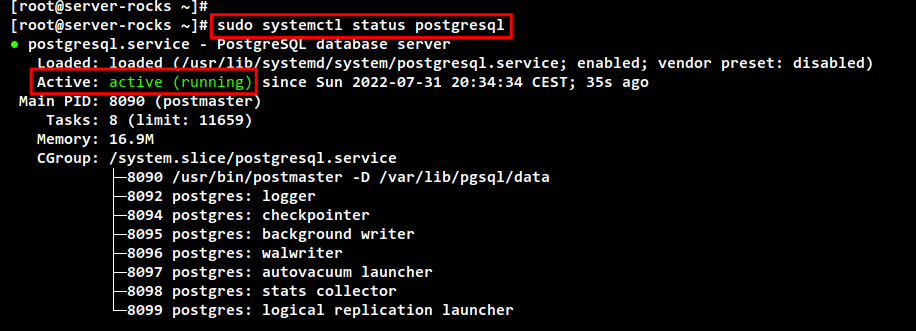
Start and then activate the PostgreSQL service with the following command. Then check and verify the PostgreSQL service.

You should now see that PostgreSQL is“activated” and is automatically executed when the system is started. The current status is “running”.
sudo systemctl enable --now postgresql
sudo systemctl status postgresql
To set up PostgreSQL as a database backend for Zabbix, you need to set up the correct authentication for PostgreSQL database users. You can do this by editing the PostgreSQL configurations.
Edit the file“https://vitux.com/var/lib/pgsql/data/postgresql.conf” with the following command.
sudo nano /var/lib/pgsql/data/postgresql.conf
Remove the comment character from the option“password_encryption” and change the value to“scram-sha-256“. This option activates password encryption for all PostgreSQL users.
password_encryption = scram-sha-256
Save and close the file when you are done.
Next, edit the configuration“https://vitux.com/var/lib/pgsql/data/pg_hba.conf” with the command below. Then enable the authentication method for PostgreSQL users.
sudo nano /var/lib/pgsql/data/pg_hba.conf
Change the local authentication for local connections to the method “scram-sha-256”.
# IPv4 local connections:
host    all             all             127.0.0.1/32            scram-sha-256
# IPv6 local connections:
host    all             all             ::1/128                 scram-sha-256
Save and close the file when you are done.
Restart the PostgreSQL service to implement and apply the changes.
sudo systemctl restart postgresql
You have finished configuring the PostgreSQL server authentication methods with“scram-sha-256“. You will now create a new PostgreSQL user and a database for Zabbix.
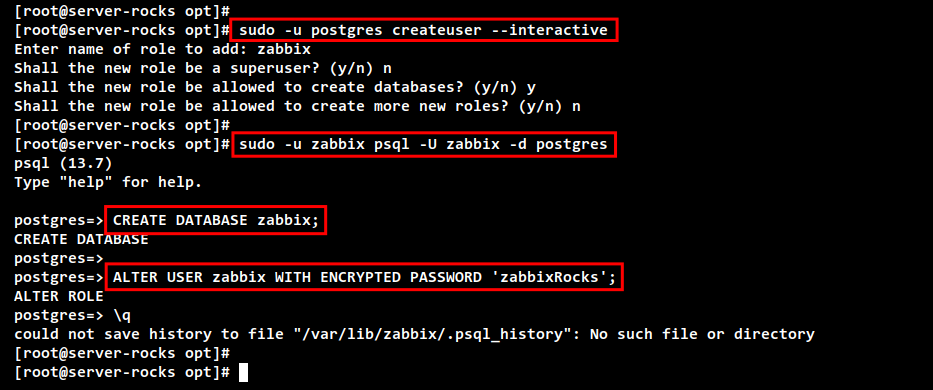
Execute the following command to create a new PostgreSQL user. In the following you will be asked for some configurations:
- Enter the name of the role or new user as “zabbix”.
- Enter “n” to disable the superuser for this “zabbix” user.
- Enter “y” to allow this user to create databases.
- Enter “n” again to disable the privileges for creating a new role.
sudo -u postgres createuser --interactive
Next, run the following command to log in to the PostgreSQL shell as user “zabbix” and connect to the default database “postgres”.
sudo -u zabbix psql -U zabbix -d postgres
Execute the following command in the PostgreSQL shell to create a new database with the name “zabbix”. Then set the password for the user“zabbix“. In this example we use the password“zabbixRocks“.
CREATE DATABASE zabbix;
ALTER USER zabbix WITH ENCRYPTED PASSWORD 'zabbixRocks';
Press“Ctrl d” or simply enter“q” to exit the PostgreSQL shell and leave.
Now run the following command to ensure that the new PostgreSQL user“zabbix” can connect to the PostgreSQL database “zabbix”. You will be asked for the password for“zabbix“, enter the password“zabbixRocks“.
sudo -u zabbix psql -U zabbix -d zabbix -h localhost
If you are logged into the PostgreSQL shell of the “zabbix” database, run the following command to check the connection details of the current session.
You should see that you are connected via the PostgreSQL“zabbix” to the PostgreSQL server“localhost” and the database“zabbix“.
conninfo

Setting up Zabbix with the PostgreSQL database
After you have installed the PostgreSQL server and set up the new database and user. Now set up Zabbix with PostgreSQL as the database backend.
Execute the following command to import the Zabbix database schema into the PostgreSQL database“zabbix“.
zcat /usr/share/doc/zabbix-sql-scripts/postgresql/server.sql.gz | sudo -u zabbix psql zabbix
Next, edit the Zabbix server configuration“https://vitux.com/etc/zabbix/zabbix_server.conf” with the following command.
sudo nano /etc/zabbix/zabbix_server.conf
Remove the comment in the line“DBPassword” and enter the “zabbix” database password“zabbixRocks“.
DBPassword=zabbixRocks
Save and close the file when you are finished.
Before you restart the Zabbix services, you need to set up the SELinux configuration and the propel firewall rules.
Run the following command to set up SELinux for Zabbix. This configuration enables communication between the Zabbix frontend and the server.
sudo setsebool -P httpd_can_connect_zabbix on
sudo setsebool -P httpd_can_network_connect_db on
Now execute the following command to add firewalld rules for Zabbix. The HTTP service is for accessing the Zabbix frontend and the port “10050/tcp” is used by the Zabbix agent.
sudo firewall-cmd --add-service=http --permanent
sudo firewall-cmd --add-port=10050/tcp --permanent
sudo firewall-cmd --reload
Finally, execute the following command to start and activate the Zabbix stack services. These include the services zabbix-server, zabbix-agent, httpd, php-fpm and PostgreSQL.
sudo systemctl start zabbix-server zabbix-agent httpd php-fpm postgresql
sudo systemctl enable zabbix-server zabbix-agent httpd php-fpm postgresql
Installing the Zabbix web interface
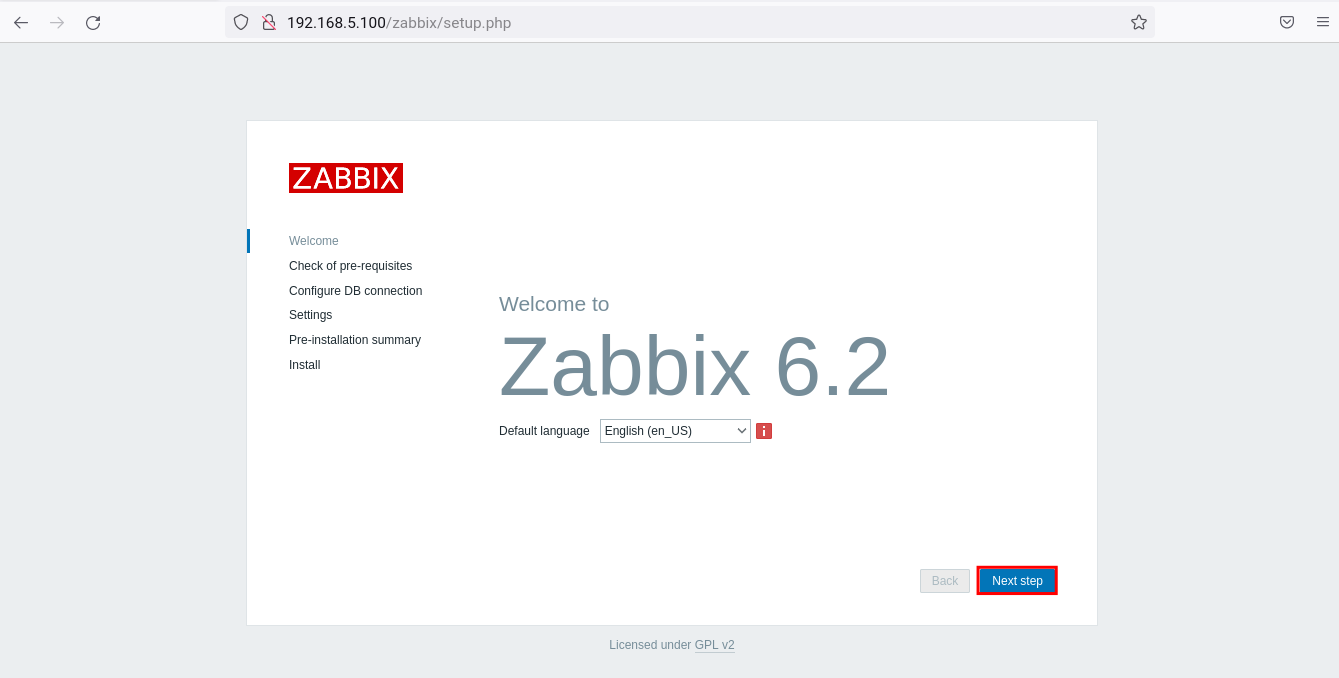
Open your web browser and call up the IP address of the Zabbix server followed by the path URL “https://vitux.com/zabbix” (i.e.: http://192.168.5.100/zabbix). You should see the welcome page of the Zabbix monitoring tool.
Select the default language for your Zabbix installation and click on“Next step“.
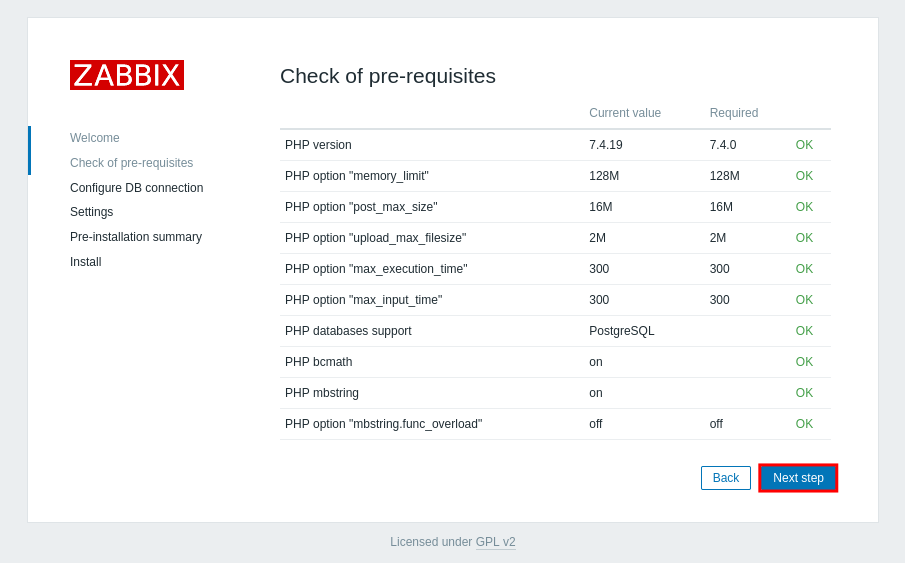
Now the Zabbix web installer will perform a system check for the Zabbix installation. Make sure that the status is“OK” and then click on“Next step” to continue.
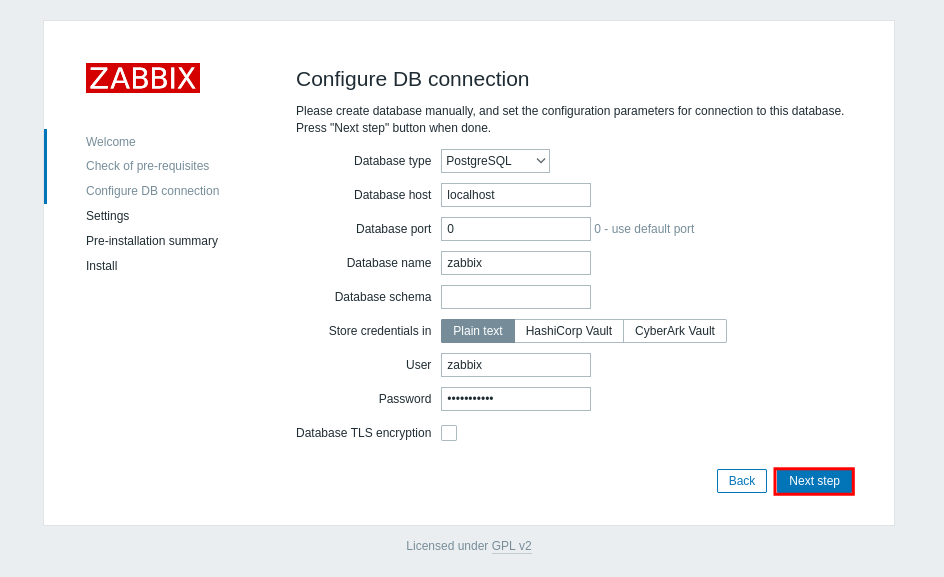
For the database configuration, select“PostgreSQL” as the database type. Then enter the database name, the database user and the password. Click on“Next step” to continue.
If your database configuration is correct, you will see a new page. However, if an error occurs, you should check your database details and check the Zabbix log file under“https://vitux.com/var/log/zabbix“. In addition, you can also check the“auditd” log if an error occurs in connection with SELinux.
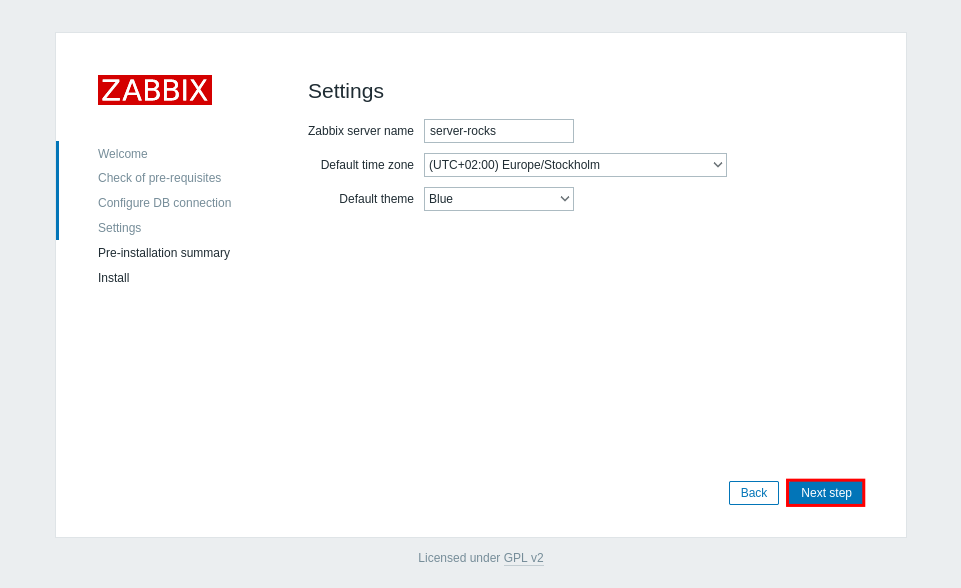
To configure the Zabbix web interface, enter the Zabbix server and select the time zone. Then click on“Next step” again.
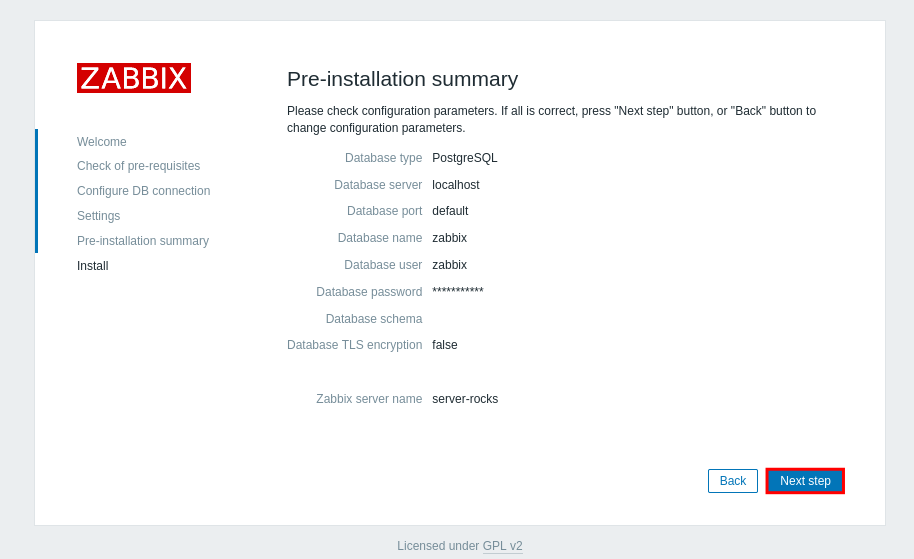
Check the configuration of your Zabbix installation again. When you are finished, click on “Next step” to start the installation of the Zabbix web interface.
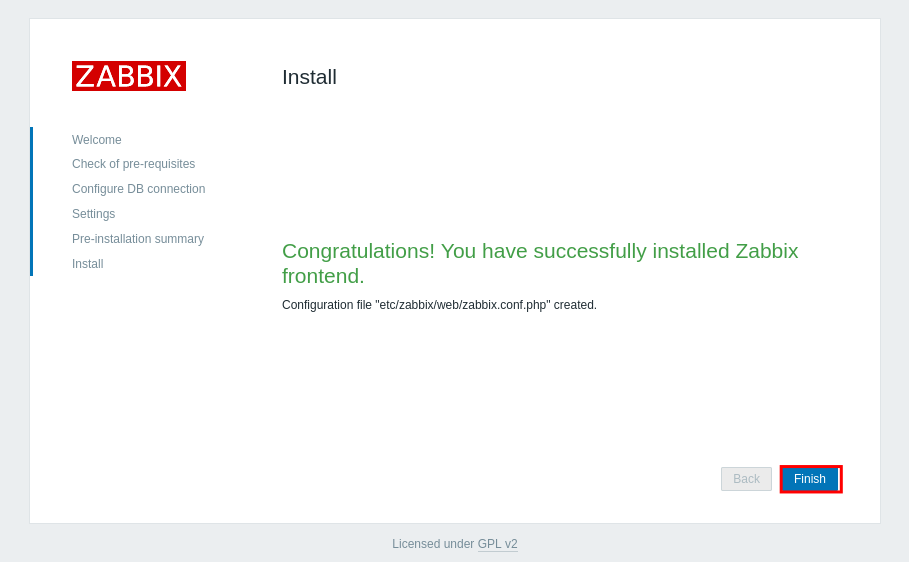
When the Zabbix installation is complete, you will see a message like“Congratulations! You have successfully installed the Zabbix frontend” on your screen. Then click on“Finish” to complete the installation of the web interface.
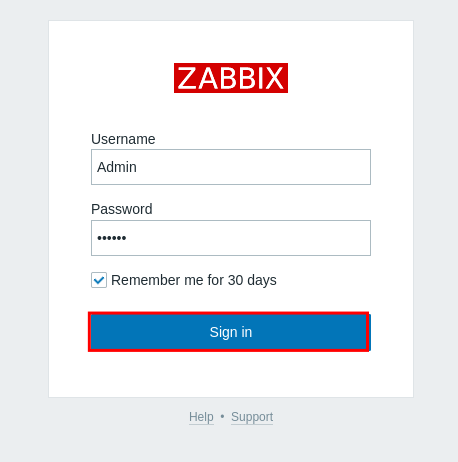
You will now be redirected to the Zabbix login screen. Enter the Zabbix default user“Admin” and the password“zabbix“. Then click on“Login” to log in to the Zabbix administration dashboard.
You should see the default Zabbix administration dashboard as shown in the screenshot below.
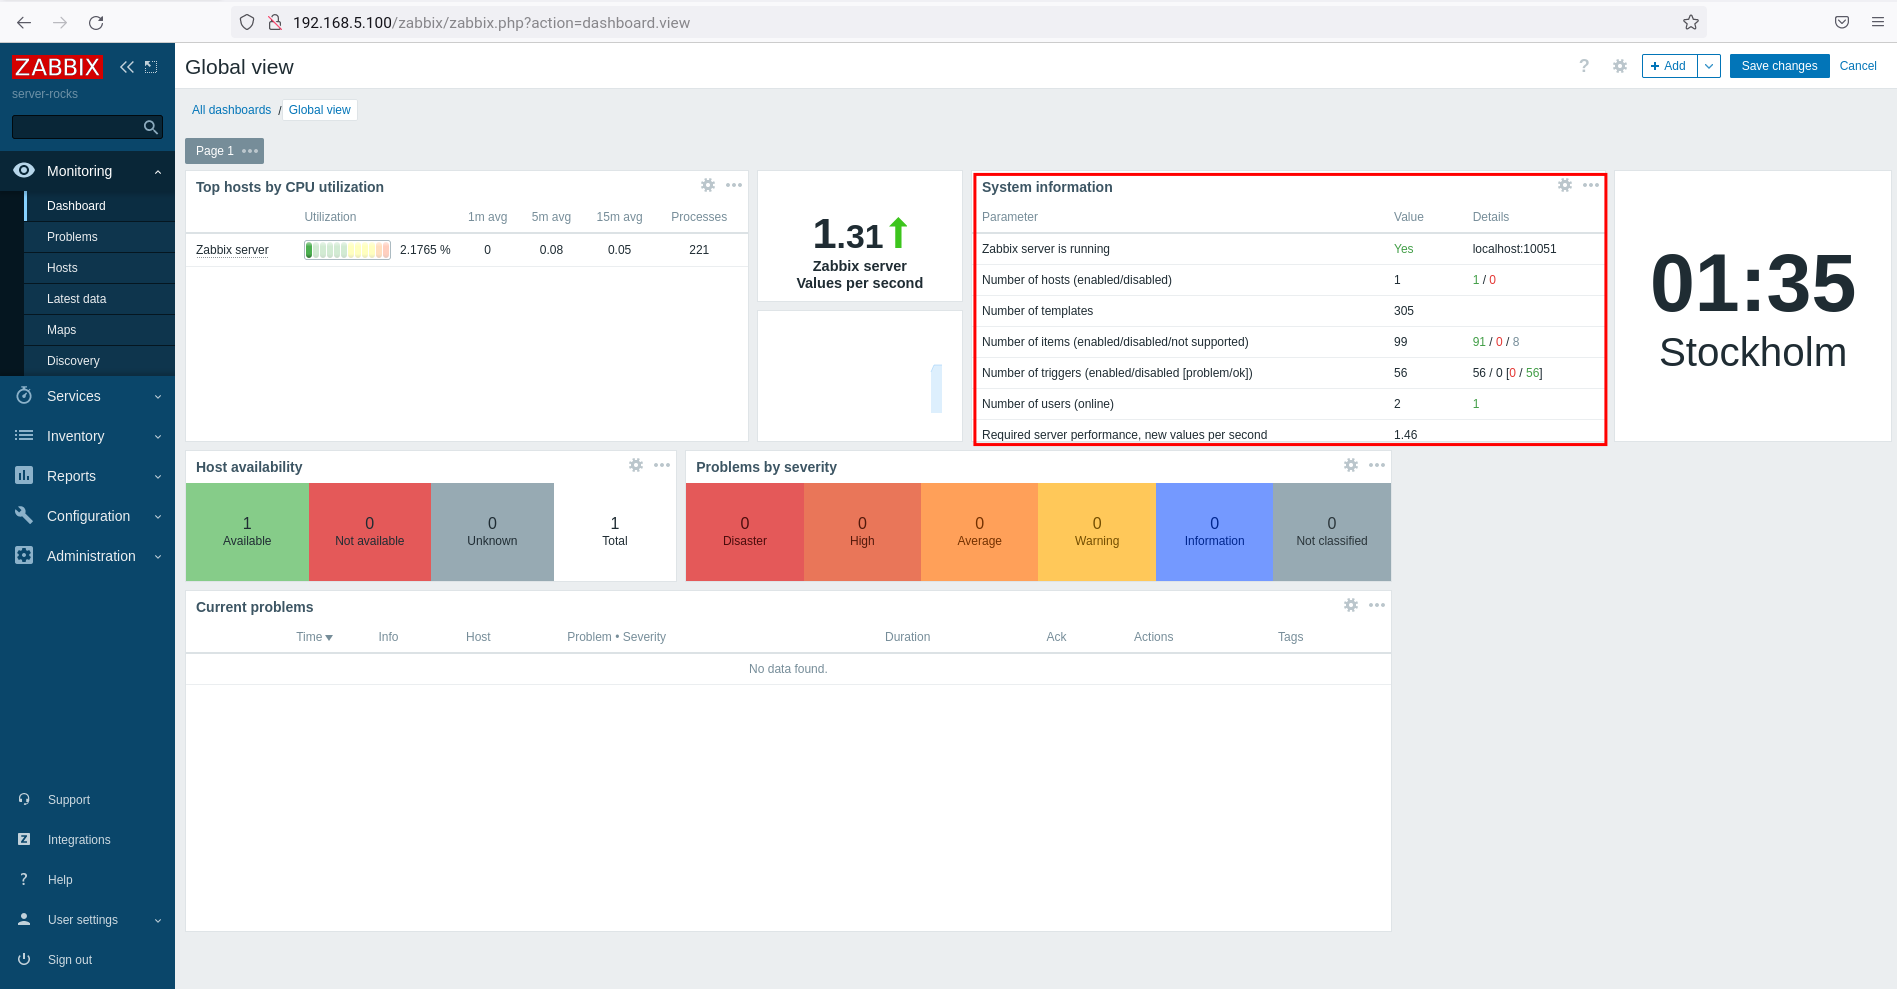
You have completed the installation of the Zabbix web interface.
Adding a Linux host via the Zabbix agent
There are several methods to add and monitor hosts in Zabbix. You can monitor the host on Zabbix via the Zabbix Agent, SNMP protocol, IPMI and JMX. In this example, you will monitor the Linux host via the Zabbix agent.
To install the Zabbix agent, you need to add the Zabbix repository to your Linux host.
For the Debian distribution, add the Zabbix repository using the command below.
wget https://repo.zabbix.com/zabbix/6.2/debian/pool/main/z/zabbix-release/zabbix-release_6.2-1 debian11_all.deb
sudo dpkg -i zabbix-release_6.2-1 debian11_all.deb
sudo apt update
The following command applies if you want to monitor an Ubuntu Linux host.
wget https://repo.zabbix.com/zabbix/6.2/ubuntu/pool/main/z/zabbix-release/zabbix-release_6.2-1 ubuntu22.04_all.deb
sudo dpkg -i zabbix-release_6.2-1 ubuntu22.04_all.deb
sudo apt update
For RHEL/CentOS-based distributions, add the Zabbix repository with the command below.
sudo rpm -Uvh https://repo.zabbix.com/zabbix/6.2/rhel/8/x86_64/zabbix-release-6.2-1.el8.noarch.rpm
sudo dnf repolist
sudo dnf makecache
Install the“zabbix-agent” package with the command below. Use the apt command for Debian/Ubuntu-based systems or the dnf command for RHEL/CentOS-based distributions.
sudo apt install zabbix-agent
or
sudo dnf install zabbix-agent
When the installation is complete, edit the Zabbix agent configuration file“https://vitux.com/etc/zabbix/zabbix_agentd.conf” with the command below.
sudo nano /etc/zabbix/zabbix_agentd.conf
Uncomment the “Server” and“ServerActive” options and enter the IP address of the Zabbix server.
Server=IP-ADDRESS-of-ZABBIX-SERVER
ServerActive=IP-ADDRESS-of-ZABBIX-SERVER
Change the “Hostname” configuration to your Linux host and change the“HostnameItem” to“system.hostname“. In this example, the Linux host will use the hostname“linux-host1“.
Hostname=linux-host1
HostnameItem=system.hostname
Save and close the file when you are finished.
Now start the service“zabbix-agent” with the following systemctl command.
sudo systemctl start zabbix-agent
sudo systemctl enable zabbix-agent
You must also open the Zabbix agent port “10050/tcp” on the Linux target computer. For Ubuntu/Debian systems you can use the command ufw, for RHEL/CentOS-based distributions the command “firewall-cmd”.
sudo ufw allow 10050/tcp
sudo ufw status
or
sudo firewall-cmd --add-port=10050/tcp --permanent
sudo firewall-cmd --reload
Go to the Zabbix Administration Dashboard. Click on“Monitoring” > “Hosts” > “Create Host“.
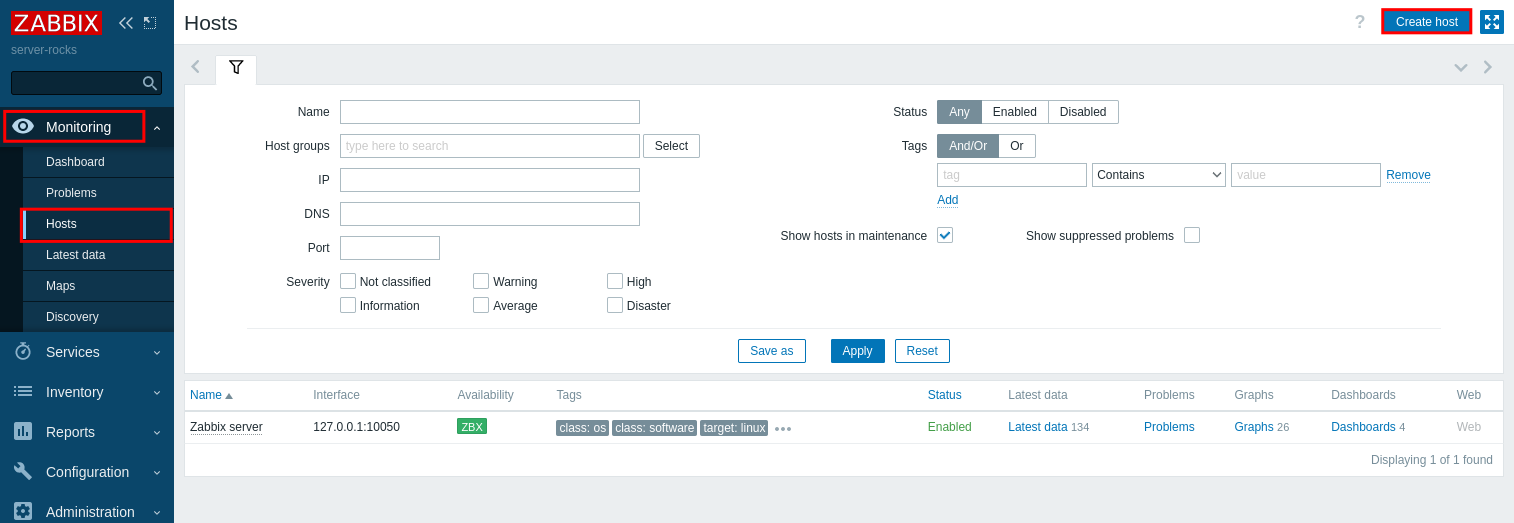
Enter the host configuration details as described below:
- Hostname: We use the system hostname linux-host1.
- Templates: We use the template “Linux by Zabbix Agent”.
- Host groups: This section will be called “Linux server”.
- Interfaces: We will use “Agent” with the destination IP address of “linux-host1” with IP address “192.168.5.120” and default port “10050”.
- Enabled: Check the box to activate this host.
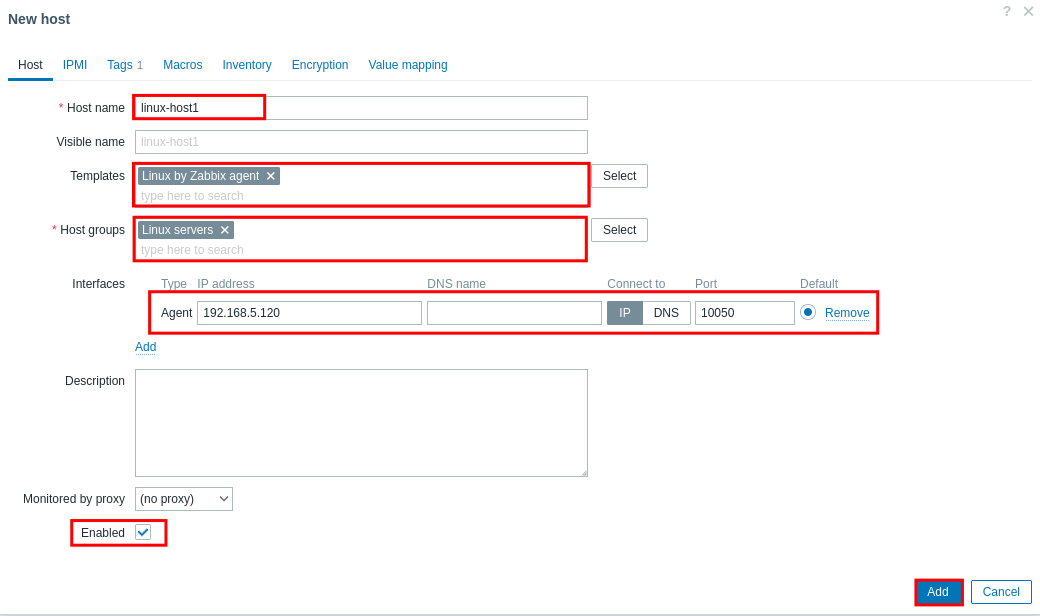
Switch to the “Tags” tab and create a new tag. In this example, we will create a new tag“OS” with the value“RHEL“.

Click on“Add” to confirm and add the host.
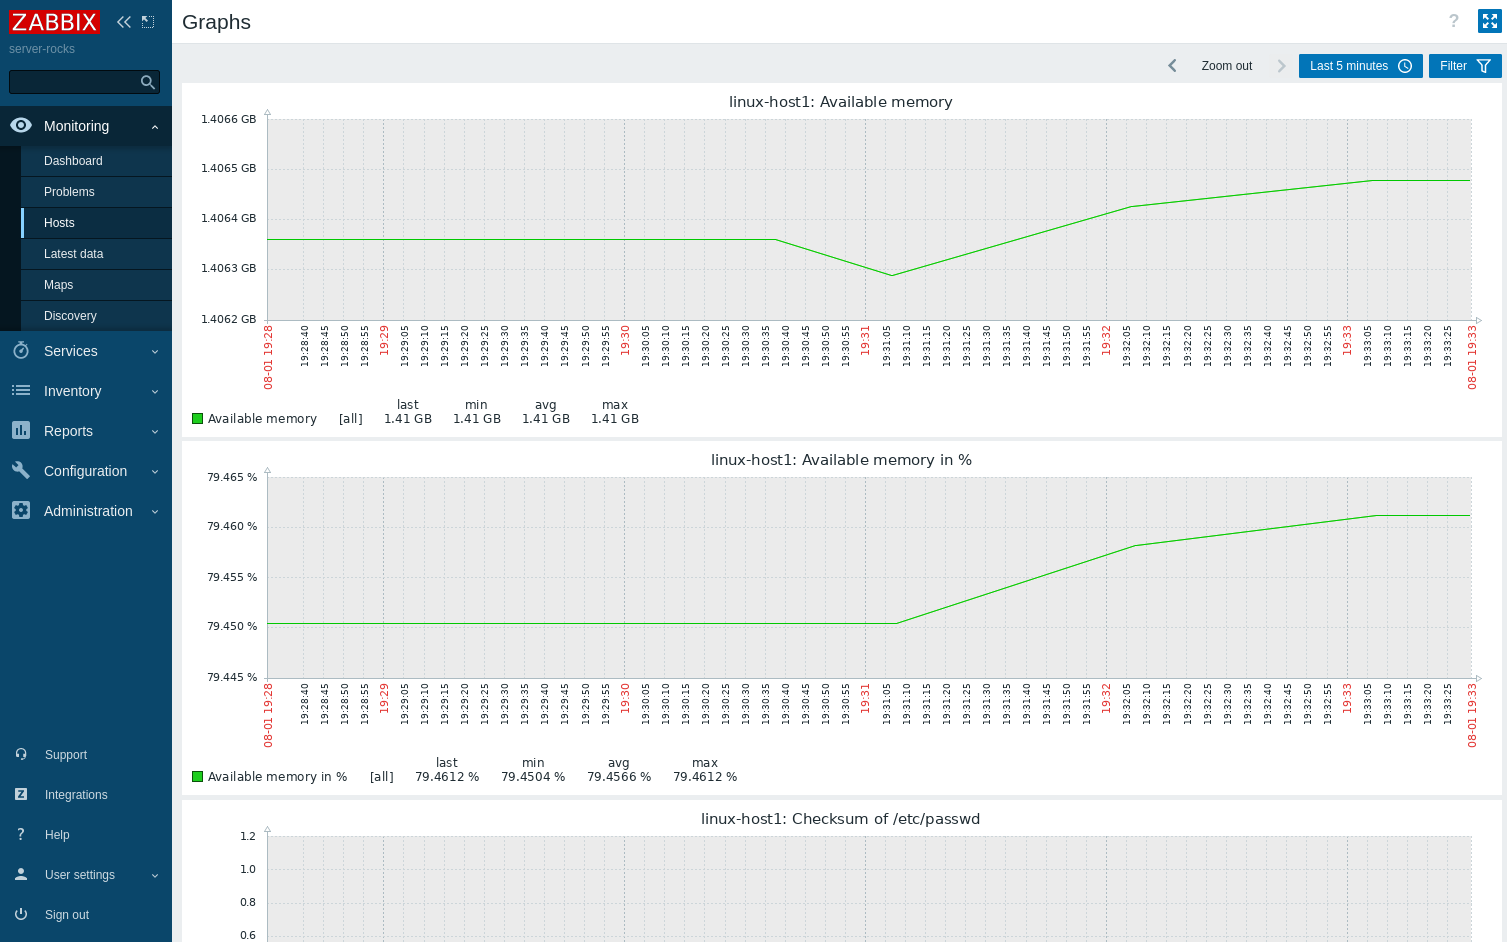
You can then see that the host“linux-host1” has been added to Zabbix monitoring via the Zabbix agent.
In the “Availability” section, you will see the green status “ZBX”, which means that the host is running without any problems. If an error occurs on your host, the “Availability” section will turn red.

Below you can see the current graphic of the“linux-host1” host.
Conclusion
In this tutorial you have learned how to install and configure the Zabbix Monitoring Solution with PostgreSQL as database backend and Apache2/httpd as web server on Rocky Linux. You also learned the basic configuration of the PostgreSQL server to set up authentication for PostgreSQL users. Finally, you learned how to add and monitor Linux hosts with the Zabbix Monitoring Solution via the Zabbix Agent.
