
Monitoring your virtualized server environments is the ideal way to ensure optimal utilization of hardware resources and the best possible performance of your IT infrastructure. VMware comes with some basic on-board monitoring tools, but you should rather go for a vendor-agnostic monitoring tool that is also able to monitor other IT assets such as server hardware and networks.
Kick-start your VMware monitoring with just a few simple steps
In this tutorial, I will show you how to monitor your vSphere with the open-source monitoring tool Checkmk in just a few minutes. This will help you to get started with your VMware monitoring. You do not need any monitoring experience to follow the steps below. After finishing this tutorial, you get the basics of Checkmk’s rule-based monitoring approach and will be ready to take on further monitoring challenges.
Prerequisites
You need a running Checkmk environment. For this tutorial, I am using the Checkmk Raw Edition (I am using version 2.1.0.p14), which you can download from the Checkmk website. You can follow this tutorial on how to get started with Checkmk or check out this video to start your monitoring.
As an example, I will use VMware vCenter, in which I have created three virtual machines. However, Checkmk is really scalable, and it doesn’t really matter how many VMs you have – the effort is almost the same. Checkmk leverages the VMware API to get all the available information from vCenter and your ESXi hosts.
To enable Checkmk to retrieve the data, you need a read-only user with permissions for the entire inventory of your VMware vCenter server. Using an account with read-only permissions is security sensitive. You should never grant additional rights for your monitoring user account. In my case, I called the vCenter user ‘checkmk’ and I am using the vSphere default domain ‘vsphere.local’. Thus, later in Checkmk, I will use ‘[email protected]’ to grant Checkmk access.
Technically, you do not need a naming convention within your VMware environment to follow this tutorial. However, a proper naming policy is extremely essential for a virtualized server environment, especially if you want to drill deeper into VMware monitoring. Thus, I recommend using fully-qualified DNS names (FQDN). This blog about naming concepts provides a guide on how to find a proper naming convention. In my example, my vCenter server is called ‘vm-vcenter-01.lan.domain.net’.
Step 1: Add vCenter as a host to the monitoring
All it takes is three simple steps, so let us get started. Open your Checkmk site and create a folder for your VMs.
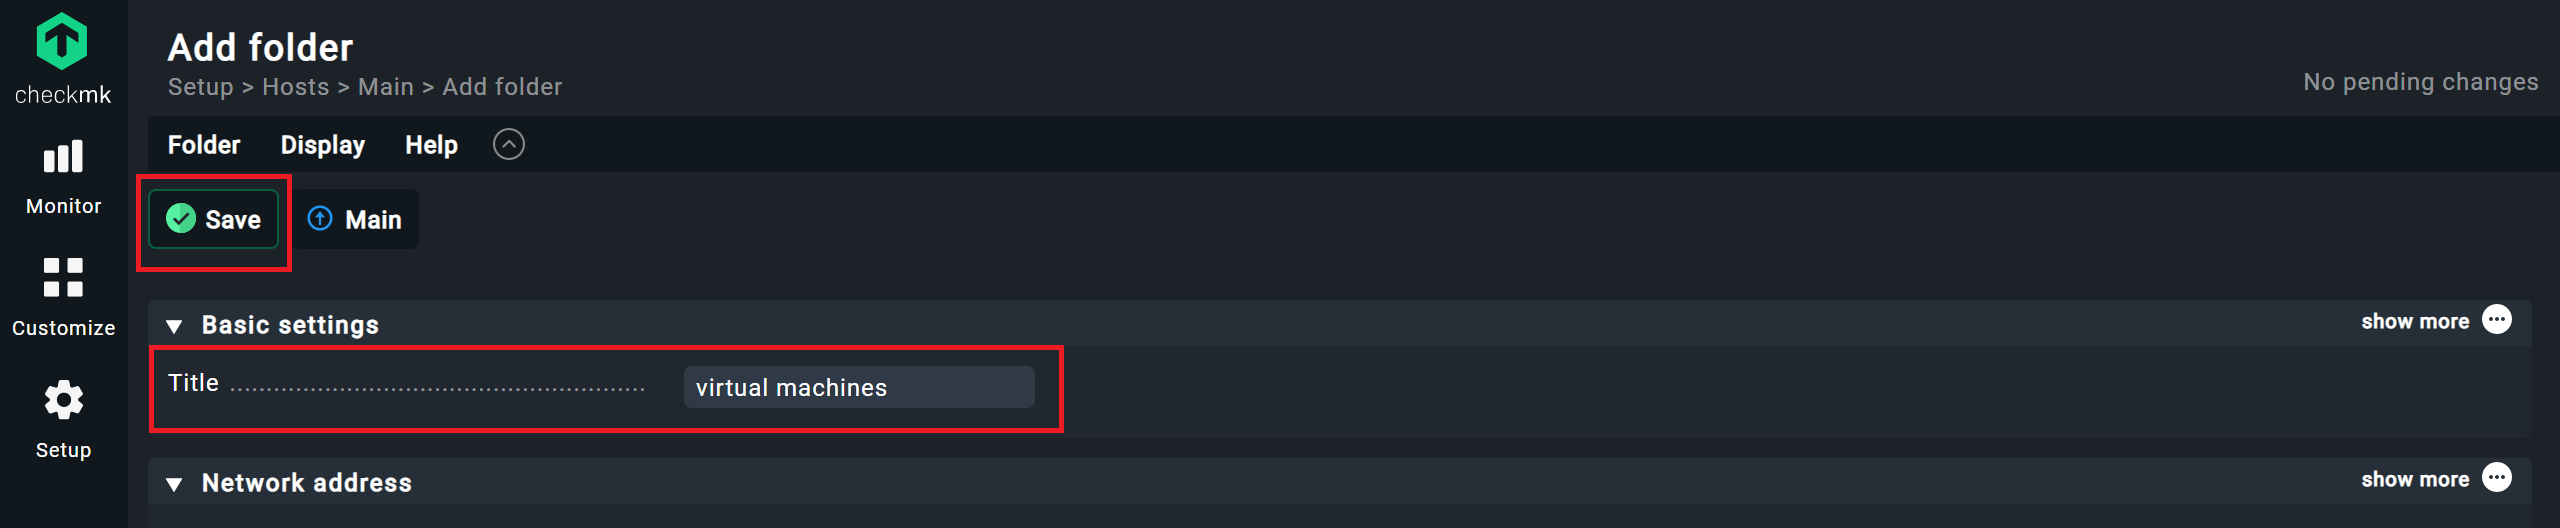
- Go to Setup -> All hosts and click on Add folder.
- Pick a name of your choice under Title. In my example, I went for ‘virtual machines’.
- You can leave all the configuration settings. Click on Save.
Folder structures are an easy, yet powerful way to organize your monitoring. Thus, you should have hosts of the same kind together in one folder. In this tutorial, the vCenter server is the only VM you add, but you might add more in the future.
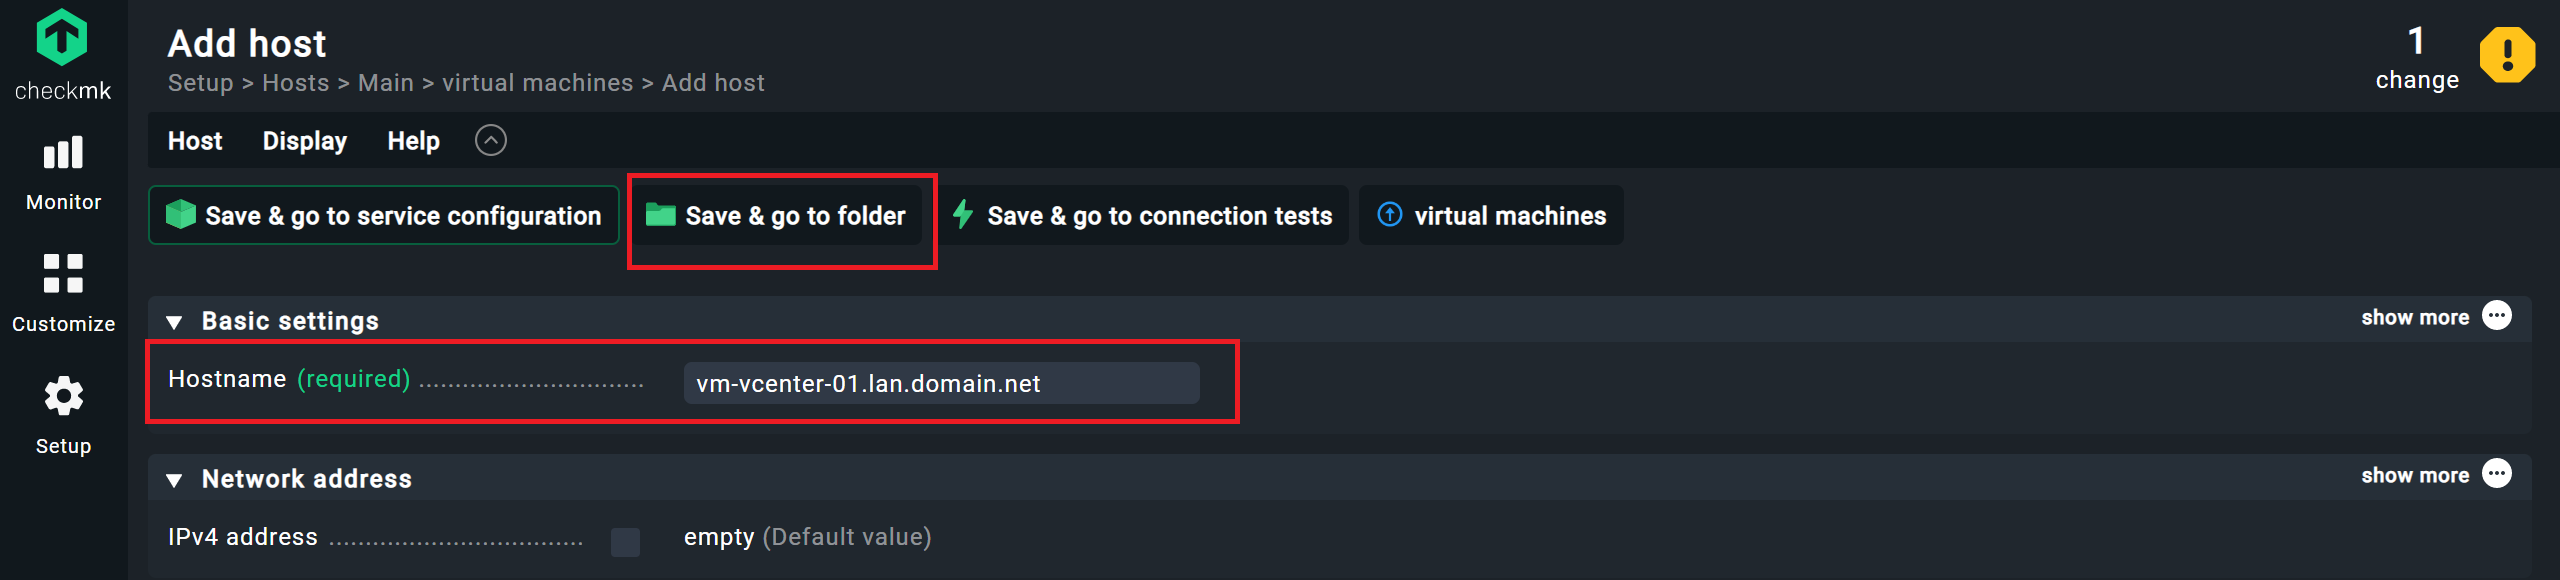
- Now, go again to Setup -> All hosts and click on your folder.
- Click on Add host.
- Under Hostname, enter the display name of vCenter. For me, that is ‘vm-vcenter-01.lan.domain.net’.
- In case you do not use DNS names, you would have to check the box after IPv4 address and add the IP address of your vCenter server. I do not have to do that, and really recommend using DNS names.
- You can click on Save & go to folder.
Step 2: Prepare the VMware monitoring rule
Checkmk cannot gather data from vCenter yet, because it does not have access to the VMware API. In this step, you will use the vSphere monitoring rule in Checkmk to decide which information Checkmk should collect.
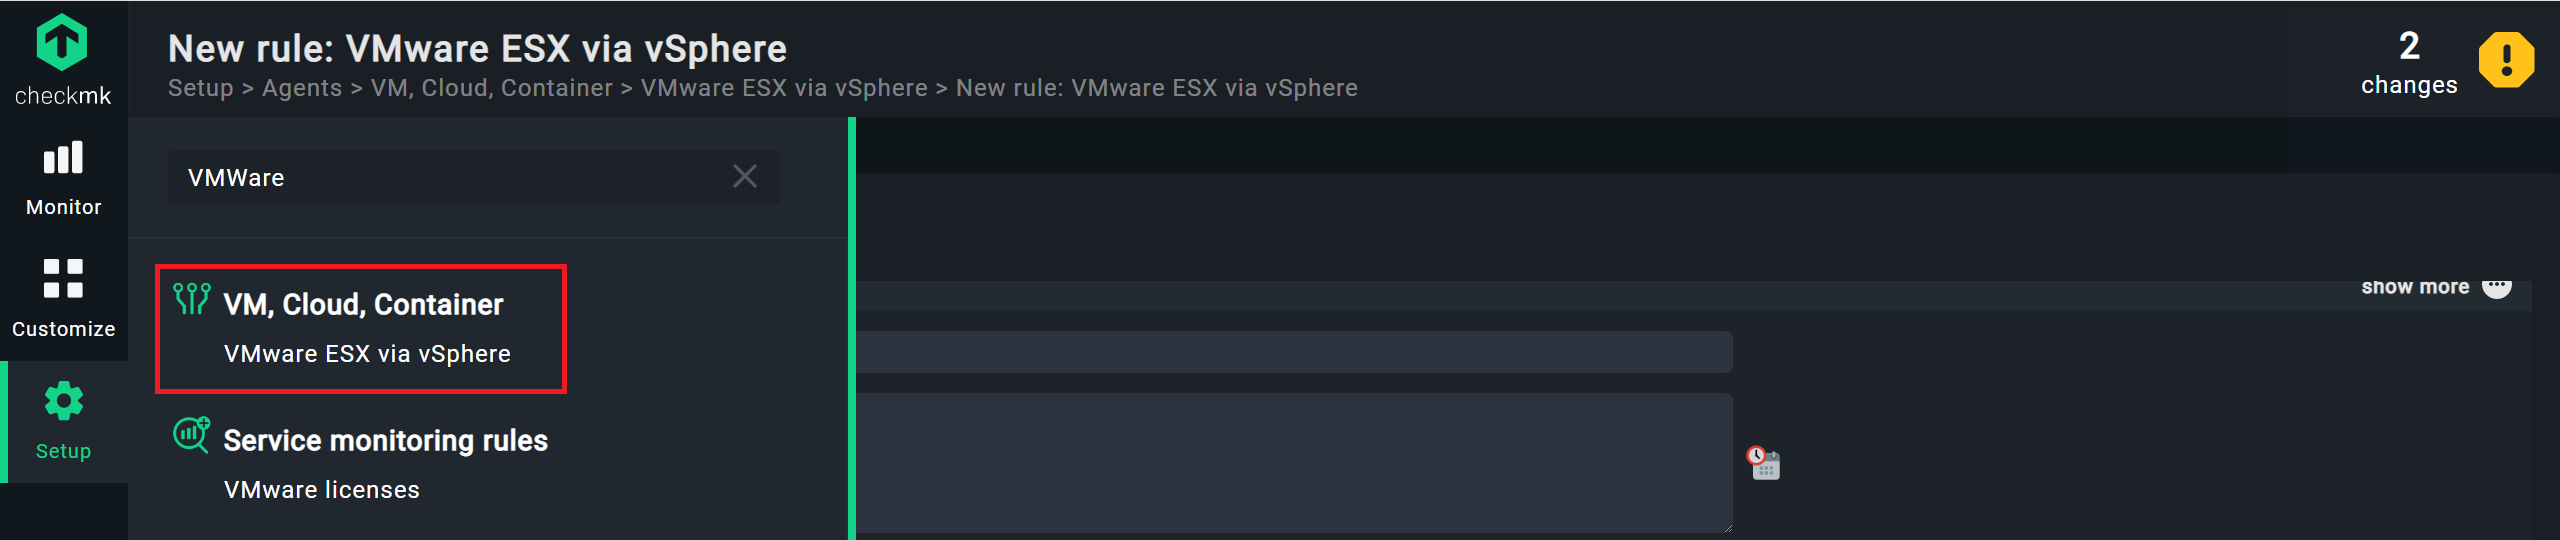
- Click on Setup again and search for “vmware”.
- Then click on the rule “VMWare ESX via vSphere”.
- Click Add rule.
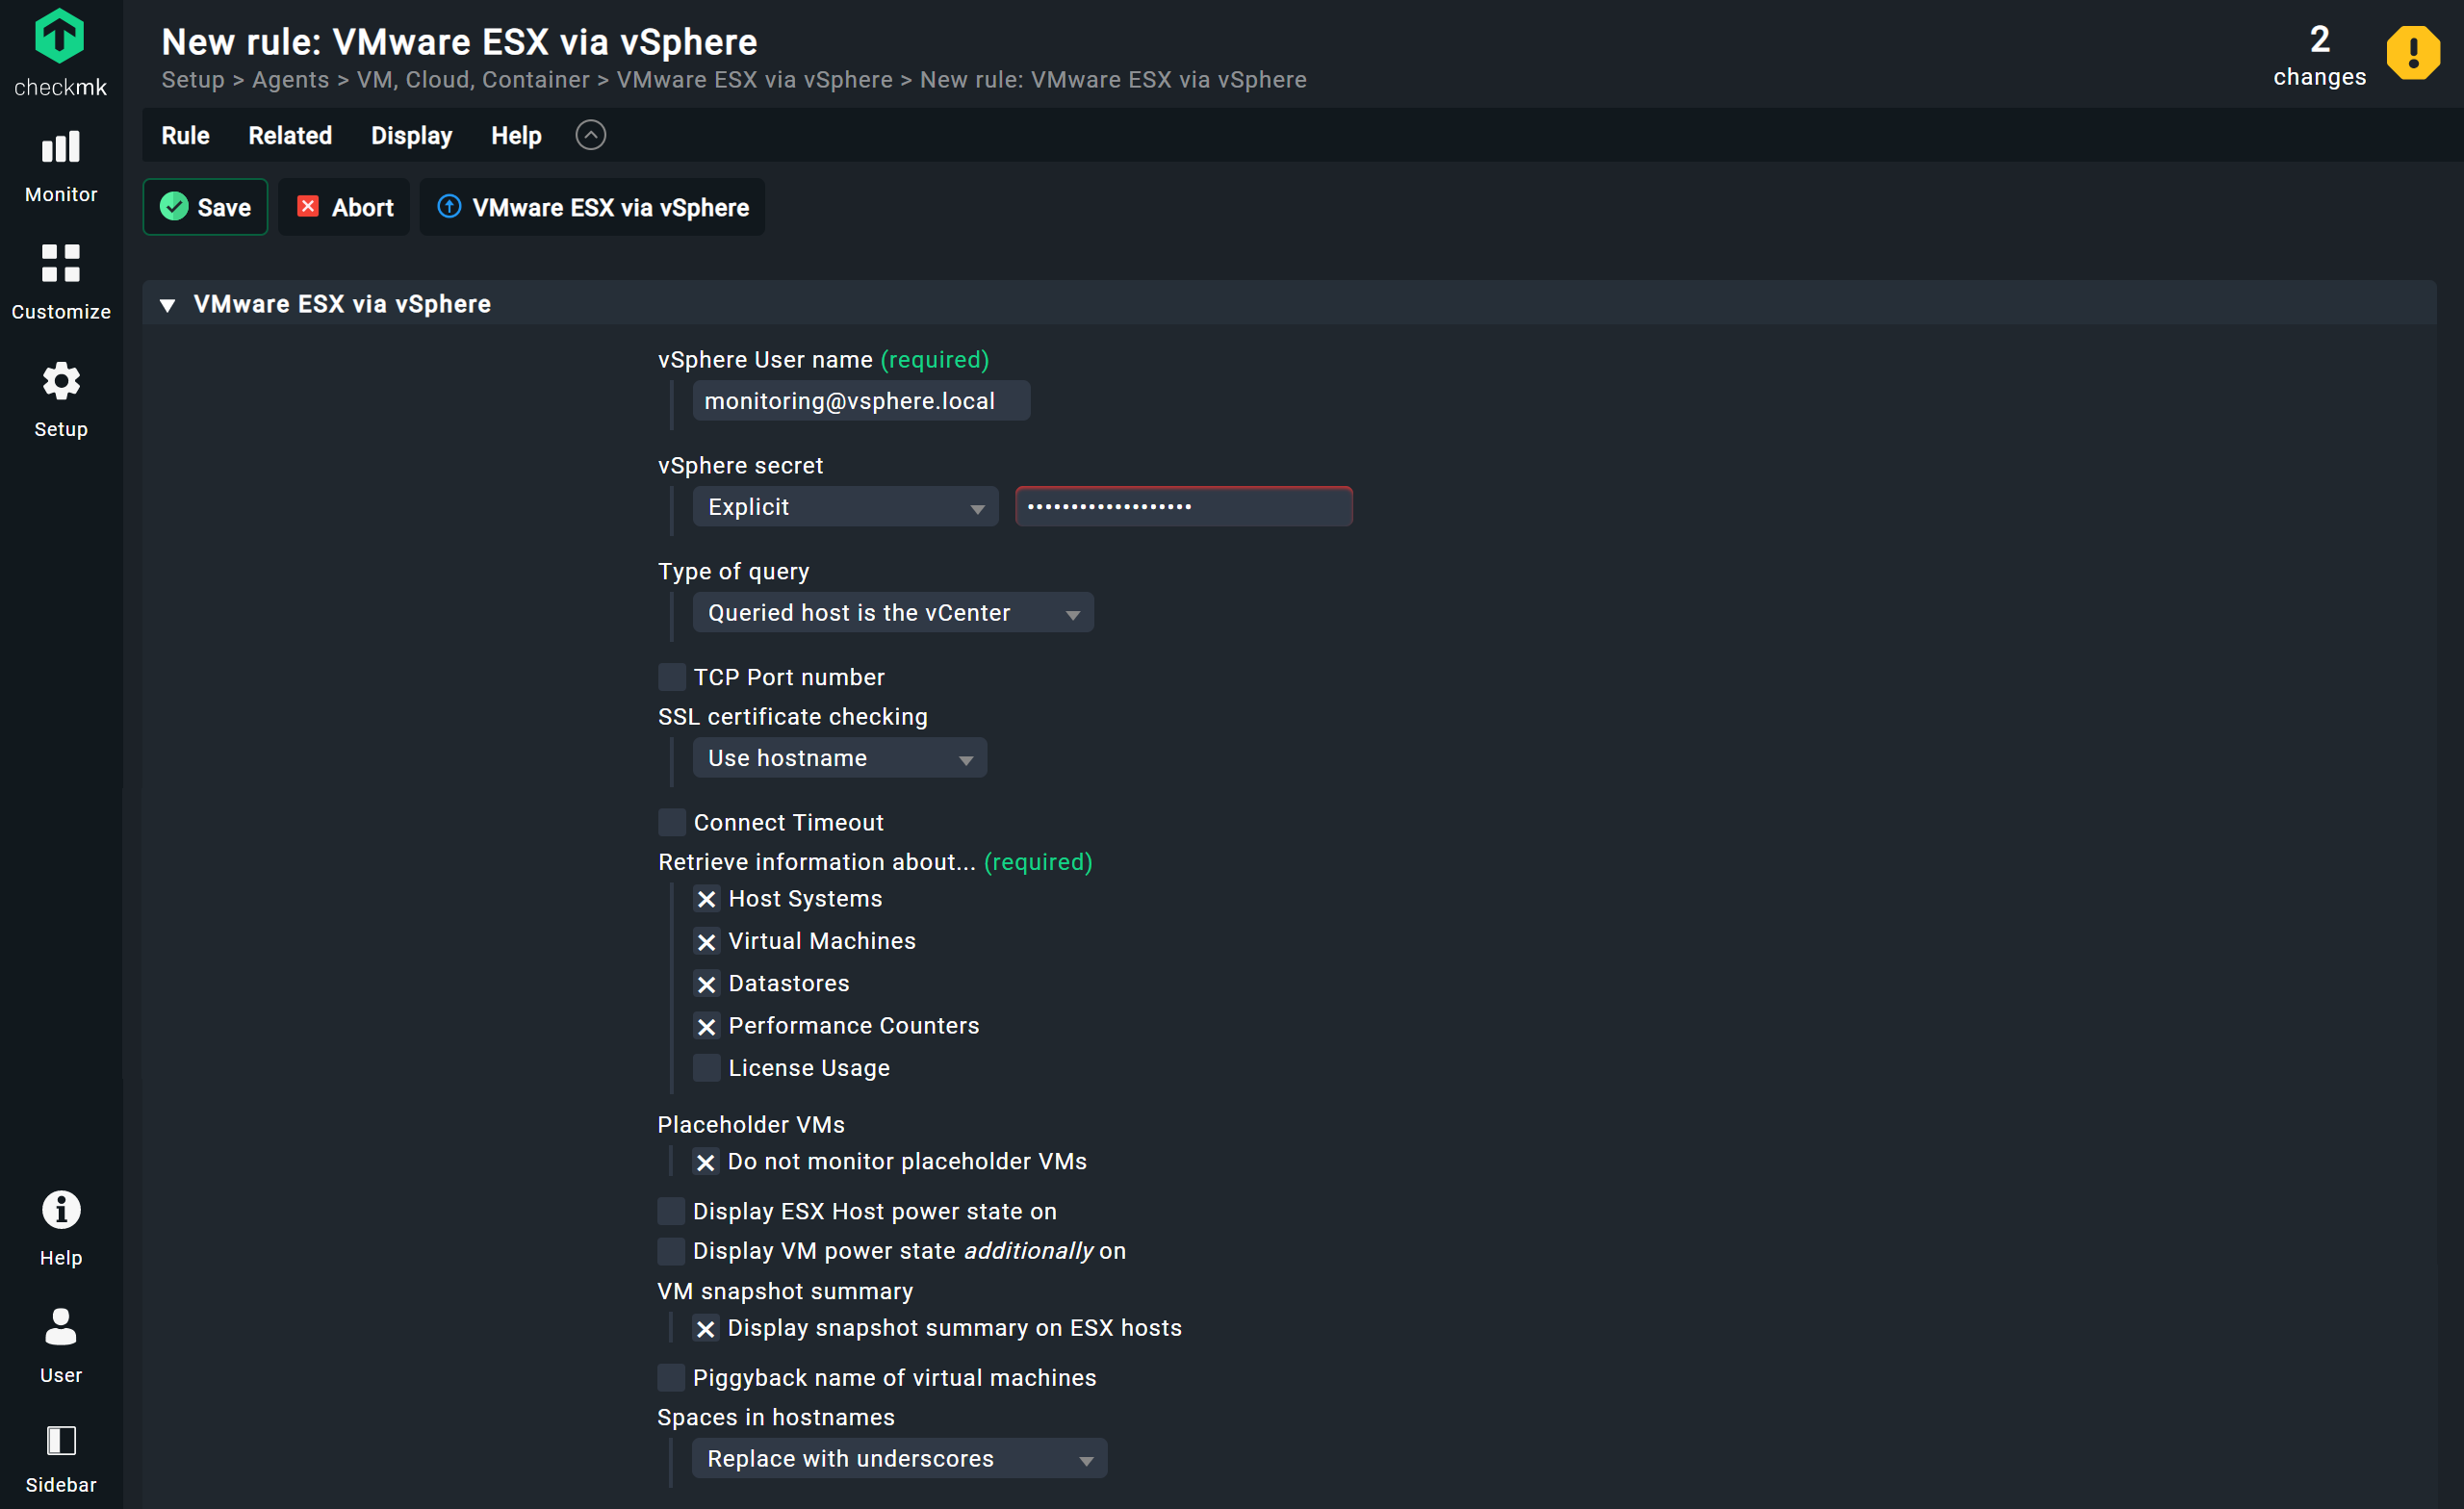
- You do not need to add anything under Rule Properties, but adjust a few things under VMware ESX via vSphere:
- Under vSphere User name, enter your prepared vCenter user account, in my case ‘[email protected]’, followed by the password under vSphere secret.
- Since you are using VMware vCenter as the data source, you have to set Type of query to ‘Queried host is vCenter’.
- For SSL certificate checking, the default ‘Use hostname’ setting assumes you are using a certificate issued by a CA in vCenter. If this is not the case, you would have to select the ‘Deactivated’ option. Keep in mind that by default, VMware vCenter starts with HTTPS and a self-signed certificate.
- You can leave the Connect Timeout. With this option, you can tell Checkmk to abort in the event of excessive response times, but that is usually not necessary.
- Under Retrieve information about, decide for which systems Checkmk should retrieve data from vCenter.
- ‘Host Systems’ monitors your ESXi hosts over vCenter. Leave this option checked, but I recommend adding the ESXi hosts as separate monitoring hosts later on, as well. This way, you get all insights on your ESXi hosts and also can get insights, even if your vCenter server stops working.
- ‘License Usage’ allows you to retrieve the overall status of vCenter licenses in use. This is only required in larger datacenters with over provisioned licenses, so I do not use this option here.
- Do not monitor placeholder VMs is checked by default and should be kept checked.
- Leave the options for Display ESX Host power state and Display VM power state additionally on disabled. You should, however, enable the VM snapshot summary option here, since forgotten snapshots can sometimes lead to serious problems.
- With Piggyback name of virtual machines you can adjust how Checkmk is dividing the information from vCenter to other monitoring hosts. You do not need that option for this tutorial, because you only add the vCenter server as host. Just leave it as it is.
The last option is related to the Piggyback mechanism. This feature allows Checkmk to gather data for monitoring hosts not from them directly, but through another host. vCenter can, for example, provide monitoring data for your VMs. Once the data is in your monitoring, Checkmk needs to find the right host for each piece of data and assumes by default that the host name in Checkmk is the same as the display name in VMware.
However, Checkmk does not allow spaces in host names. If display names have spaces, Checkmk will replace them with underscores by default. With Piggyback name of virtual machines, you can tell Checkmk to cut off the host name after a space sign instead.
For me, the configuration looks like this:
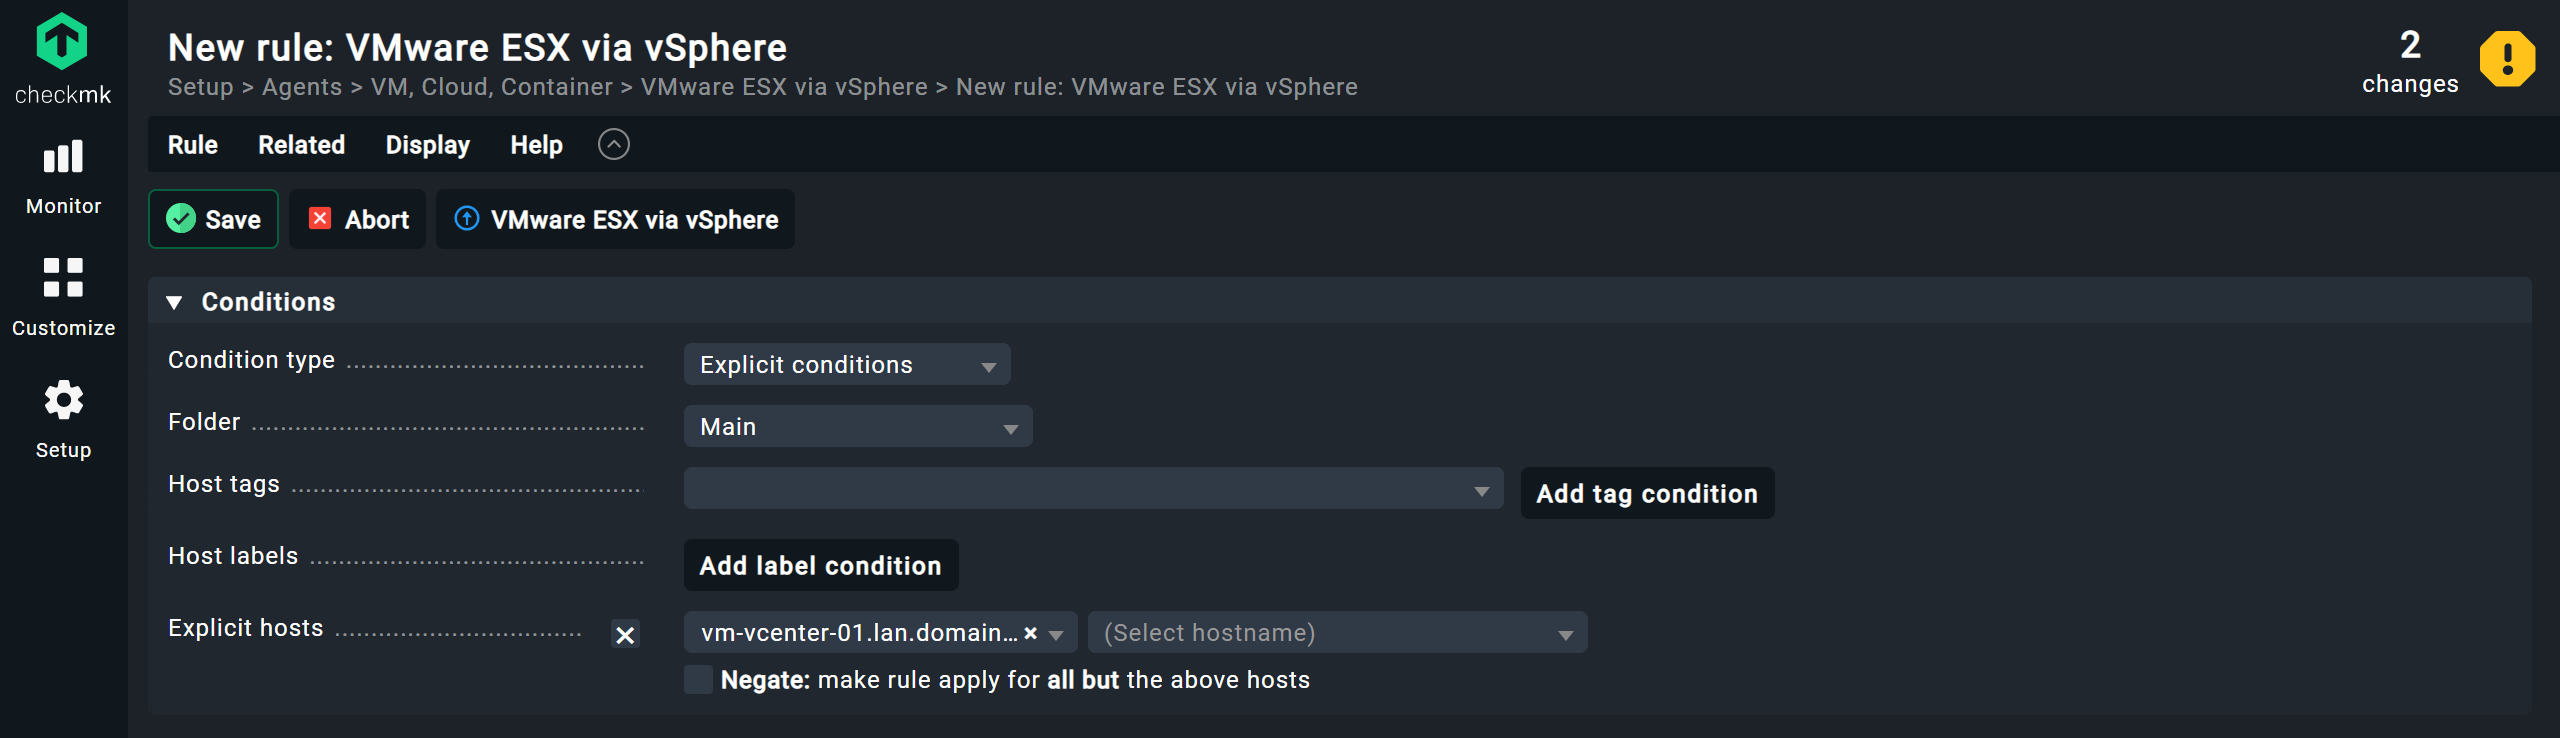
- Under Conditions, you decide for which host, or group of hosts, you want to apply this rule. Since you only want to use it for your vCenter server, tick the checkbox under ‘Explicit hosts’ and select the host of your vCenter server.
- Click Save to save the rule.
Step 3: Run the automated service discovery
Your vCenter host is now ready to retrieve monitoring data via the VMware API. For this, you should start the automatic service discovery in Checkmk for your vCenter host.
- Go to Setup -> Hosts and click on your folder with the vCenter host in it.
- Find your vCenter host. Click on the yellow icon right in the middle of the toolbar.
- Wait for automatic service discovery to be completed and click Accept all. This moves all detected services into the monitoring.
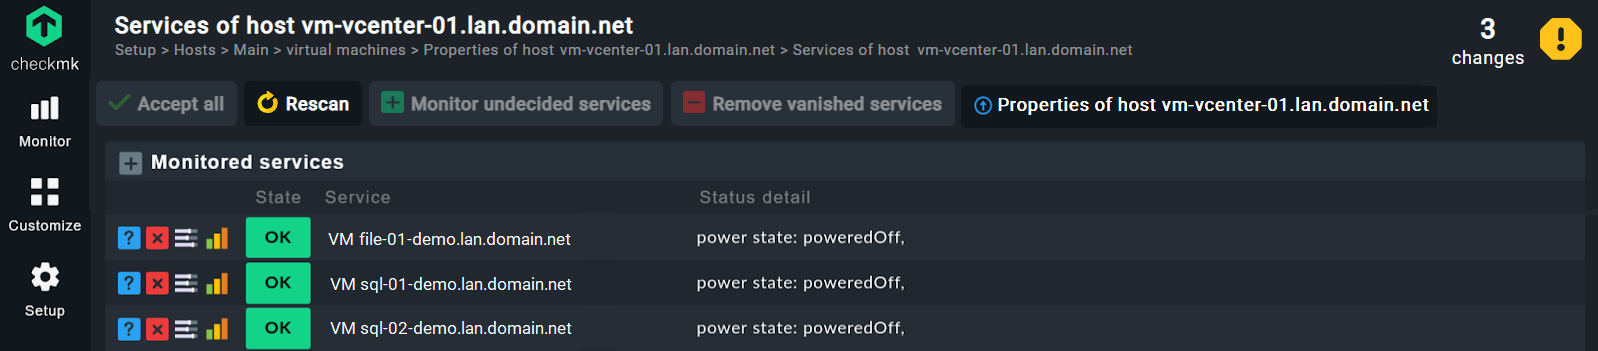
My three VMs have been detected:
Checkmk detects all VMs configured in vCenter, and maybe more than that. Be aware that the VMware API does not allow differentiating between VMs and templates, for example. Checkmk would see them as switched off VMs, as well. Thus, the services will be on WARN and I suggest that you deactivate these services by clicking on the X symbol, so they do not cause any false alerts.
- Next, click on the yellow icon with the exclamation mark in the upper right corner. You should then see the ‘pending changes’.
- Click Activate on selected sites.
Your vCenter server is now monitored. It is time to check it out:
- If you go to Monitor -> All hosts, you find your vCenter.
- Click on it to see its services, including a service for each VM.
Next steps to a holistic VMware monitoring
And you made it, this tutorial ends here! You covered the first basic step of holistic monitoring of your VMware environment, but your VMware monitoring has a few shortcomings. For instance, you do not monitor your server hardware and also did not include the information provided by your ESXi hosts. Also, your VMs are merely monitored as services of your vCenter host and are not configured as independent monitoring hosts. You literally just check if they are online, but you actually should drill a lot deeper.
This guide about monitoring VMware with Checkmk will show you all the steps necessary to monitor VMware properly. You actually already took an important step, but there is more to do. If you want to know why VMware monitoring is such a big deal, I can recommend this page with more general information about server monitoring.


