Let’s talk about the thread dump, and how to analyze it.
We will also discuss how it helps to pinpoint the issues and some of the analyzer you can use.
What is Thread?
A process is a computer program which is loaded into the computer’s memory and is under execution. It can be executed by a processor or a set of processors. A process is described in memory with important information such as variable stores, file handles, the program counter, registers, and, signals, and so on.
A process can consist of many lightweight processes called threads. This helps to achieve parallelism wherein a process is divided into multiple threads. This results in better performance. All the threads within a process share the same memory space and are dependent on each other.
Thread Dumps
When the process is executing, we can detect the current state of execution of the threads in the process using thread dumps. A thread Dump contains a snapshot of all the threads active at a particular point during the execution of a program. It contains all relevant information about the thread and its current state.
A modern application today involves multiple numbers of threads. Each thread requires certain resources, performs certain activities related to the process. This can boost the performance of an application as threads can utilize available CPU cores.
But there’s are trade-offs, e.g., sometimes multiple threads may not coordinate well with each other and a deadlock situation may arise. So, if something goes wrong, we can use thread dumps to inspect the state of our threads.
Thread dump in Java
A JVM thread Dump is a listing of the state of all threads that are part of the process at that particular point of time. It contains information about the thread’s stack, presented as a stack trace. As it is written in plaintext, the contents can be saved for reviewing later. Analysis of thread dumps can help in
- Optimizing JVM performance
- Optimizing application performance
- Diagnosing problems, e.g. a deadlock, thread contention, etc.
Generation of Thread Dumps
There are many ways to generate thread dumps. Below are some JVM based tools and can be executed from the command line/terminal (CLI tools) or the /bin (GUI tools) directory of the installation folder of Java.
Let’s explore them.
#1. jStack
The simplest way to generate a thread dump is by using jStack. jStack ships with JVM and can be used from the command line. Here, we need the PID of the process for which we want to generate the thread dump. To get PID we can use jps command as shown below.
jps -l
jps lists down all java process ids.
On Windows
C:Program FilesJavajdk1.8.0_171bin>jps -l
47172 portal
6120 sun.tools.jps.Jps
C:Program FilesJavajdk1.8.0_171bin>
On Linux
[[email protected] ~]# jps -l
1088 /opt/keycloak/jboss-modules.jar
26680 /var/lib/jenkins/workspace/kyc/kyc/target/kyc-1.0.jar
7193 jdk.jcmd/sun.tools.jps.Jps
2058 /usr/share/jenkins/jenkins.war
11933 /var/lib/jenkins/workspace/admin-portal/target/portal-1.0.jar
[[email protected] ~]#
As we can see here, we get a list of all running java processes. It contains the local VM id for the running java process and the name of the application in columns one and two respectively. Now, to generate the thread dump, we use the jStack program with –l flag which creates a long listed output of the dump. We can also pipe the output to some text file of our choice.
jstack -l 26680
[[email protected] ~]# jstack -l 26680
2020-06-27 06:04:53
Full thread dump Java HotSpot(TM) 64-Bit Server VM (25.221-b11 mixed mode):

"Attach Listener" #16287 daemon prio=9 os_prio=0 tid=0x00007f0814001800 nid=0x4ff2 waiting on condition [0x0000000000000000]
   java.lang.Thread.State: RUNNABLE

   Locked ownable synchronizers:
        - None

"logback-8" #2316 daemon prio=5 os_prio=0 tid=0x00007f07e0033000 nid=0x4792 waiting on condition [0x00007f07baff8000]
   java.lang.Thread.State: WAITING (parking)
        at sun.misc.Unsafe.park(Native Method)
        - parking to wait for   (a java.util.concurrent.locks.AbstractQueuedSynchronizer$ConditionObject)
        at java.util.concurrent.locks.LockSupport.park(LockSupport.java:175)
        at java.util.concurrent.locks.AbstractQueuedSynchronizer$ConditionObject.await(AbstractQueuedSynchronizer.java:2039)
        at java.util.concurrent.ScheduledThreadPoolExecutor$DelayedWorkQueue.take(ScheduledThreadPoolExecutor.java:1081)
        at java.util.concurrent.ScheduledThreadPoolExecutor$DelayedWorkQueue.take(ScheduledThreadPoolExecutor.java:809)
        at java.util.concurrent.ThreadPoolExecutor.getTask(ThreadPoolExecutor.java:1074)
        at java.util.concurrent.ThreadPoolExecutor.runWorker(ThreadPoolExecutor.java:1134)
        at java.util.concurrent.ThreadPoolExecutor$Worker.run(ThreadPoolExecutor.java:624)
        at java.lang.Thread.run(Thread.java:748)

   Locked ownable synchronizers:
        - None

"logback-7" #2315 daemon prio=5 os_prio=0 tid=0x00007f07e0251800 nid=0x4791 waiting on condition [0x00007f07bb0f9000]
   java.lang.Thread.State: WAITING (parking)
        at sun.misc.Unsafe.park(Native Method)
        - parking to wait for   (a java.util.concurrent.locks.AbstractQueuedSynchronizer$ConditionObject)
        at java.util.concurrent.locks.LockSupport.park(LockSupport.java:175)
        at java.util.concurrent.locks.AbstractQueuedSynchronizer$ConditionObject.await(AbstractQueuedSynchronizer.java:2039)
        at java.util.concurrent.ScheduledThreadPoolExecutor$DelayedWorkQueue.take(ScheduledThreadPoolExecutor.java:1081)
        at java.util.concurrent.ScheduledThreadPoolExecutor$DelayedWorkQueue.take(ScheduledThreadPoolExecutor.java:809)
        at java.util.concurrent.ThreadPoolExecutor.getTask(ThreadPoolExecutor.java:1074)
        at java.util.concurrent.ThreadPoolExecutor.runWorker(ThreadPoolExecutor.java:1134)
        at java.util.concurrent.ThreadPoolExecutor$Worker.run(ThreadPoolExecutor.java:624)
        at java.lang.Thread.run(Thread.java:748)

   Locked ownable synchronizers:
        - None
#2. jvisualvm
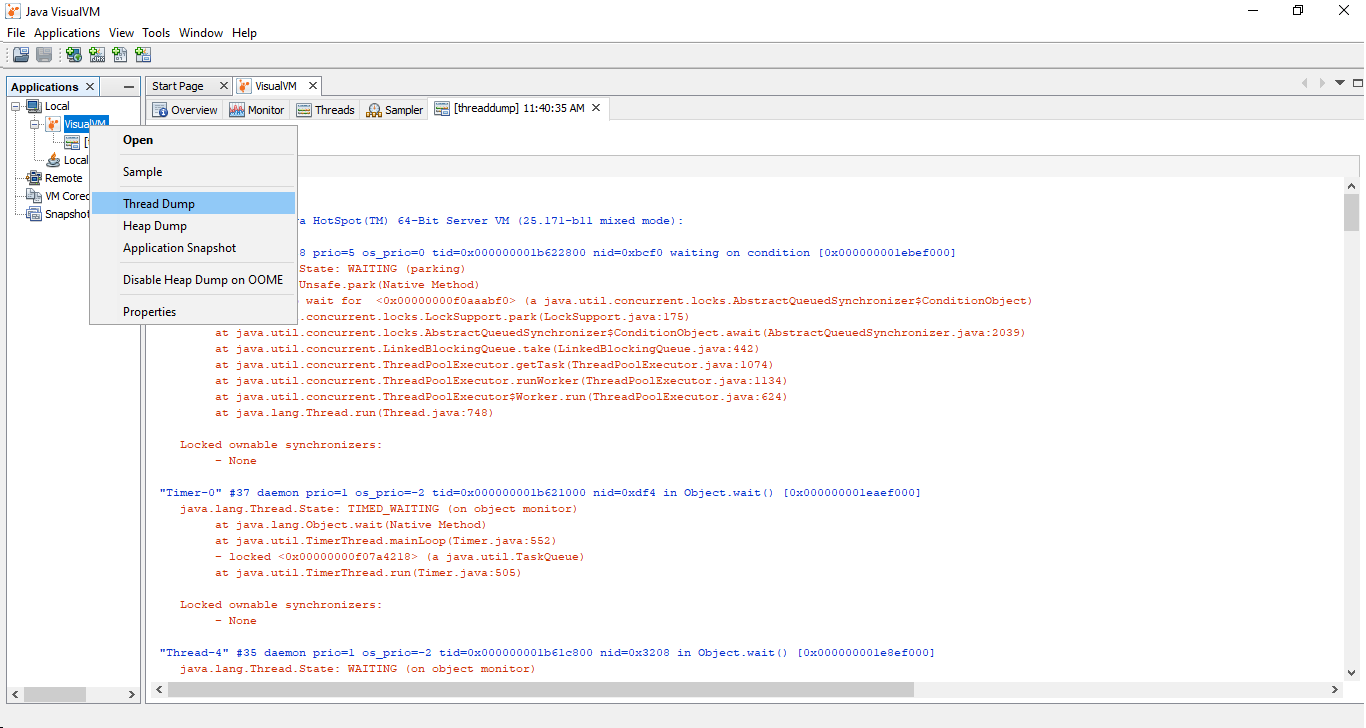
Jvisualvm is a GUI tool that helps us troubleshoot, monitor, and profile Java applications. It also comes with JVM and can be launched from the /bin directory of our java installation. It is very intuitive and easy to use. Among other options, it also allows us to capture thread dump for a particular process.
To view the thread dump for a particular process, we can right-click on the program and select Thread Dump from the context menu.
#3. jcmd
JCMD is a command-line utility that ships with the JDK and are used to send diagnostic command requests to the JVM.
It however works only on the local machine where the Java application is running. It can be used to control Java Flight Recordings, diagnose and troubleshoot JVM and Java applications. We can use the Thread.print command of jcmd to get a list of thread dumps for a particular process specified by the PID.
Below is an example of how we can use jcmd.
jcmd 28036 Thread.print
C:Program FilesJavajdk1.8.0_171bin>jcmd 28036 Thread.print
28036:
2020-06-27 21:20:02
Full thread dump Java HotSpot(TM) 64-Bit Server VM (25.171-b11 mixed mode):

"Bundle File Closer" #14 daemon prio=5 os_prio=0 tid=0x0000000021d1c000 nid=0x1d4c in Object.wait() [0x00000000244ef000]
   java.lang.Thread.State: WAITING (on object monitor)
        at java.lang.Object.wait(Native Method)
        at java.lang.Object.wait(Unknown Source)
        at org.eclipse.osgi.framework.eventmgr.EventManager$EventThread.getNextEvent(EventManager.java:403)
        - locked  (a org.eclipse.osgi.framework.eventmgr.EventManager$EventThread)
        at org.eclipse.osgi.framework.eventmgr.EventManager$EventThread.run(EventManager.java:339)

"Active Thread: Equinox Container: 0b6cc851-96cd-46de-a92b-253c7f7671b9" #12 prio=5 os_prio=0 tid=0x0000000022e61800 nid=0xbff4 waiting on condition [0x00000000243ee000]
   java.lang.Thread.State: TIMED_WAITING (parking)
        at sun.misc.Unsafe.park(Native Method)
        - parking to wait for   (a java.util.concurrent.locks.AbstractQueuedSynchronizer$ConditionObject)
        at java.util.concurrent.locks.LockSupport.parkNanos(Unknown Source)
        at java.util.concurrent.locks.AbstractQueuedSynchronizer$ConditionObject.awaitNanos(Unknown Source)
        at java.util.concurrent.ScheduledThreadPoolExecutor$DelayedWorkQueue.take(Unknown Source)
        at java.util.concurrent.ScheduledThreadPoolExecutor$DelayedWorkQueue.take(Unknown Source)
        at java.util.concurrent.ThreadPoolExecutor.getTask(Unknown Source)
        at java.util.concurrent.ThreadPoolExecutor.runWorker(Unknown Source)
        at java.util.concurrent.ThreadPoolExecutor$Worker.run(Unknown Source)
        at java.lang.Thread.run(Unknown Source)

"Service Thread" #10 daemon prio=9 os_prio=0 tid=0x0000000021a7b000 nid=0x2184 runnable [0x0000000000000000]
   java.lang.Thread.State: RUNNABLE

"C1 CompilerThread3" #9 daemon prio=9 os_prio=2 tid=0x00000000219f5000 nid=0x1300 waiting on condition [0x0000000000000000]
   java.lang.Thread.State: RUNNABLE

"C2 CompilerThread2" #8 daemon prio=9 os_prio=2 tid=0x00000000219e0000 nid=0x48f4 waiting on condition [0x0000000000000000]
   java.lang.Thread.State: RUNNABLE

"C2 CompilerThread1" #7 daemon prio=9 os_prio=2 tid=0x00000000219df000 nid=0xb314 waiting on condition [0x0000000000000000]
   java.lang.Thread.State: RUNNABLE

"C2 CompilerThread0" #6 daemon prio=9 os_prio=2 tid=0x00000000219db800 nid=0x2260 waiting on condition [0x0000000000000000]
   java.lang.Thread.State: RUNNABLE

"Attach Listener" #5 daemon prio=5 os_prio=2 tid=0x00000000219d9000 nid=0x125c waiting on condition [0x0000000000000000]
   java.lang.Thread.State: RUNNABLE

"Signal Dispatcher" #4 daemon prio=9 os_prio=2 tid=0x00000000219d8000 nid=0x834 runnable [0x0000000000000000]
   java.lang.Thread.State: RUNNABLE

"Finalizer" #3 daemon prio=8 os_prio=1 tid=0x000000001faf3000 nid=0x36c0 in Object.wait() [0x0000000021eae000]
   java.lang.Thread.State: WAITING (on object monitor)
        at java.lang.Object.wait(Native Method)
        - waiting on  (a java.lang.ref.ReferenceQueue$Lock)
        at java.lang.ref.ReferenceQueue.remove(Unknown Source)
        - locked  (a java.lang.ref.ReferenceQueue$Lock)
        at java.lang.ref.ReferenceQueue.remove(Unknown Source)
        at java.lang.ref.Finalizer$FinalizerThread.run(Unknown Source)

"Reference Handler" #2 daemon prio=10 os_prio=2 tid=0x0000000005806000 nid=0x13c0 in Object.wait() [0x00000000219af000]
   java.lang.Thread.State: WAITING (on object monitor)
        at java.lang.Object.wait(Native Method)
        - waiting on  (a java.lang.ref.Reference$Lock)
        at java.lang.Object.wait(Unknown Source)
        at java.lang.ref.Reference.tryHandlePending(Unknown Source)
        - locked  (a java.lang.ref.Reference$Lock)
        at java.lang.ref.Reference$ReferenceHandler.run(Unknown Source)

"main" #1 prio=5 os_prio=0 tid=0x000000000570e800 nid=0xbf8 runnable [0x0000000000fec000]
   java.lang.Thread.State: RUNNABLE
        at java.util.zip.ZipFile.open(Native Method)
        at java.util.zip.ZipFile.(Unknown Source)
        at java.util.zip.ZipFile.(Unknown Source)
        at java.util.zip.ZipFile.(Unknown Source)
        at org.eclipse.osgi.framework.util.SecureAction.getZipFile(SecureAction.java:307)
        at org.eclipse.osgi.storage.bundlefile.ZipBundleFile.getZipFile(ZipBundleFile.java:136)
        at org.eclipse.osgi.storage.bundlefile.ZipBundleFile.lockOpen(ZipBundleFile.java:83)
        at org.eclipse.osgi.storage.bundlefile.ZipBundleFile.getEntry(ZipBundleFile.java:290)
        at org.eclipse.equinox.weaving.hooks.WeavingBundleFile.getEntry(WeavingBundleFile.java:65)
        at org.eclipse.osgi.storage.bundlefile.BundleFileWrapper.getEntry(BundleFileWrapper.java:55)
        at org.eclipse.osgi.storage.BundleInfo$Generation.getRawHeaders(BundleInfo.java:130)
        - locked  (a java.lang.Object)
        at org.eclipse.osgi.storage.BundleInfo$CachedManifest.get(BundleInfo.java:599)
        at org.eclipse.osgi.storage.BundleInfo$CachedManifest.get(BundleInfo.java:1)
        at org.eclipse.equinox.weaving.hooks.SupplementerRegistry.addSupplementer(SupplementerRegistry.java:172)
        at org.eclipse.equinox.weaving.hooks.WeavingHook.initialize(WeavingHook.java:138)
        at org.eclipse.equinox.weaving.hooks.WeavingHook.start(WeavingHook.java:208)
        at org.eclipse.osgi.storage.FrameworkExtensionInstaller.startActivator(FrameworkExtensionInstaller.java:261)
        at org.eclipse.osgi.storage.FrameworkExtensionInstaller.startExtensionActivators(FrameworkExtensionInstaller.java:198)
        at org.eclipse.osgi.internal.framework.SystemBundleActivator.start(SystemBundleActivator.java:112)
        at org.eclipse.osgi.internal.framework.BundleContextImpl$3.run(BundleContextImpl.java:815)
        at org.eclipse.osgi.internal.framework.BundleContextImpl$3.run(BundleContextImpl.java:1)
        at java.security.AccessController.doPrivileged(Native Method)
        at org.eclipse.osgi.internal.framework.BundleContextImpl.startActivator(BundleContextImpl.java:808)
        at org.eclipse.osgi.internal.framework.BundleContextImpl.start(BundleContextImpl.java:765)
        at org.eclipse.osgi.internal.framework.EquinoxBundle.startWorker0(EquinoxBundle.java:1005)
        at org.eclipse.osgi.internal.framework.EquinoxBundle$SystemBundle$EquinoxSystemModule.initWorker(EquinoxBundle.java:190)
        at org.eclipse.osgi.container.SystemModule.init(SystemModule.java:99)
        at org.eclipse.osgi.internal.framework.EquinoxBundle$SystemBundle.init(EquinoxBundle.java:272)
        at org.eclipse.osgi.internal.framework.EquinoxBundle$SystemBundle.init(EquinoxBundle.java:257)
        at org.eclipse.osgi.launch.Equinox.init(Equinox.java:171)
        at org.eclipse.core.runtime.adaptor.EclipseStarter.startup(EclipseStarter.java:316)
        at org.eclipse.core.runtime.adaptor.EclipseStarter.run(EclipseStarter.java:251)
        at sun.reflect.NativeMethodAccessorImpl.invoke0(Native Method)
        at sun.reflect.NativeMethodAccessorImpl.invoke(Unknown Source)
        at sun.reflect.DelegatingMethodAccessorImpl.invoke(Unknown Source)
        at java.lang.reflect.Method.invoke(Unknown Source)
        at org.eclipse.equinox.launcher.Main.invokeFramework(Main.java:661)
        at org.eclipse.equinox.launcher.Main.basicRun(Main.java:597)
        at org.eclipse.equinox.launcher.Main.run(Main.java:1476)

"VM Thread" os_prio=2 tid=0x000000001fae8800 nid=0x32cc runnable

"GC task thread#0 (ParallelGC)" os_prio=0 tid=0x0000000005727800 nid=0x3264 runnable

"GC task thread#1 (ParallelGC)" os_prio=0 tid=0x0000000005729000 nid=0xbdf4 runnable

"GC task thread#2 (ParallelGC)" os_prio=0 tid=0x000000000572a800 nid=0xae6c runnable

"GC task thread#3 (ParallelGC)" os_prio=0 tid=0x000000000572d000 nid=0x588 runnable

"GC task thread#4 (ParallelGC)" os_prio=0 tid=0x000000000572f000 nid=0xac0 runnable

"GC task thread#5 (ParallelGC)" os_prio=0 tid=0x0000000005730800 nid=0x380 runnable

"GC task thread#6 (ParallelGC)" os_prio=0 tid=0x0000000005733800 nid=0x216c runnable

"GC task thread#7 (ParallelGC)" os_prio=0 tid=0x0000000005734800 nid=0xb930 runnable

"VM Periodic Task Thread" os_prio=2 tid=0x0000000021a8d000 nid=0x2dcc waiting on condition

JNI global references: 14


C:Program FilesJavajdk1.8.0_171bin>
#4. JMC
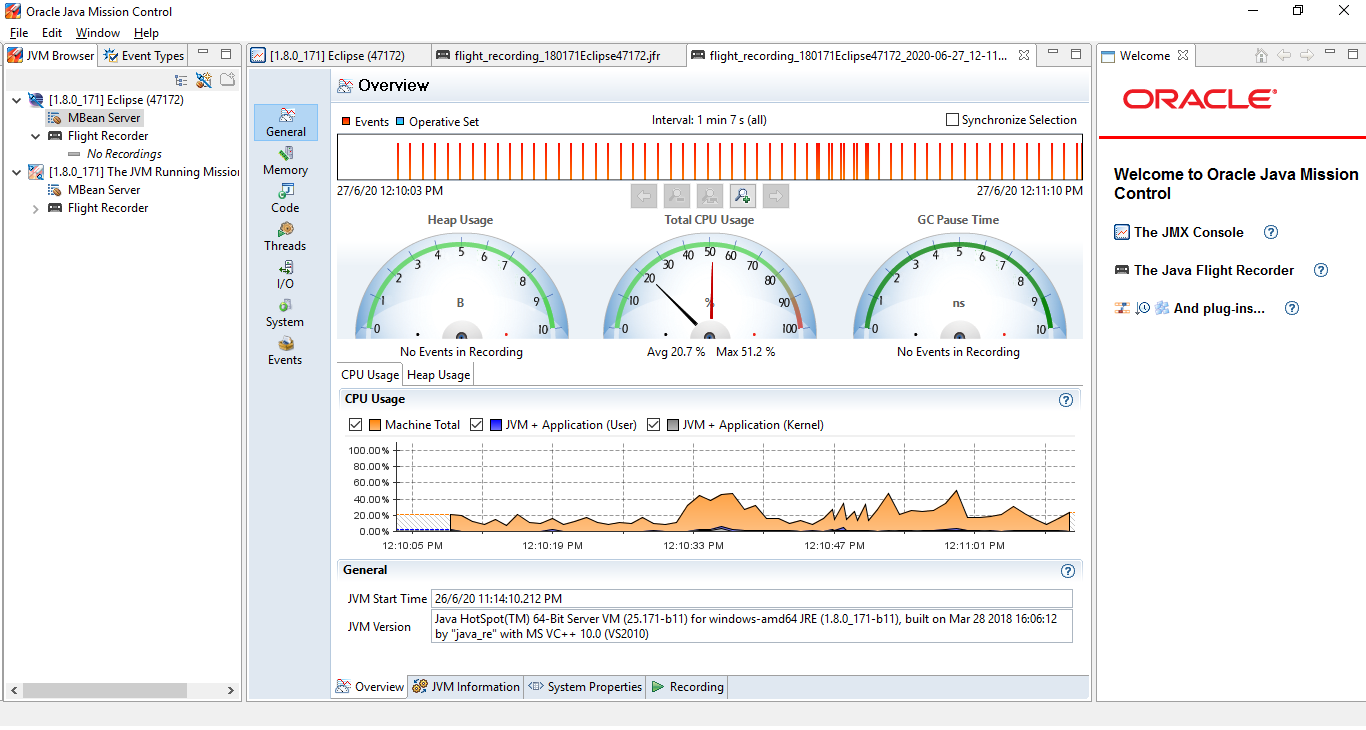
JMC stands for Java Mission Control. It is an open-source GUI tool that ships with JDK and is used to collect and analyze java application data.
It can be launched from the /bin folder of our Java installation. Java administrators and developers use the tool to gather detailed low-level information about the JVM’s and application’s behaviors. It enables detailed and efficient analysis of data collected by Java Flight Recorder.
On launching jmc, we can see list of java process which is running on the local machine. A remote connection is also possible. On a particular process, we can right click and choose Start Flight Recording and then check the thread dumps in the Threads tab.
#5. jconsole
jconsole is a Java Management Extension tool used for complaint management and monitoring.
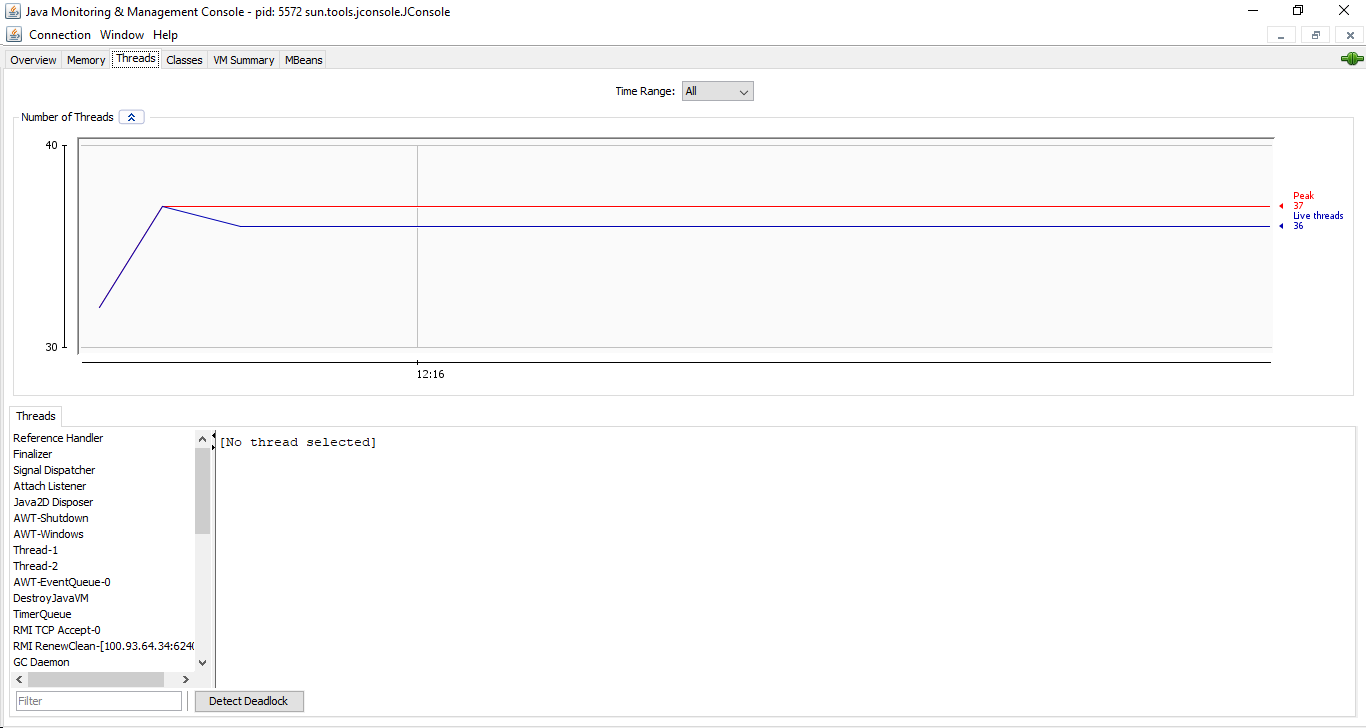
It also has a set of predefined operations on the JMX agent which the user can perform. It enables the user in detecting and analyzing stack trace of a live program. It can be launched from the /bin folder of our Java installation.
Using the jconsole GUI tool we can inspect each thread’s stack trace when we connect it to a running java process. Then, in the Thread tab, we can see the name of all running threads. To detect a deadlock, we can click on the Detect Deadlock in the bottom right of the window. If a deadlock is detected it will appear in a new tab otherwise a No Deadlock Detected will be displayed.
#6. ThreadMxBean
ThreadMXBean is the interface for the management of the thread system of the Java virtual machine belonging to java.lang.Management package. It is mainly used to detect the threads which have entered a deadlock situation and get details about them.
We can use the ThreadMxBean interface to programmatically capture the thread dump. getThreadMXBean() method of ManagementFactory is used to get an instance of the ThreadMXBean interface. It returns the number of both daemon and non-daemon live threads. ManagementFactory is a factory class for getting the managed beans for the Java platform.
private static String getThreadDump (boolean lockMonitors, boolean lockSynchronizers) {
    StringBuffer threadDump = new StringBuffer (System.lineSeparator ());
    ThreadMXBean threadMXBean = ManagementFactory.getThreadMXBean ();
    for (ThreadInfo threadInfo : threadMXBean.dumpAllThreads (lockMonitors, lockSynchronizers)) {
        threadDump.append (threadInfo.toString ());
    }
    return threadDump.toString ();
}
Manual Analysis of Thread Dumps
Analysis of thread dumps can be very useful in pinpointing issues in multithreaded processes. Issues such as deadlocks, lock contention, and excess CPU utilization by individual thread dumps can be resolved by visualizing the states of individual thread dumps.
Maximum throughput from the application can be achieved by rectifying the status of each thread after analyzing the thread dump.
For instance, let’s say, a process is using up a lot of CPU, we can find out if any thread is using the CPU the most. If there’s any such thread, we convert its LWP number to a hexadecimal number. Then from the thread dump, we can find the thread with nid equal to the previously obtained hexadecimal number. Using the stack trace of the thread we can pinpoint the issue. Let’s find out the process id of the thread using the below command.
ps -mo pid,lwp,stime,time,cpu -C java
[[email protected] ~]# ps -mo pid,lwp,stime,time,cpu -C java
       PID        LWP         STIME           TIME              %CPU
26680               -         Dec07          00:02:02           99.5
         -       10039        Dec07          00:00:00           0.1
         -       10040        Dec07          00:00:00           95.5
Let’s have a look at below chunk of thread dump. To get thread dump for process 26680, use jstack -l 26680
[[email protected] ~]# jstack -l 26680
2020-06-27 09:01:29
Full thread dump Java HotSpot(TM) 64-Bit Server VM (25.221-b11 mixed mode):

"Attach Listener" #16287 daemon prio=9 os_prio=0 tid=0x00007f0814001800 nid=0x4ff2 waiting on condition [0x0000000000000000]
   java.lang.Thread.State: RUNNABLE

   Locked ownable synchronizers:
        - None

.
.
.
.
.
.
.
"Reference Handler" #2 daemon prio=10 os_prio=0 tid=0x00007f085814a000 nid=0x6840 in Object.wait() [0x00007f083b2f1000]
   java.lang.Thread.State: WAITING (on object monitor)
        at java.lang.Object.wait(Native Method)
        at java.lang.Object.wait(Object.java:502)
        at java.lang.ref.Reference.tryHandlePending(Reference.java:191)
        - locked  (a java.lang.ref.Reference$Lock)
        at java.lang.ref.Reference$ReferenceHandler.run(Reference.java:153)

   Locked ownable synchronizers:
        - None

"VM Thread" os_prio=0 tid=0x00007f0858140800 nid=0x683f runnable

"GC task thread#0 (ParallelGC)" os_prio=0 tid=0x00007f0858021000 nid=0x683b runnable

"GC task thread#1 (ParallelGC)" os_prio=0 tid=0x00007f0858022800 nid=0x683c runnable

"GC task thread#2 (ParallelGC)" os_prio=0 tid=0x00007f0858024800 nid=0x683d runnable

"GC task thread#3 (ParallelGC)" os_prio=0 tid=0x00007f0858026000 nid=0x683e runnable

"VM Periodic Task Thread" os_prio=0 tid=0x00007f08581a0000 nid=0x6847 waiting on condition

JNI global references: 1553
Now, Let’s see what are the things we can explore using thread dumps. If we observe the thread dump, we can see a lot of content, which can be overwhelming. However, if we take one step at a time, it can be fairly simple to understand. Let’s understand the first line
2020-06-27 09:01:29Full thread dump Java HotSpot(TM) 64-Bit Server VM (25.221-b11 mixed mode):
The above displays the time the dump was generated, and information about the JVM which was used. Next, in the end, we can see the list of threads, the first among them is our ReferenceHandler thread.
Analyzing Blocked Threads
If we analyze the below thread dump logs, we can find that it has detected threads with BLOCKED status which makes the performance of an application very slow. So, if we can find the BLOCKED threads, we can try to extract the threads related to the locks that the threads are trying to obtain. Analysis of the stack trace form the thread currently holding the lock can help in solving the problem.
[[email protected] ~]# jstack -l 26680
.
.
.
.
" DB-Processor-13" daemon prio=5 tid=0x003edf98 nid=0xca waiting for monitor entry [0x000000000825f000]
java.lang.Thread.State: BLOCKED (on object monitor)
                at beans.ConnectionPool.getConnection(ConnectionPool.java:102)
                - waiting to lock  (a beans.ConnectionPool)
                at beans.cus.ServiceCnt.getTodayCount(ServiceCnt.java:111)
                at beans.cus.ServiceCnt.insertCount(ServiceCnt.java:43)
"DB-Processor-14" daemon prio=5 tid=0x003edf98 nid=0xca waiting for monitor entry [0x000000000825f020]
java.lang.Thread.State: BLOCKED (on object monitor)
                at beans.ConnectionPool.getConnection(ConnectionPool.java:102)
                - waiting to lock  (a beans.ConnectionPool)
                at beans.cus.ServiceCnt.getTodayCount(ServiceCnt.java:111)
                at beans.cus.ServiceCnt.insertCount(ServiceCnt.java:43)
.
.
.
.
Analyzing Deadlocked Thread
Another very commonly used application of thread dumps is the detection of deadlocks. The detection and solution of deadlocks can be a lot easier if we analyze the thread dumps.
A deadlock is a situation involving at least two threads where the resource required by one thread to continue execution is locked by another thread and at the same time, the resource required by the second thread is locked by the first thread.
So, none of the threads can continue execution, and this results in a deadlock situation and ends in the application getting stuck. If dreadlocks are present, then the final section of the thread dump will print out the information regarding the deadlock as follows.
"Thread-0":
waiting to lock monitor 0x00000250e4982480 (object 0x00000000894465b0, a java.lang.Object),
which is held by "Thread-1"
"Thread-1":
waiting to lock monitor 0x00000250e4982380 (object 0x00000000894465a0, a java.lang.Object),
which is held by "Thread-0"
.
.
.
"Thread-0":
at DeadlockedProgram$DeadlockedRunnableImplementation.run(DeadlockedProgram.java:34)
- waiting to lock  (a java.lang.Object)
- locked  (a java.lang.Object)
at java.lang.Thread.run([email protected]/Thread.java:844)
"Thread-1":
at DeadlockedProgram $DeadlockRunnableImplementation.run(DeadlockedProgram.java:34)
- waiting to lock  (a java.lang.Object)
- locked  (a java.lang.Object)
at java.lang.Thread.run([email protected]/Thread.java:844)
Here we can see the deadlock information in a fairly human-readable format.
Other than this, if we sum up all the above chunk of thread dump together, then it states the below information.
- Reference handler is the human-readable name of the thread.
- #2 is the thread’s unique id.
- daemon denotes if the thread is a daemon thread.
- The numeric priority of the thread is given by prio=10.
- The current status of the thread is denoted by waiting on condition.
- Then we see the stack trace, which includes the locking information.
Thread Dumps Analyzers
Besides manual analysis, there are numerous tools available for analyzing thread dumps, both online and offline. Below are some of the listed tools, which we can use based on the requirements.
First, let’s explore online tools.
#1. Fast thread
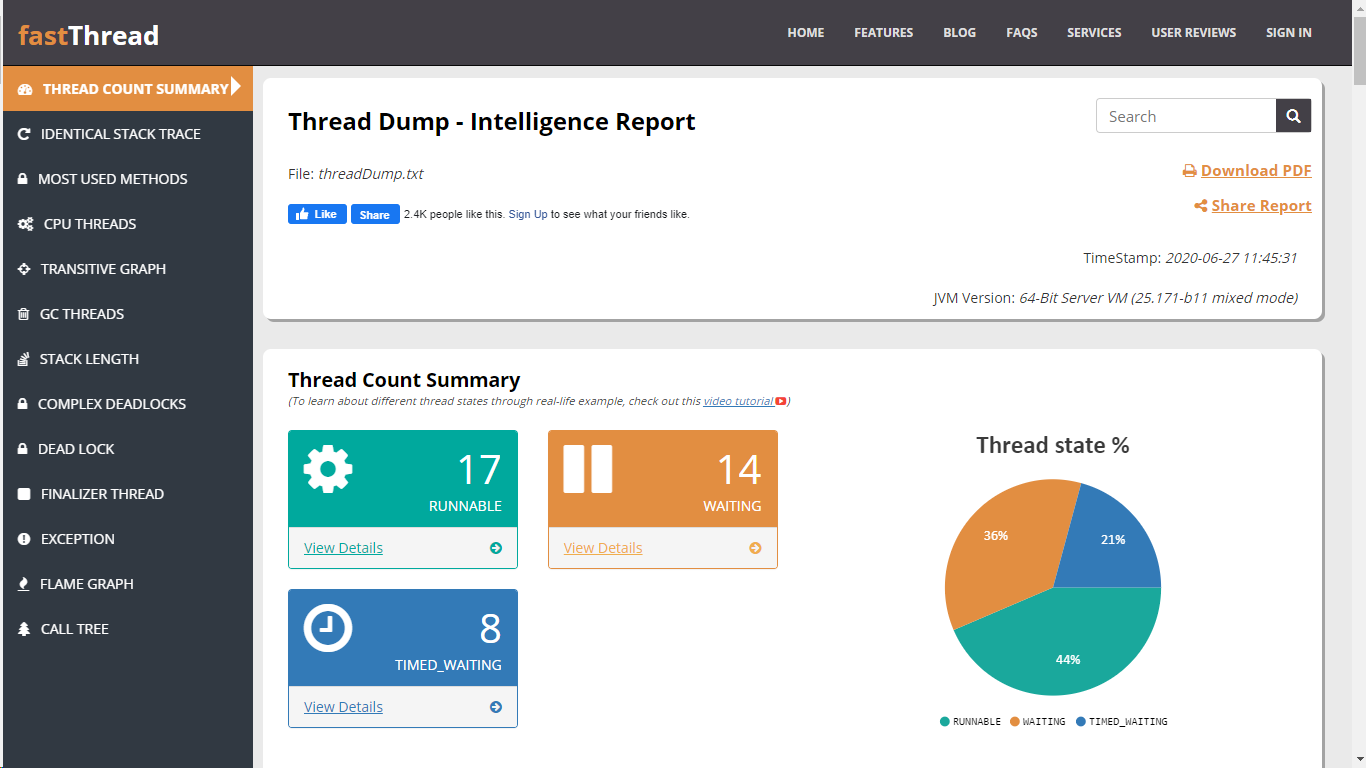
Fast Thread is the DevOps engineer’s favorite thread dump analysis tool to troubleshoot complex production problems. This is an online Java thread dump analyzer, We can upload the thread dump as a file or we can directly copy and paste the thread dump.
Depending on the size, it will analyze the thread dump and displays the information as shown in the screenshot.
Features
- Troubleshoot JVM crashes, slowdowns, memory leaks, freezes, CPU Spikes
- Instant RCA (don’t wait for Vendors)
- Intuitive Dashboard
- REST API support
- Machine Learning
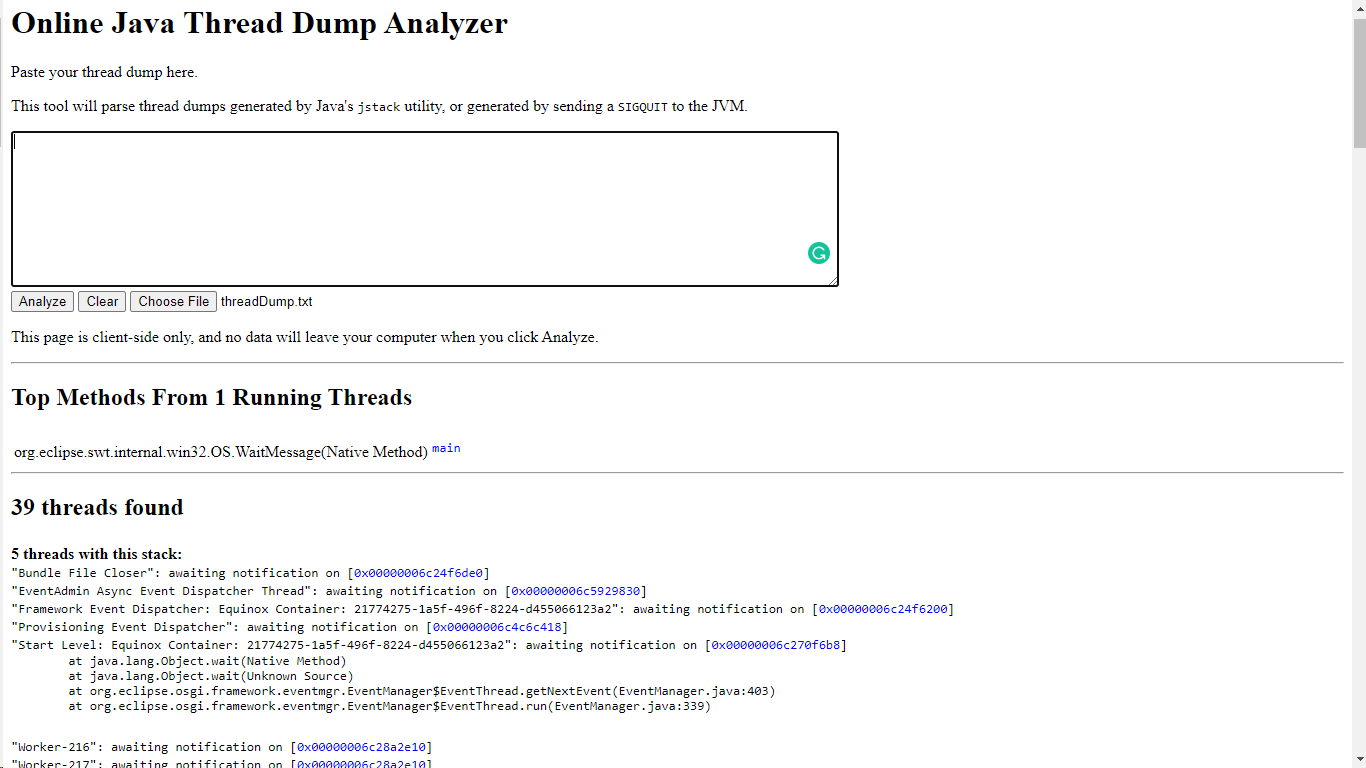
#2. Spotify Thread Dump Analyzer
The Spotify Thread Dump Analyzer is licensed under version 2.0 of the Apache license. It is an online tool and accepts the thread dump as a file or we can directly copy and paste the thread dump. Depending on the size, it will analyze the thread dump and displays the information as shown in the screenshot.
#3. Jstack review
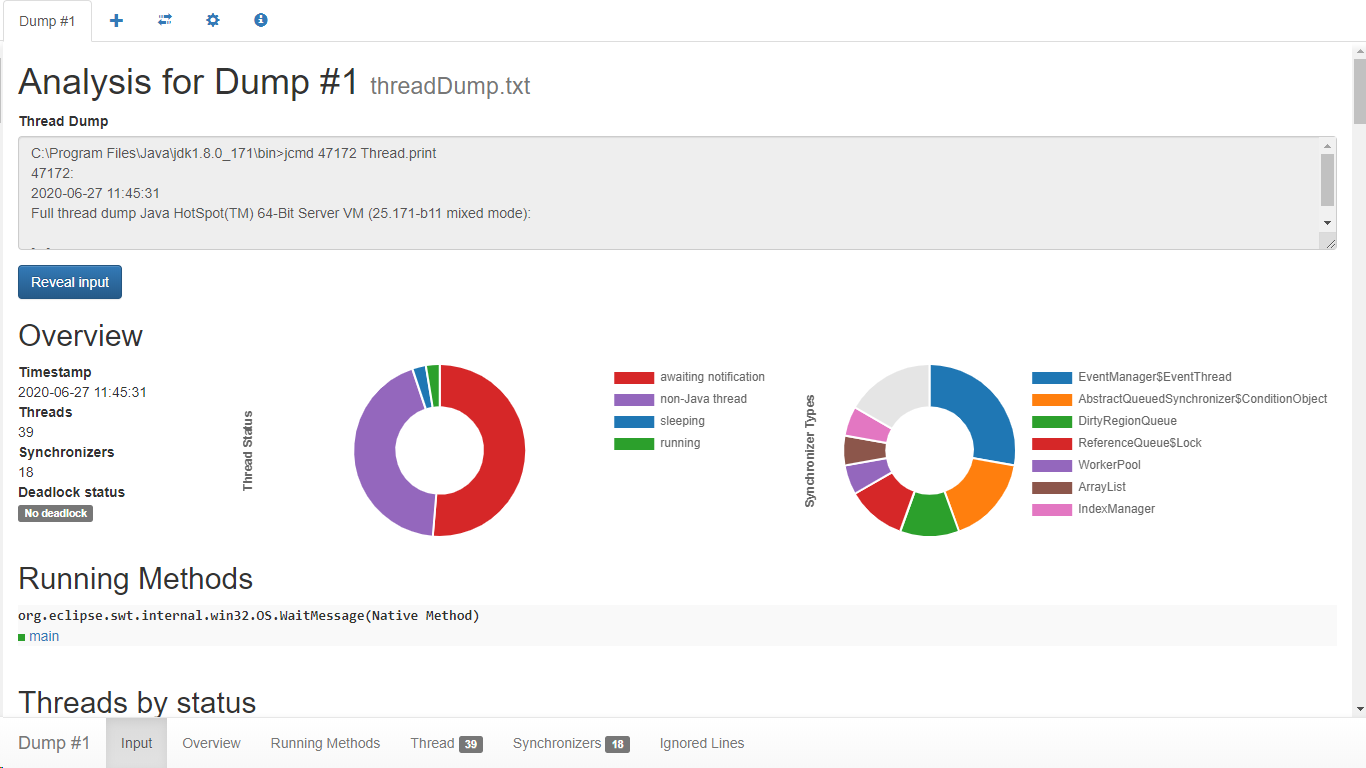
Jstack.review analyzes java thread dumps from within the browser. This page is the client-side only.
#4. Site 24×7
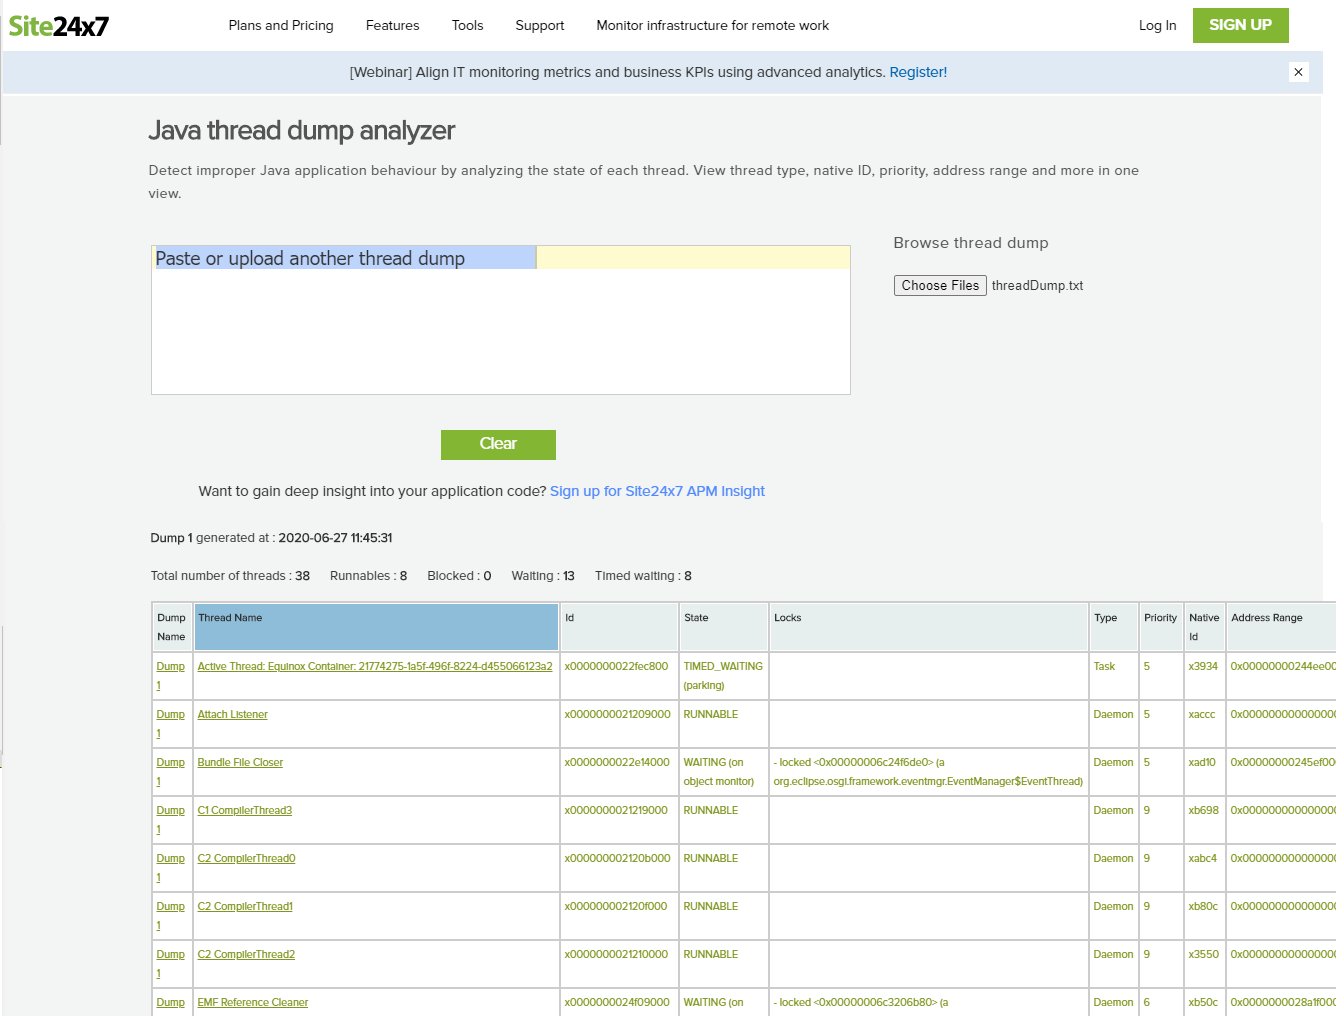
This tool is a prerequisite for detecting faulty threads degrading Java Virtual Machine(JVM) performance. Issues such as deadlocks, lock contention, and excess CPU utilization by individual thread dumps can be resolved by visualizing the states of individual thread dumps.
Maximum throughput from the app can be achieved by rectifying the status of each thread provided by the tool.
Now, let’s explore offline tools.
When it comes to profiling, only the best tool is good enough.
#1. JProfiler
JProfiler is one of the most popular thread dump analyzers among Java developers. JProfiler’s intuitive UI helps you resolve performance bottlenecks, pin down memory leaks, and understand threading issues.

JProfiler supports profiling on the following platforms:
- Windows
- macOS
- Linux
- FreeBSD
- Solaris
- AIX
- HP-UX
Below are some features that make JProfiler the top choice for profiling our applications on the JVM.
Features
- Supports database profiling for JDBC, JPA, and NoSQL
- Support for Java enterprise edition is also available
- Presents high-level information about RMI calls
- Stellar analysis of memory leaks
- Extensive QA capabilities
- The integrated thread profiler is tightly integrated with the CPU profiling views.
- Support for platforms, IDE’s, and application servers.
#2. IBM TMDA
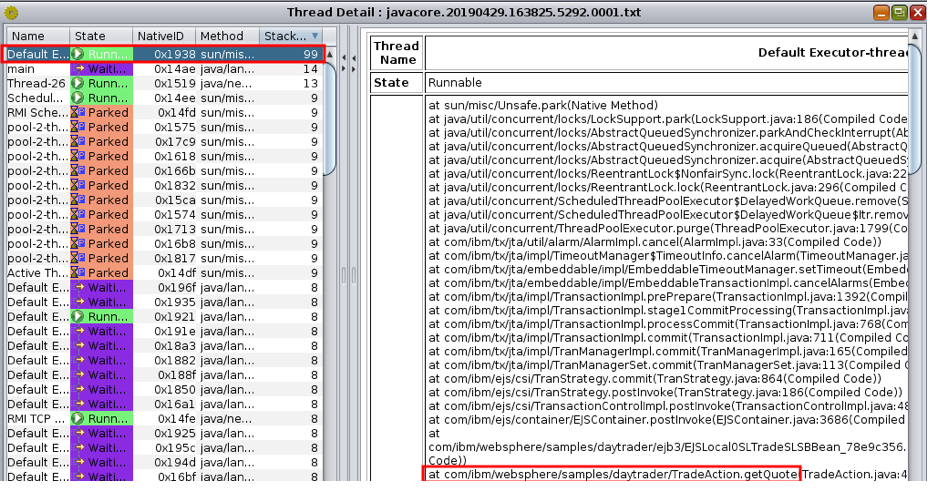
IBM Thread and Monitor Dump Analyzer for Java (TMDA) is a tool that allows identification of hangs, deadlocks, resource contention, and bottlenecks in Java thread dumps. It is an IBM product but the TMDA tool is provided as without any warranty or support; however, they try to fix and enhance the tool over time.
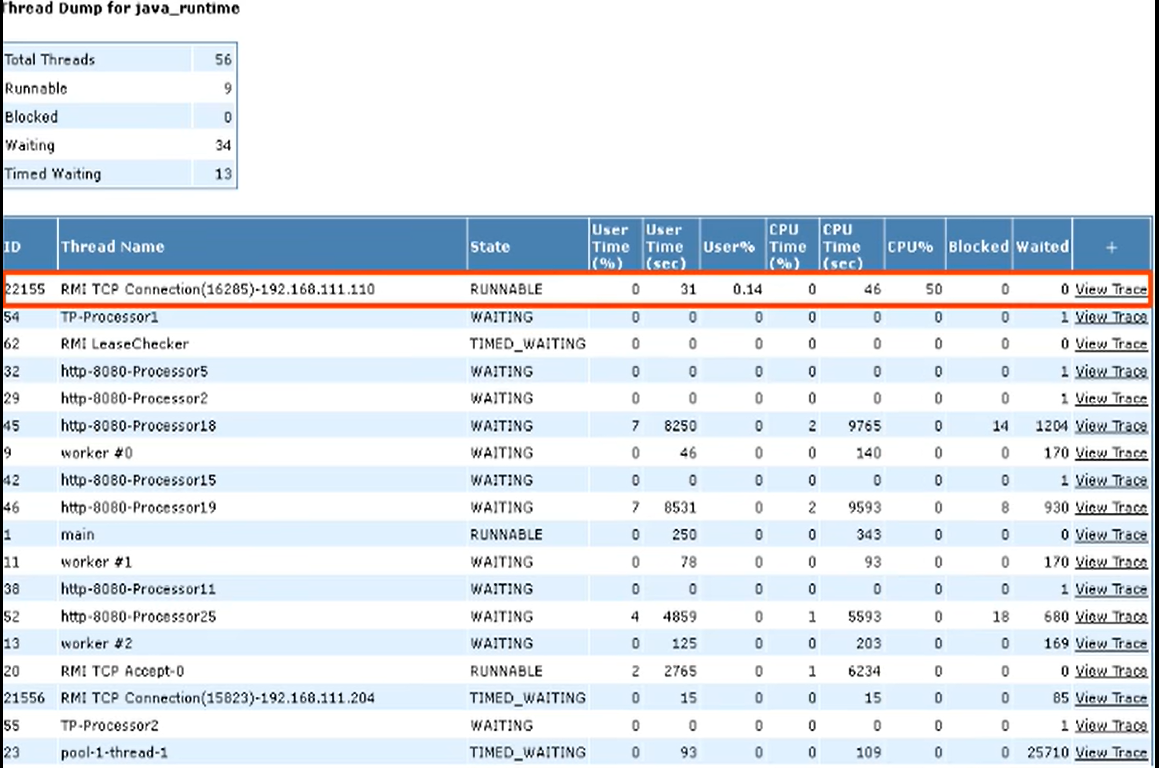
#3. ManageEngine
ManageEngine applications manager can help to monitor JVM Heap and Non-Heap memory. We can even configure thresholds and be alerted by email, SMS, etc, and ensure a Java application is tuned well.
#4. YourKit
YourKit consists of the below products called it as a Kit.
- Java Profiler – Fully featured low overhead profiler for Java EE and Java SE platforms.
- YouMonitor – Performance monitoring and profiling of Jenkins, TeamCity, Gradle, Maven, Ant, JUnit, and TestNG.
- .NET Profiler – Easy to use performance and memory profiler for .NET framework.
Conclusion
Now you know, how thread dumps are useful in understanding and diagnosing problems in multithreaded applications. With proper knowledge, regarding the thread dumps – their structure, the information contained in them, and so on – we can utilize them to identify the causes of the problems quickly.


