
In this guide, I will show you how to analyze network Packets on Linux. I will use the Tools Tcpdump and Wireshark. This tutorial uses Ubuntu as OS, but it is applicable to other Linux distributions too.
Why do you need Tcpdump?
An obvious question that may come to mind is why care about Tcpdump when you can do almost everything with Wireshark. Well here is the answer for this: Sometimes it is more convenient to use Tcpdump for packet capturing as compared to Wireshark. For e.g., if the target machine you are capturing packet on is a remote one without Wireshark installed on it or it is just a remote headless machine, in both cases, Tcpdump is very handy. To look at various options that can be used with Tcpdump, search for the man pages.
What is Tcpdump?
Tcpdump is a command-line alternative to Wireshark. It serves the same purpose as Wireshark, which is capturing and analyzing traffic. Tcpdump is a separate application and should not be thought of as a Wireshark command-line interface. Since it is based on the command-line interface, it is not as simple to handle as Wireshark. New users may find it daunting at first when they start to use it and can find many hard-to-remember commands and syntax.
Outline Of this Tutorial
Let us now turn to the main purpose of this guide. In this guide, we will see how we can interact Tcpdump with Wireshark. Here we are pointing out the work we are going to do in this guide:
- Connecting with the remote machine(Host 2) with SSH.
- Capturing traffic with Tcpdump and saving the Capture.
- Sending the Capture file to the onsite machine(Host 1) on which Wireshark is installed.
- Using Wireshark for analyzing the captured Tcpdump session.
Pre-Flight Check
For this tutorial, we are using two Ubuntu 20.04 machines. You need to configure them on your own. Our IP configuration is as follows:
Host 1(Onsite Machine): 192.168.186.150
Host 2(Remote Machine): 192.168.186.201
The steps mentioned in this guide are supposed to work on any Linux system with the following requirements met:
- Onsite host(Host 1) with Wireshark installed and SSH configured.
- SSH access from the onsite host(Host 1) to the remote host (Host 2).
- Tcpdump and SSH configured on the remote host(Host 2).
- ‘sudo’ user account on Host 2 for running Tcpdump and also on Host 1 (depends on how Wireshark is configured).
Let’s Begin…
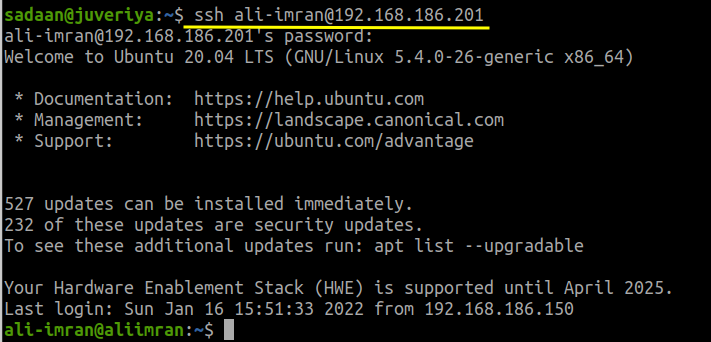
In order to proceed further, connect from your onsite machine (Host 1) to the remote machine (Host 2) with SSH access protocol. We have already set up the SSH connection between the two machines. So we will use the below command from Host 1 terminal to connect to Host 2:
$ ssh ‘user_name’@’IP_of_Host2’
Here replace ‘user_name’ with the username of Host 2 we are connecting to and ’IP_of_Host2’ is the IP address of Host 2. See the below picture for reference:
<img alt="Accessing Host 2 with SSH" data-ezsrc="https://kirelos.com/wp-content/uploads/2022/02/echo/image4.png61f9812c30a50.jpg" ezimgfmt="rs rscb5 src ng ngcb5" height="342" loading="lazy" src="data:image/svg xml,” width=”711″>
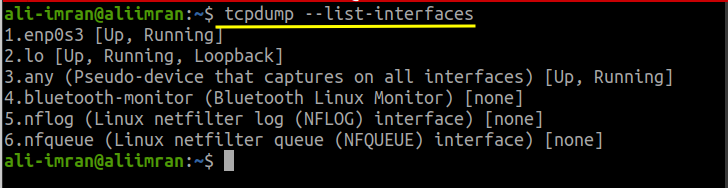
Now check the available interfaces on the remote machine that Tcpdump can capture on. For this use the command:
$ tcpdump –list-interfaces
Sample Output:
1.enp0s3 [Up, Running]2.lo [Up, Running, Loopback]3.any (Pseudo-device that captures on all interfaces) [Up, Running]4.eno1 [Up]5.bluetooth-monitor (Bluetooth Linux Monitor) [none]6.nflog (Linux netfilter log (NFLOG) interface) [none]7.nfqueue (Linux netfilter queue (NFQUEUE) interface) [none]8.bluetooth0 (Bluetooth adapter number 0) [none]
<img alt="Listing Interfaces" data-ezsrc="https://kirelos.com/wp-content/uploads/2022/02/echo/image2.png61f9812c5be9b.jpg" ezimgfmt="rs rscb5 src ng ngcb5" height="188" loading="lazy" src="data:image/svg xml,” width=”728″>
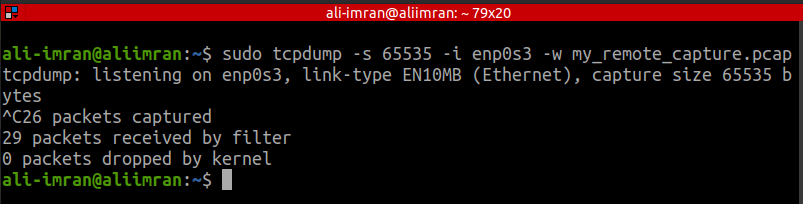
As you can see, the interface ‘enpos3’ is up and running. So let’s set it as the target interface and run the tcpdump command here. When you feel that you have captured enough packets, just press ‘Ctrl c’ to finish the packet capture. The command is:
$ sudo tcpdump -s 65535 -i enp0s3 -w my_remote_capture.pcap
<img alt="Running the Tcpdump command" data-ezsrc="https://kirelos.com/wp-content/uploads/2022/02/echo/image1.png61f9812c801cd.jpg" ezimgfmt="rs rscb5 src ng ngcb5" height="190" loading="lazy" src="data:image/svg xml,” width=”750″>
In the above command, we have used the following options with Tcpdump:
- -s: Older versions of Tcpdump cut-off packets to 68 or 96 bytes. The ‘-s’ option is used for capturing packets with full length.
- -i: It selects the interface to listen on.
- -w: It saves the raw packets captured to a file instead of displaying them on the terminal.
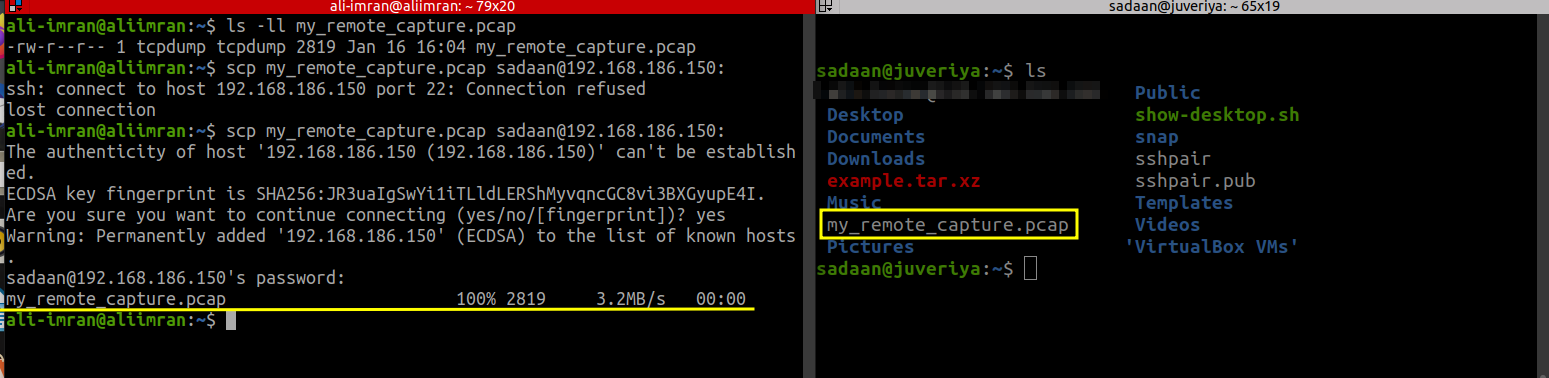
The captured traffic is stored in the file named ‘my_remote_capture.pcap’. We will now transfer this file to Host 1 for analysis with Wireshark. For transferring the file, we are using the ‘scp’ command. Again, we have already configured ‘scp’ to work between the two machines. The command syntax is as shown below:
$ scp my_remote_capture.pcap ‘username’@’IP_of_remote_machine’:
Here ‘username’ is the name of the user on Host 1 and ‘IP_of_remote_machine’ is also the IP of Host 1.
<img alt="Transferring the Capture file using SCP" data-ezsrc="https://kirelos.com/wp-content/uploads/2022/02/echo/image6.png61f9812d31b2e.jpg" ezimgfmt="rs rscb5 src ng ngcb5" height="183" loading="lazy" src="data:image/svg xml,” width=”750″>
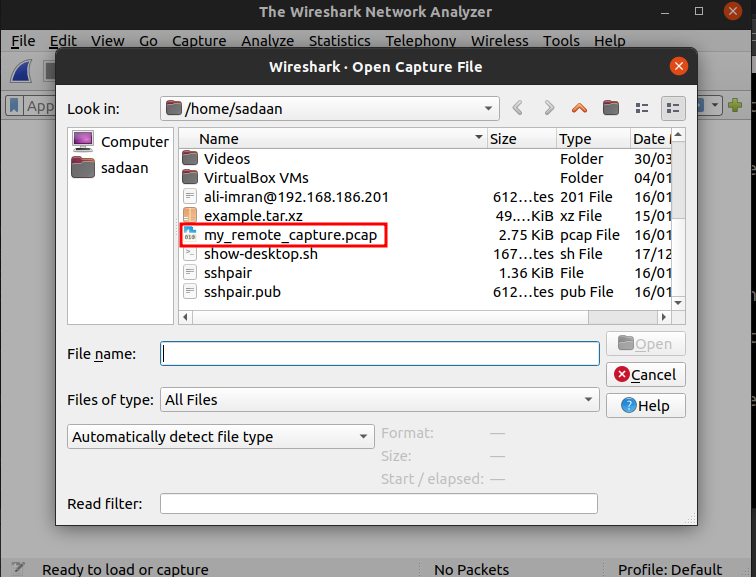
On the onsite machine (Host 1) check if you have received the file. In our case, we have successfully received the file and we will open it using the Wireshark as shown below:
<img alt="Opening the Capture file using Wireshark" data-ezsrc="https://kirelos.com/wp-content/uploads/2022/02/echo/image5.png61f9812d6e05a.jpg" ezimgfmt="rs rscb5 src ng ngcb5" height="572" loading="lazy" src="data:image/svg xml,” width=”750″>
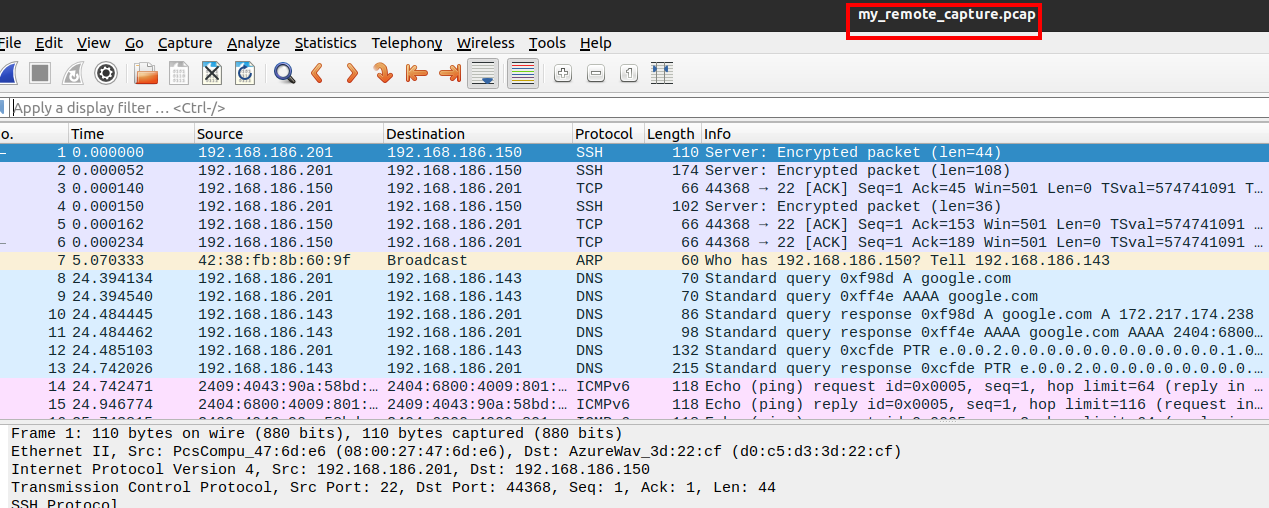
Here is the screenshot of the Capture file from Host 1:
Analyzing the Capture File
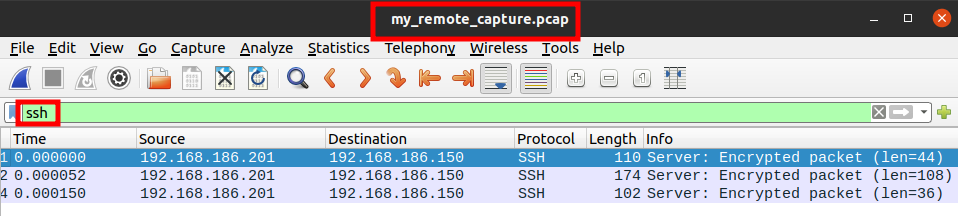
Let us apply a display filter on the above file. Since we were connected to Host 2 using SSH, there should be some traces of SSH protocol. On the text field corresponding to the display filter enter ‘ssh’:Advertisement
<img alt="Applying the Display filter" data-ezsrc="https://kirelos.com/wp-content/uploads/2022/02/echo/image3.png61f9812ddc177.jpg" ezimgfmt="rs rscb5 src ng ngcb5" height="169" loading="lazy" src="data:image/svg xml,” width=”750″>
In the above picture, we can see only the packets with ‘SSH’ protocol.
Wrapping up…
Congratulations, we have finally demonstrated how we can do a remote Capture on a machine. We have seen how we can combine Tcpdump with Wireshark.


