
Elastic Stack (formerly ELK Stack) is a group of open source software developed by Elastic to collect data from various sources. It allows you to collect, store, process, analyse and visualise data from various sources in any format on the central Elastic Stack platform.
The Elastic Stack consists of several software packages: “Elasticsearch” to store your data, “Kibana” as a dashboard to access and visualise your data, the dynamic data collection pipeline “Logstash” with extensible plugins to process any data, and “Beats” as a lightweight data shipping platform that sends data from edge machines.
The Elastic Stack can be deployed on Promises on your server or you can purchase the SaaS (Software as a Service) official Elastic Cloud.
In this tutorial we will show you how to install Elastic Stack on an Ubuntu 20.04 server. We will install Elasticsearch and Kibana on the same server and then install and configure “Filebeat” on the other server to send logs directly to the Elasticsearch server.
Requirements
For this tutorial, we will use two servers running Ubuntu 20.04. The Elastic Stack software will be installed on the server with 4 GB RAM, and we will use another server with 1 GB as a client for Filebeat.
What will we do?
- Add Elastic Stack Repository
- Install and Configure Elasticsearch
- Install and Configure Kibana
- Setup Nginx as a Reverse Proxy for Kibana
- Install and Configure Filebeat
- Setup New Role for Kibana User
- Create New Index Pattern Filebeat
Step 1 – Add Elastic Stack Repository
First, we will add the GPG key and repository of the Elastic stack software to both Ubuntu servers.
Before going any further, install the ‘apt-transport-https’ for securing your software installation through HTTPS secure connection.
sudo apt install apt-transport-https
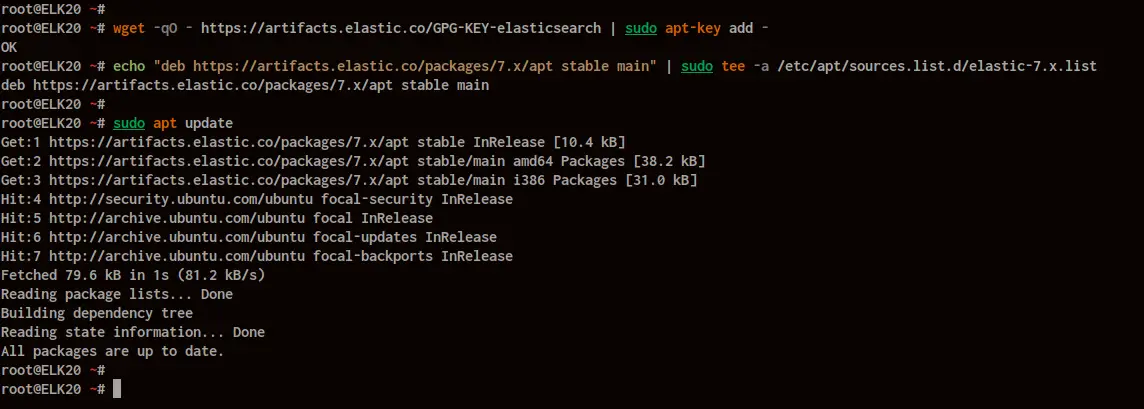
Next, add the GPG key and repository of the Elastic stack using the following command.
wget -qO - https://artifacts.elastic.co/GPG-KEY-elasticsearch | sudo apt-key add -
echo "deb https://artifacts.elastic.co/packages/7.x/apt stable main" | sudo tee -a /etc/apt/sources.list.d/elastic-7.x.list
Now update all available repositories on the Ubuntu system.
sudo apt update
And you’re ready to install all Elastic software stack on both servers.
Step 2 – Install and Configure Elasticsearch
In this step, we will install and configure the Elasticsearch on the single node server ‘ELK20’ with the internal IP address ‘172.16.0.3’.
Before installing Elasticsearch, edit the ‘/etc/hosts’ file using vim editor.
vim /etc/hosts
Now type your hostname with the internal IP address as below.
172.16.0.3 ELK20
Save and close.
Next, install the Elasticsearch package using the apt command below.
sudo apt install elasticsearch
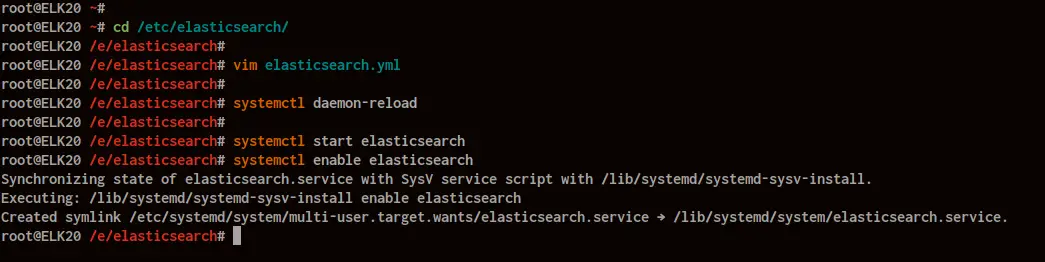
Once all installation is finished, go to the ‘/etc/elasticsearch’ directory and edit the configuration ‘elasticsearch.yml’ configuration file.
cd /etc/elasticsearch/
vim elasticsearch.yml
Uncomment the ‘node.name’ and type your server hostname.
node.name: ELK20
On the ‘network.host’ line, type the server IP address that elasticsearch service will be running, and it’s recommended to use the only internal IP address.
network.host: 172.16.0.3
Uncomment the ‘http.port’ line and leave it as default, the elasticsearch service will be running on default port ‘9200’.
http.port: 9200
Uncomment the ‘cluster.initial_master_nodes’ line and type your server hostname.
cluster.initial_master_nodes: ["ELK20"]
And the last, enable the Elasticsearch security by adding the following configuration to the bottom of the line.
xpack.security.enabled: true
Save and close.
Next, reload the systemd service manager, then start the elasticsearch service and add it to the system boot.
systemctl daemon-reloadsystemctl start elasticsearch
systemctl enable elasticsearch
The Elasticsearch service is up and running on Ubuntu 20.04 Server.
Next, we will generate the password for the built-in user on Elasticsearch.
Go to the ‘/usr/share/elasticsearch’ directory and run the elasticsearch utility command ‘elasticsearch-setup-passwords’ as below.
cd /usr/share/elasticsearch/
bin/elasticsearch-setup-passwords auto -u "http://172.16.0.3:9200"
Type ‘y’ to confirm and generate the password.
Initiating the setup of passwords for reserved users elastic,apm_system,kibana,kibana_system,logstash_system,beats_system,remote_monitoring_user.
The passwords will be randomly generated and printed to the console.
Please confirm that you would like to continue [y/N] y
Below is the result you will get.
Changed password for user apm_system
PASSWORD apm_system = DP5RpFfbCyL6UpIFO8Q3Changed password for user kibana_system
PASSWORD kibana_system = U6gDLoJCqqChqcbD1IYVChanged password for user kibana
PASSWORD kibana = U6gDLoJCqqChqcbD1IYVChanged password for user logstash_system
PASSWORD logstash_system = KrHaGvHGfkAz12dcSeWoChanged password for user beats_system
PASSWORD beats_system = VnUUOtShQoFAGEZ62G7mChanged password for user remote_monitoring_user
PASSWORD remote_monitoring_user = xgaLXw6jp3Ses6CZ2hEBChanged password for user elastic
PASSWORD elastic = elu2ZlMm4mOkM7fgCeUM
As can be seen, the password for some built-in user on elasticsearch has been generated.
Gambar
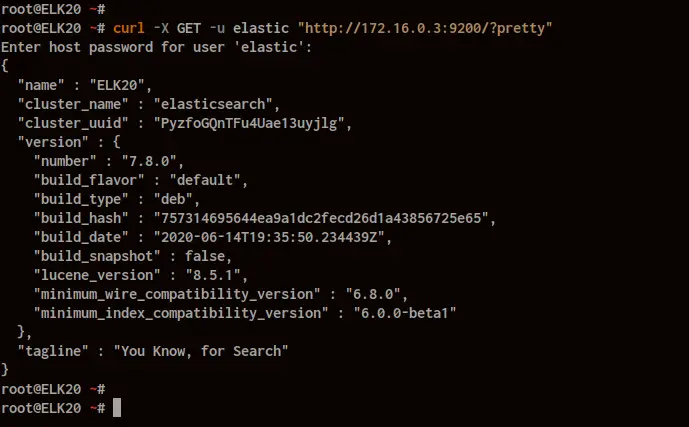
To test our Elasticsearch installation, run the curl command with the default user ‘elastic‘ as below.
curl -X GET -u elastic "http://172.16.0.3:9200/?pretty"
Type the password for ‘elastic‘ user, and below is the result you will get.
As a result, the Elasticsearch server is up and running with the authentication enabled on it.
Step 3 – Install and Configure Kibana
In this step, we will install and configure the Kibana on the same server as Elasticsearch. We will connect the Kibana to the Elasticsearch server with the default user ‘kibana_system’ and the generated password on top.
Install Kibana using the apt command below.
sudo apt install kibana
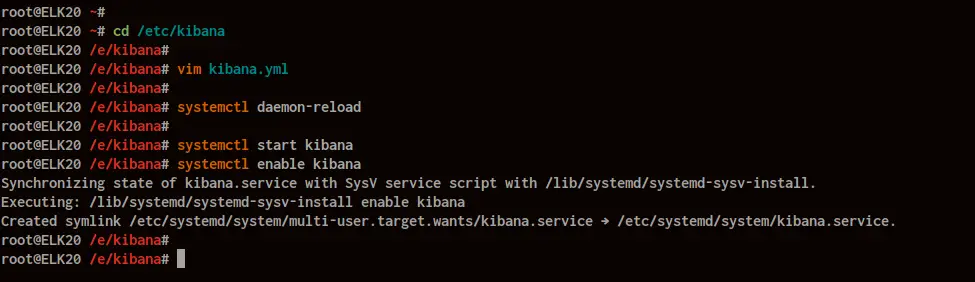
Once all installation is finished, go to the ‘/etc/kibana’ directory and edit the configuration ‘kibana.yml’ using vim editor.
cd /etc/kibana/
vim kibana.yml
Uncomment the following lines and change the values with your own. It’s recommended to run Kibana on the local network because we will be using the Nginx as a reverse proxy for Kibana.
server.port: 5601
server.host: "172.16.0.3"
server.name: "ELK20"
After that, change the ‘elasticsearch.url’ with your elasticsearch IP address.
elasticsearch.url: "http://172.16.0.3:9200"
Uncomment the following “elasticsearch.username” and ‘elasticsearch.password’ lines, and change the details with the user and password with your own.
elasticsearch.username: "kibana_system"
elasticsearch.password: "N88VBkkelfSV3mBfO6Vh"
Save and close.
Next, reload the systemd manager using the following command.
systemctl daemon-reload
After that, start the Kibana service and add it to the system boot.
systemctl start kibana
systemctl enable kibana
And the Kibana service is up and running on the Ubuntu 20.04 system.
Next, we will create a new user that will be used to log in to the Kibana dashboard.
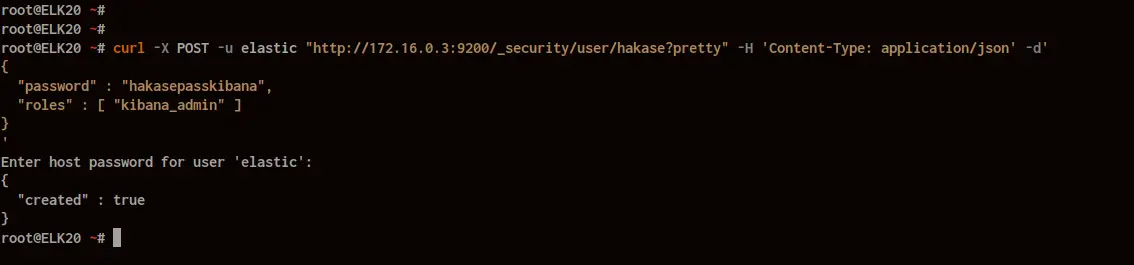
Create a new user named ‘hakase’ and the password ‘hakasepasskibana’ with the role ‘kibana_admin’ as below.
curl -X POST -u elastic "http://172.16.0.3:9200/_security/user/hakase?pretty" -H 'Content-Type: application/json' -d'
{
  "password" : "hakasepasskibana",
  "roles" : [ "kibana_admin" ]
}
'
Type the password for the ‘elastic’ user, and you will get the result as below.
As a result, the new user ‘hakase’ has been created and will be able to log in to the Kibana dashboard.
Step 4 – Setup Nginx as a Reverse Proxy for Kibana
In this step, we will install and configure Nginx as a reverse proxy for the Kibana.
Install Nginx packages using the apt command below.
sudo apt install nginx -y
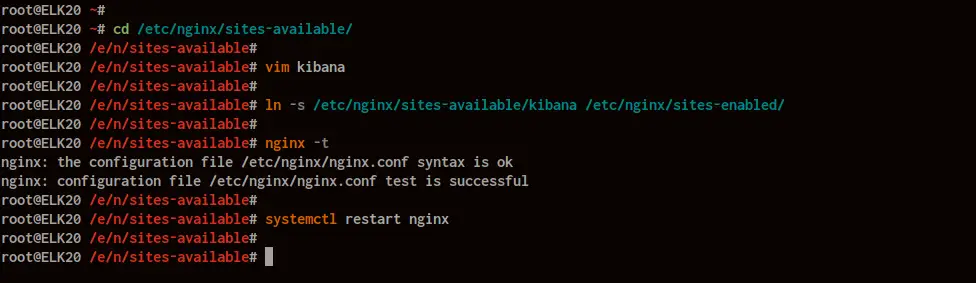
Once all installation is finished, go to the ‘/etc/nginx/sites-available/’ directory and create a new virtual host file ‘kibana’ using the vim editor.
cd /etc/nginx/sites-available/
vim kibana
Change the domain name and ‘proxy_pass’ IP address with your own, then paste into it.
server {
    listen 80;

    server_name elk.hakase-labs.io;

    location / {
        proxy_pass http://172.16.0.3:5601;
        proxy_http_version 1.1;
        proxy_set_header Upgrade $http_upgrade;
        proxy_set_header Connection 'upgrade';
        proxy_set_header Host $host;
        proxy_cache_bypass $http_upgrade;
    }
}
Save and close.
Next, activate the Nginx virtual host for Kibana and verify the Nginx configuration.
ln -s /etc/nginx/sites-available/kibana /etc/nginx/sites-enabled/
nginx -t
Make sure there is no error, then restart the Nginx service.
systemctl restart nginx
As a result, Nginx’s installation and configuration as a Reverse Proxy for Kibana have been completed. And the Kibana dashboard is now accessible through the domain name ‘elk.hakase-labs.io’.
Open your web browser and type the domain name of your Kibana installation on the address bar.
And you will get the Kibana login page as below.
Type the user ‘hakase’ with password ‘hakasepass’ and click the ‘Login‘ button.
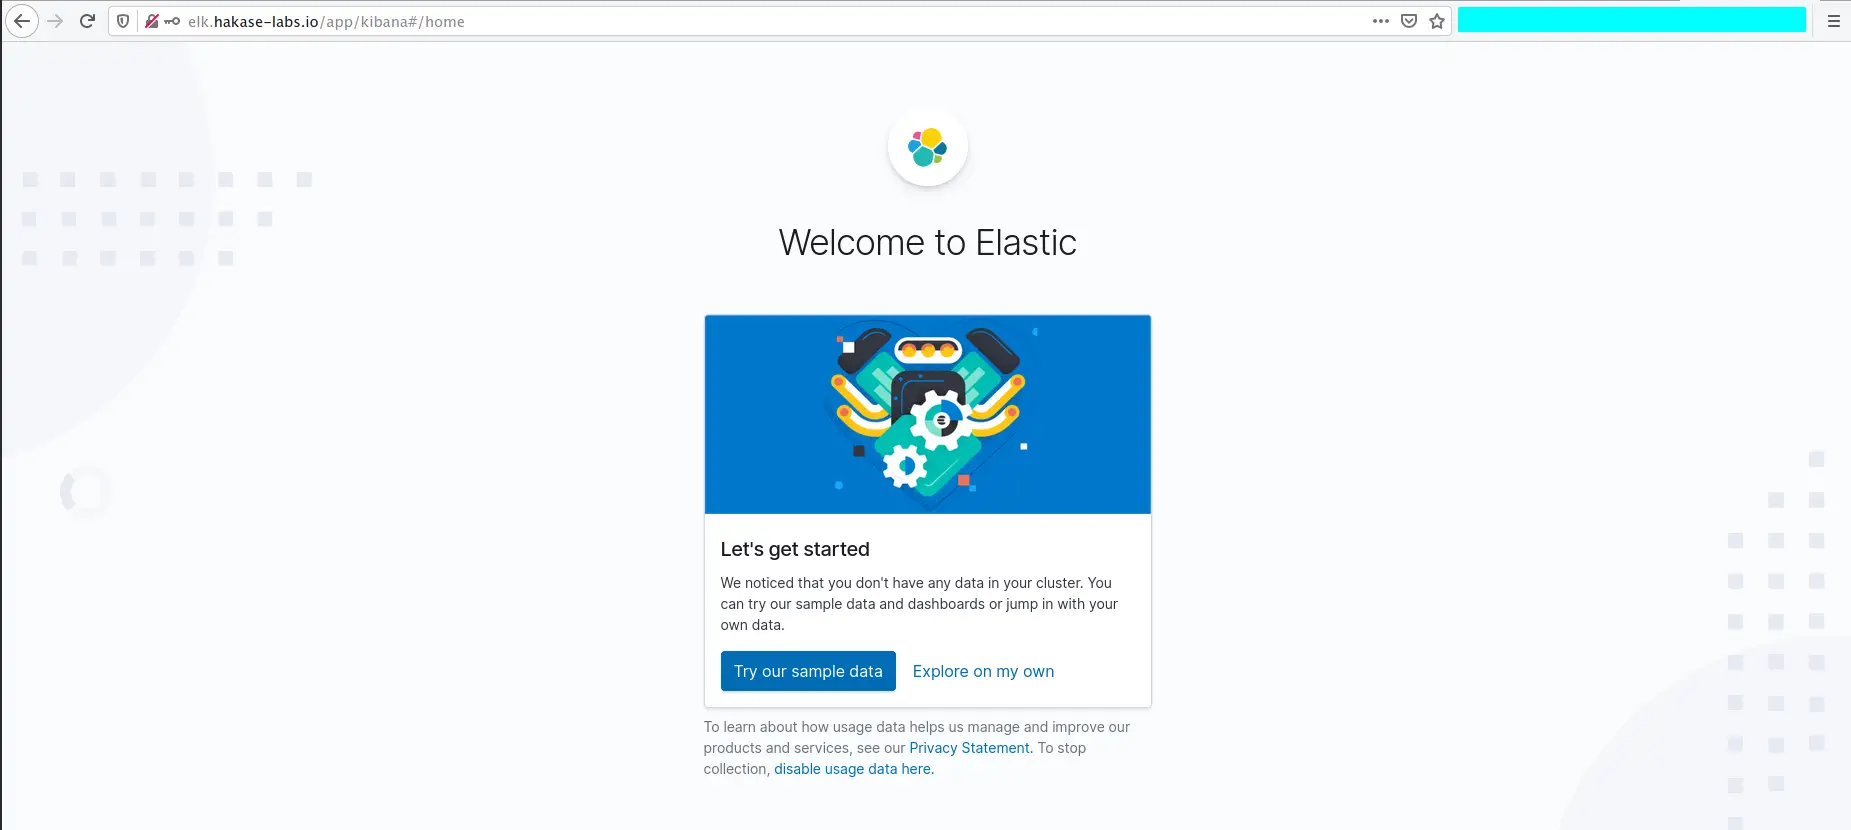
Once you’ve logged in, you will be asked to import the sample data or explore your data.
Click on the ‘Explore my own data‘ button.
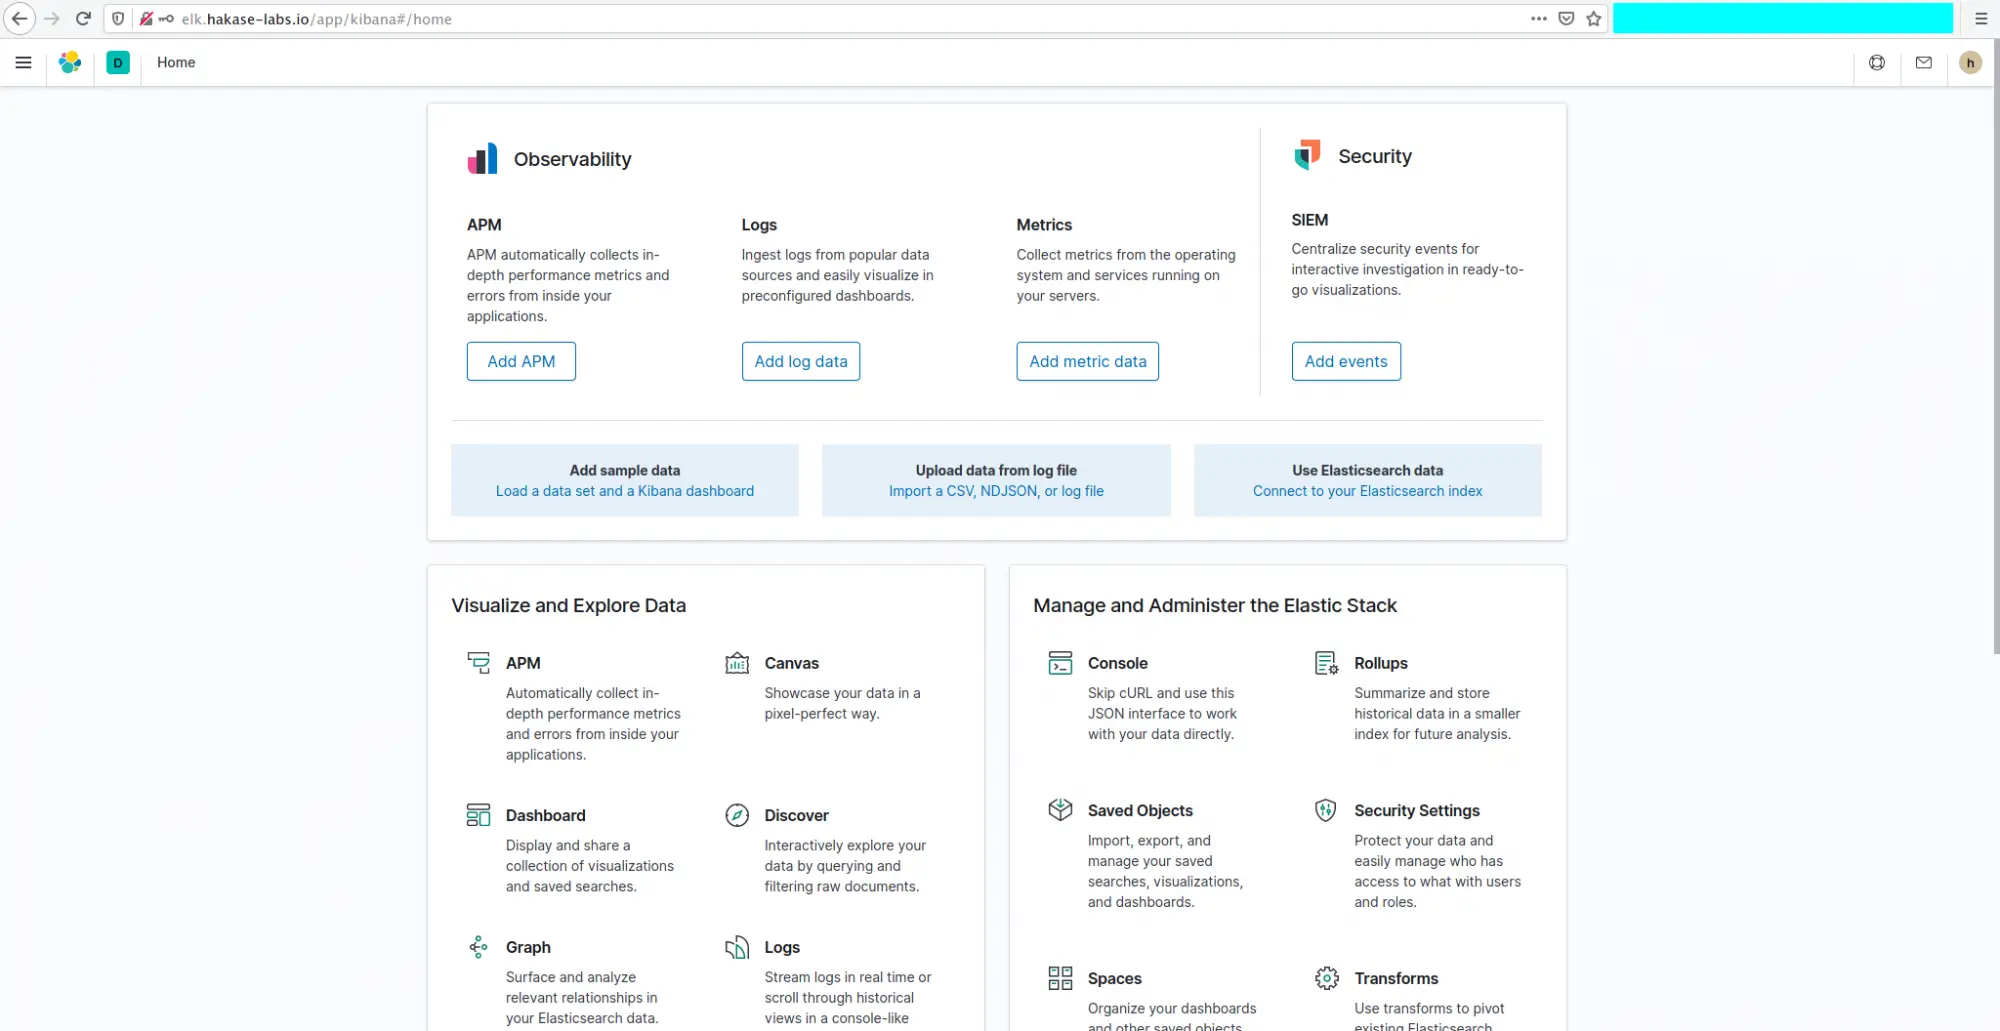
Now you will get the Kibana Dashboard as below.
As a result, The Kibana and Nginx installation have been completed.
Step 4 – Install and Configure Filebeat
In this step, we will install and “Filebeat” on the client machine with the hostname “client01” and the IP address “xxx.xxx.xxx.xxx”. The filebeat will send logs directly to the Elasticsearch server.
Before installing the “Filebeat”, make sure that the Elastic Stack repository has been added to your system.
Now install the filebeat package using the apt command below.
sudo apt install filebeat
Once all installation is finished, go to the ‘/etc/filebeat’ directory and edit the configuration ‘filebeat.yml’ using vim editor.
cd /etc/filebeat/
vim filebeat.yml
On top of the ‘filebeat.inputs’ configuration, change the ‘enabled: false’ to ‘enabled: true’ as below.
filebeat.inputs:
- type: log
  enabled: true
  paths:
    - /var/log/*.log
Next, move to the Kibana configuration and change the host with the Kibana IP address and port, change the username with default user ‘kibana’, and the password generated on top.
setup.kibana:
  host: "172.16.0.3:5601"
  username: "kibana"
  password: "U6gDLoJCqqChqcbD1IYV"
After that, move to the ‘output.elasticsearch’ configuration and change details with your own.
output.elasticsearch:
  hosts: ["172.16.0.3:9200"]
  username: "elastic"
  password: "elu2ZlMm4mOkM7fgCeUM"
Save and close.
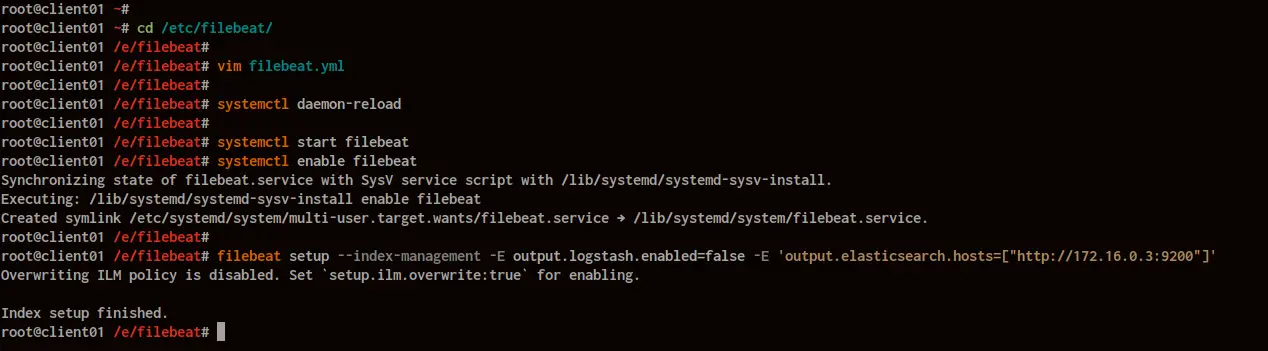
Now reload the systemd manager, start the filebeat service and add it to the system boot.
systemctl daemon-reloadsystemctl start filebeat
systemctl enable filebeat
The filebeat service is up and running on the “client01” machine.
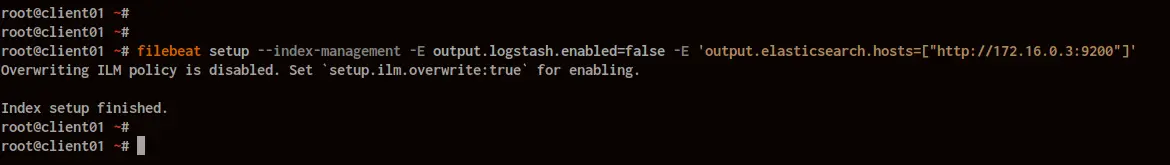
Next, we need to load the filebeat index template to the Elasticsearch server using the following command.
filebeat setup --index-management -E output.logstash.enabled=false -E 'output.elasticsearch.hosts=["http://172.16.0.3:9200"]'
Below is the result you will get.
As a result, the filebeat index template is loaded to the Elasticsearch server, and it will be available at the Kibana Dashboard as a ‘filebeat-*’ index pattern.
Step 5 – Setup New Role for Kibana User
In this step, we will create a new elasticsearch role that allows our user ‘hakase’ to access and manage all indices on the Elasticsearch server through the Elasticsearch API.
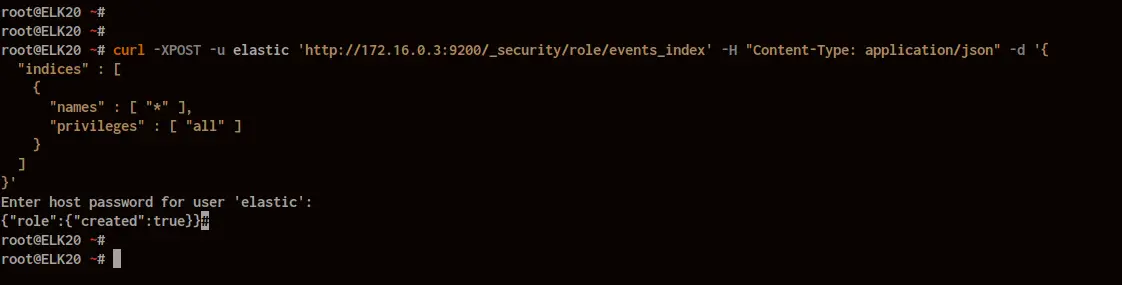
Create a new role named ‘events_index‘ that allows users only to manage indices on the Elasticsearch server using the following command.
curl -XPOST -u elastic 'http://172.16.0.3:9200/_security/role/events_index' -H "Content-Type: application/json" -d '{
  "indices" : [
    {
      "names" : [ "*" ],
      "privileges" : [ "all" ]
    }
  ]
}'
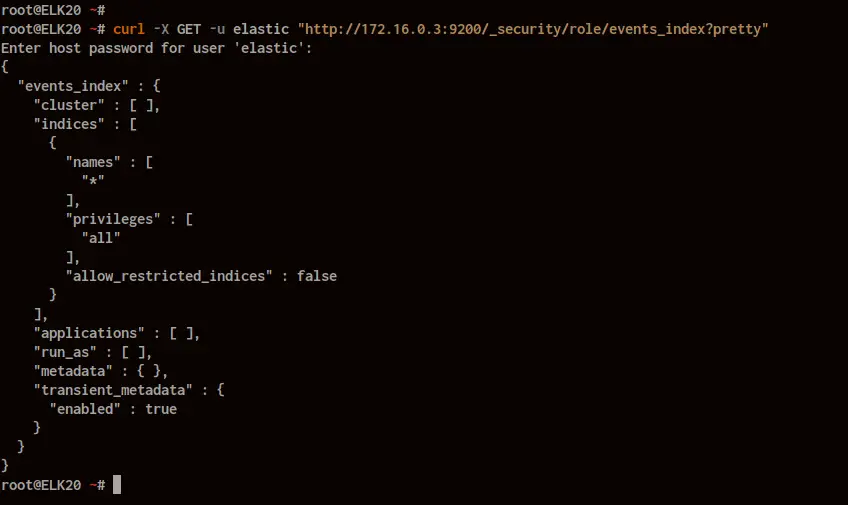
After that, check the role ‘events_index‘ using the command below.
curl -X GET -u elastic "http://172.16.0.3:9200/_security/role/events_index?pretty"
Below is the result you will get.
As can be seen, the role ‘events_index’ will only have privileges to manage indices.
Next, add the ‘events_index’ role to our user ‘hakase’ using the command below.
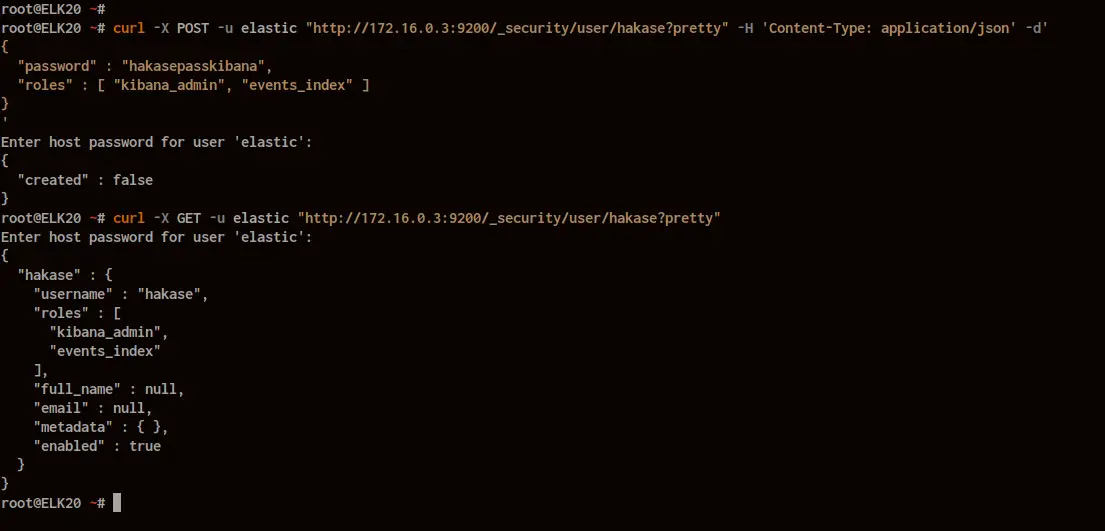
curl -X POST -u elastic "http://172.16.0.3:9200/_security/user/hakase?pretty" -H 'Content-Type: application/json' -d'
{
  "password" : "hakasepasskibana",
  "roles" : [ "kibana_admin", "events_index" ]
}
'
Type the password for ‘elastic‘ user, and the role ‘events_index‘ has been assigned to the ‘hakase‘ user.
Check all available roles under the user ‘hakase’ using the following command.
curl -X GET -u elastic "http://172.16.0.3:9200/_security/user/hakase?pretty"
Below is the result you will get.
As a result, we’ve created a new role in managing indices on the Elasticsearch server.
Step 6 – Create New Index Pattern Filebeat
After creating a new role named ‘events_index’, we will create a new index pattern for Filebeat through the ‘hakase‘ user.
– Create Index Pattern
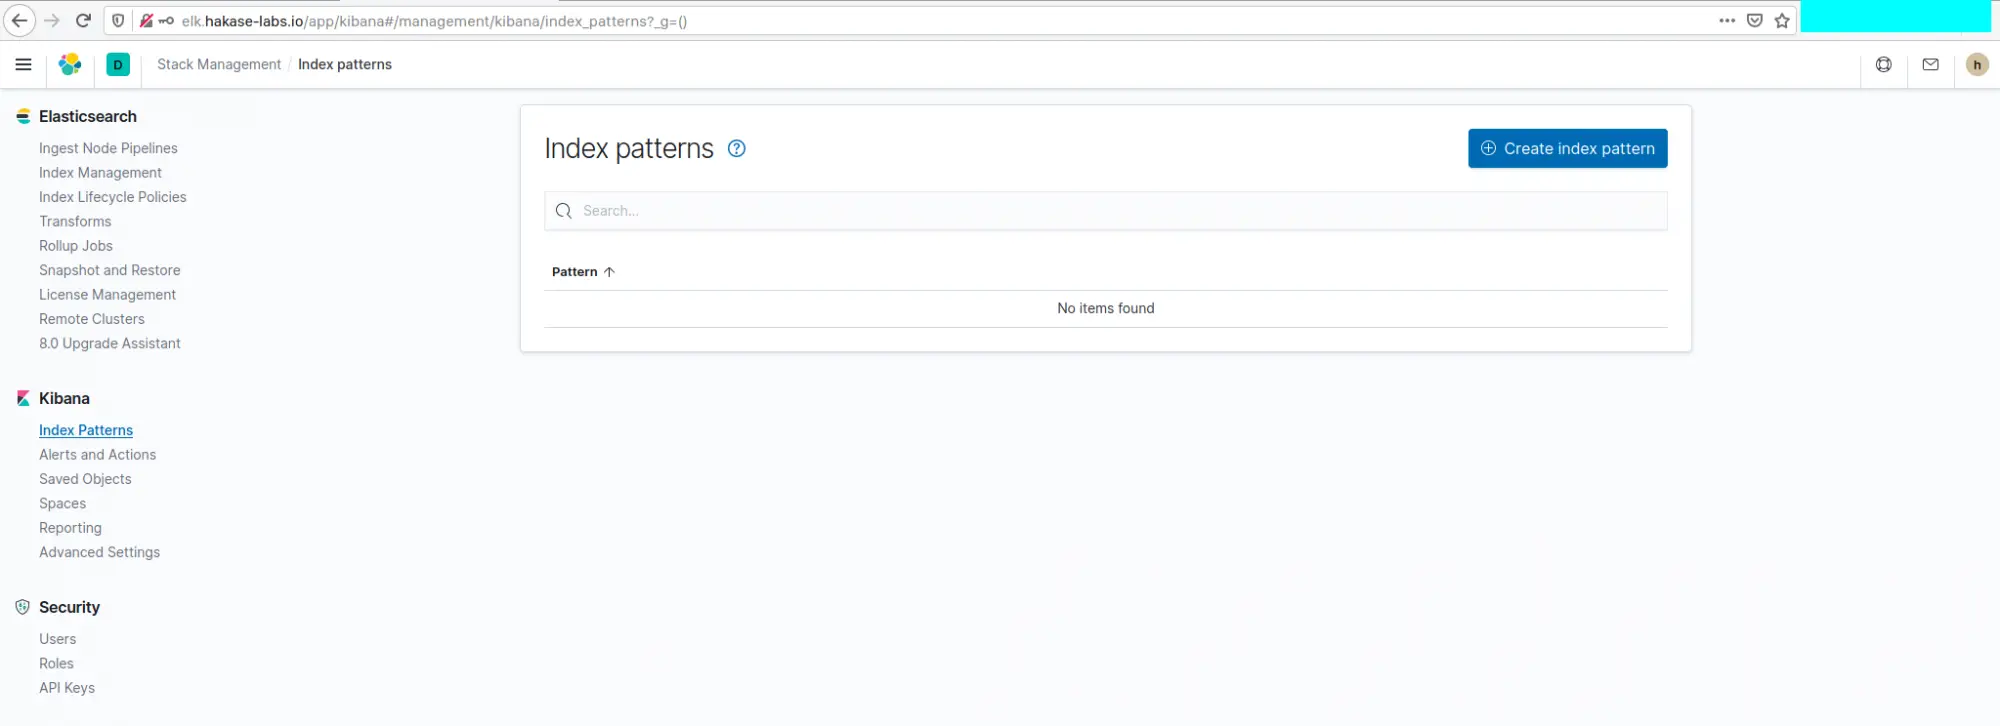
On the Kibana Dashboard, click the left menu option, move to the “Management” section, and click the “Stack Management“.
On the “Kibana” section, click the “Index Pattern“.
Click the “Create index pattern” button to create a new index pattern.
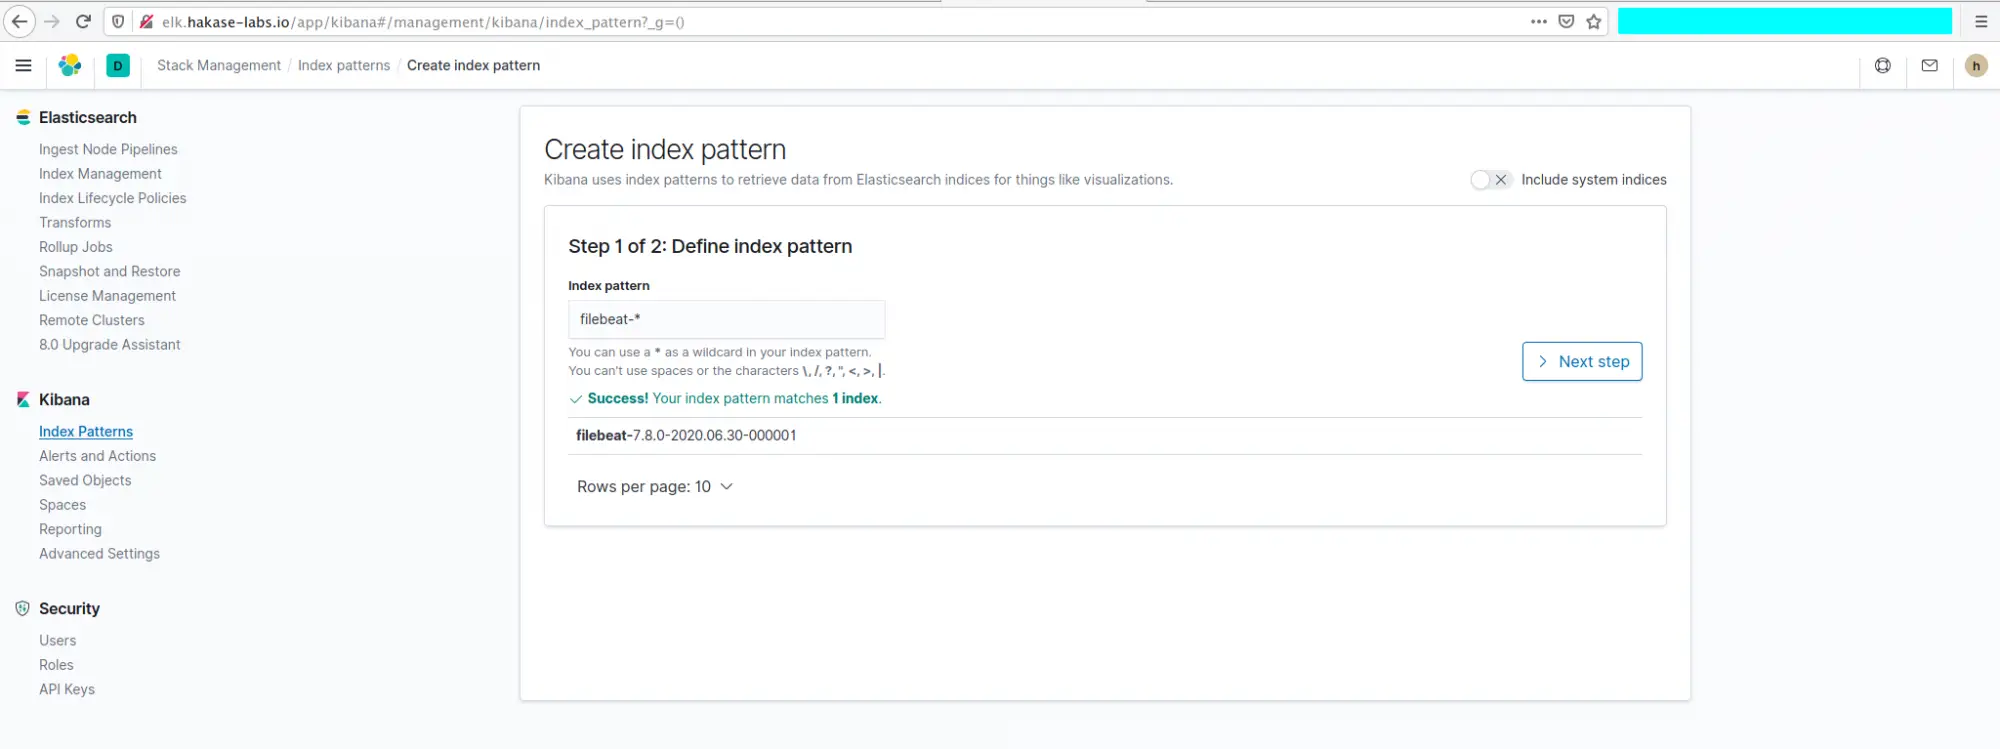
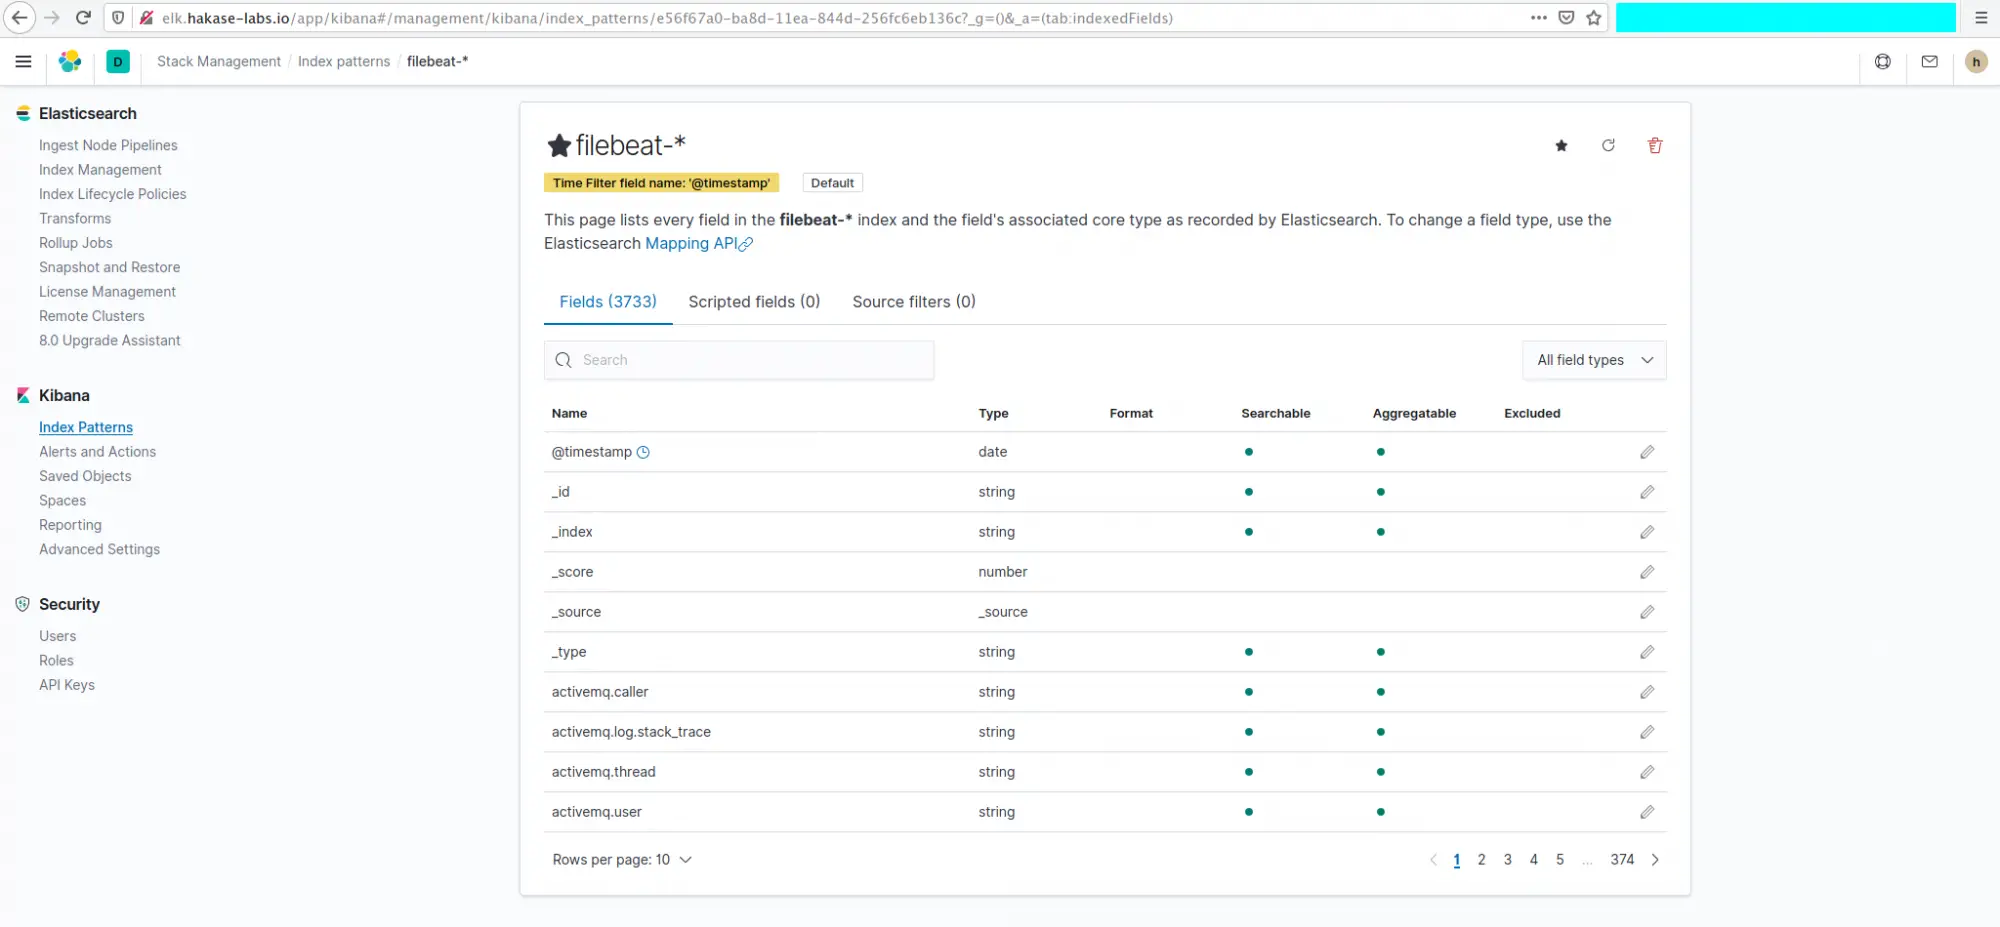
On the “index pattern” field, type “filebeat-*” and click the “Next step” button.
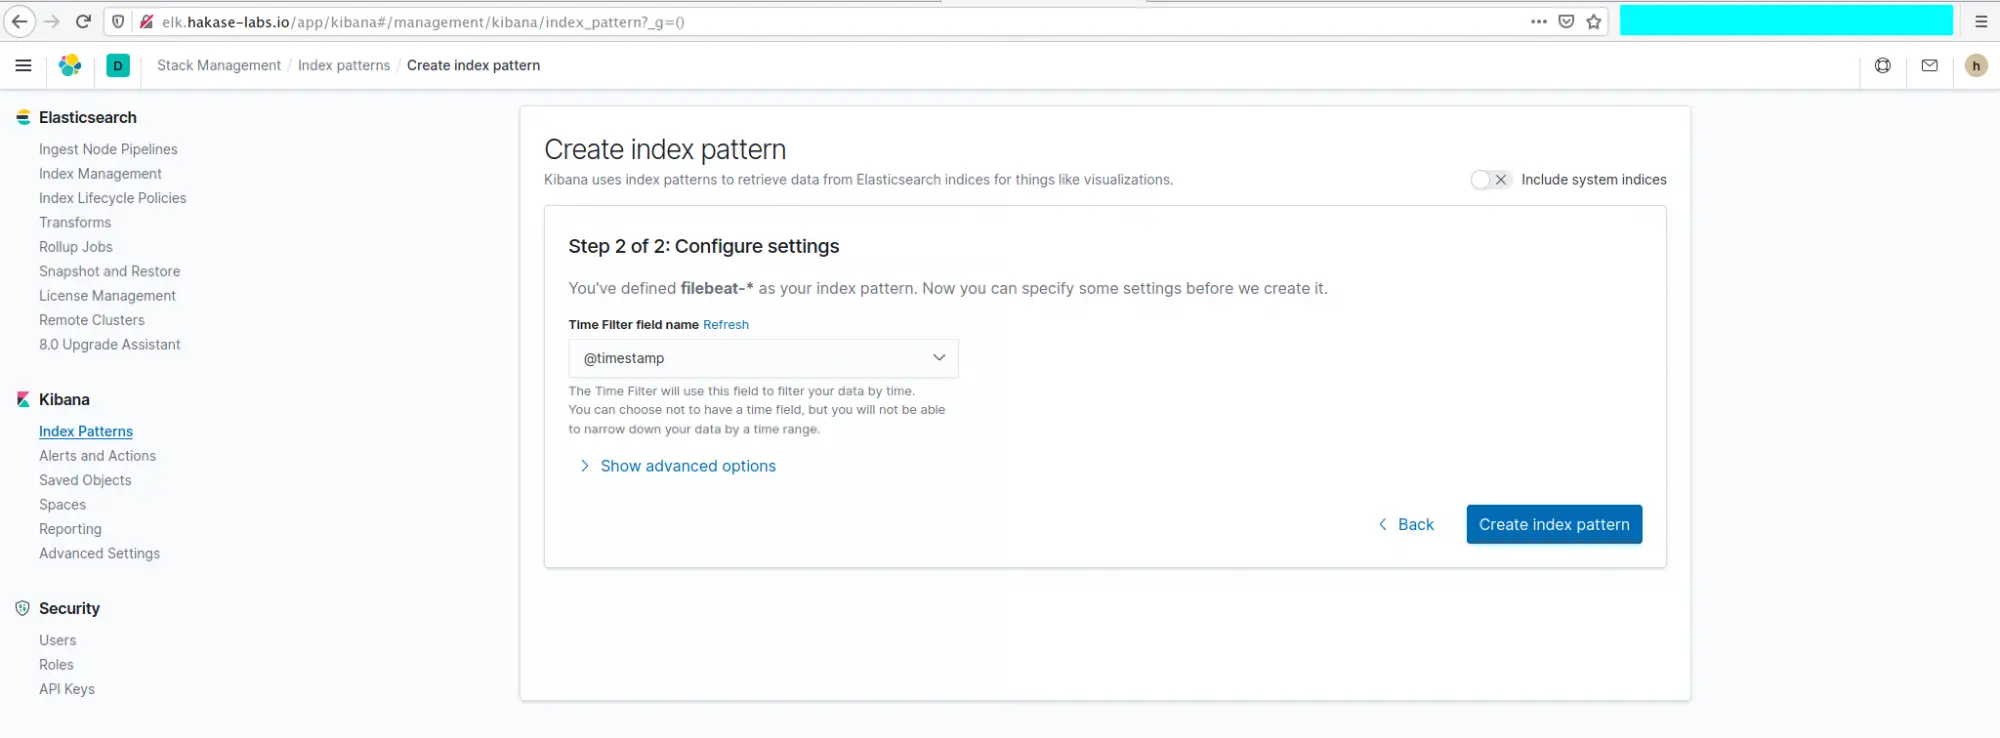
On the “Time Filter field name”, choose “@timestamp” and click the “Create index pattern” button.
And the “filebeat-*” index pattern has been created, and it’s selected as default index pattern (if you don’t have any index pattern before).
– Show Data on Kibana
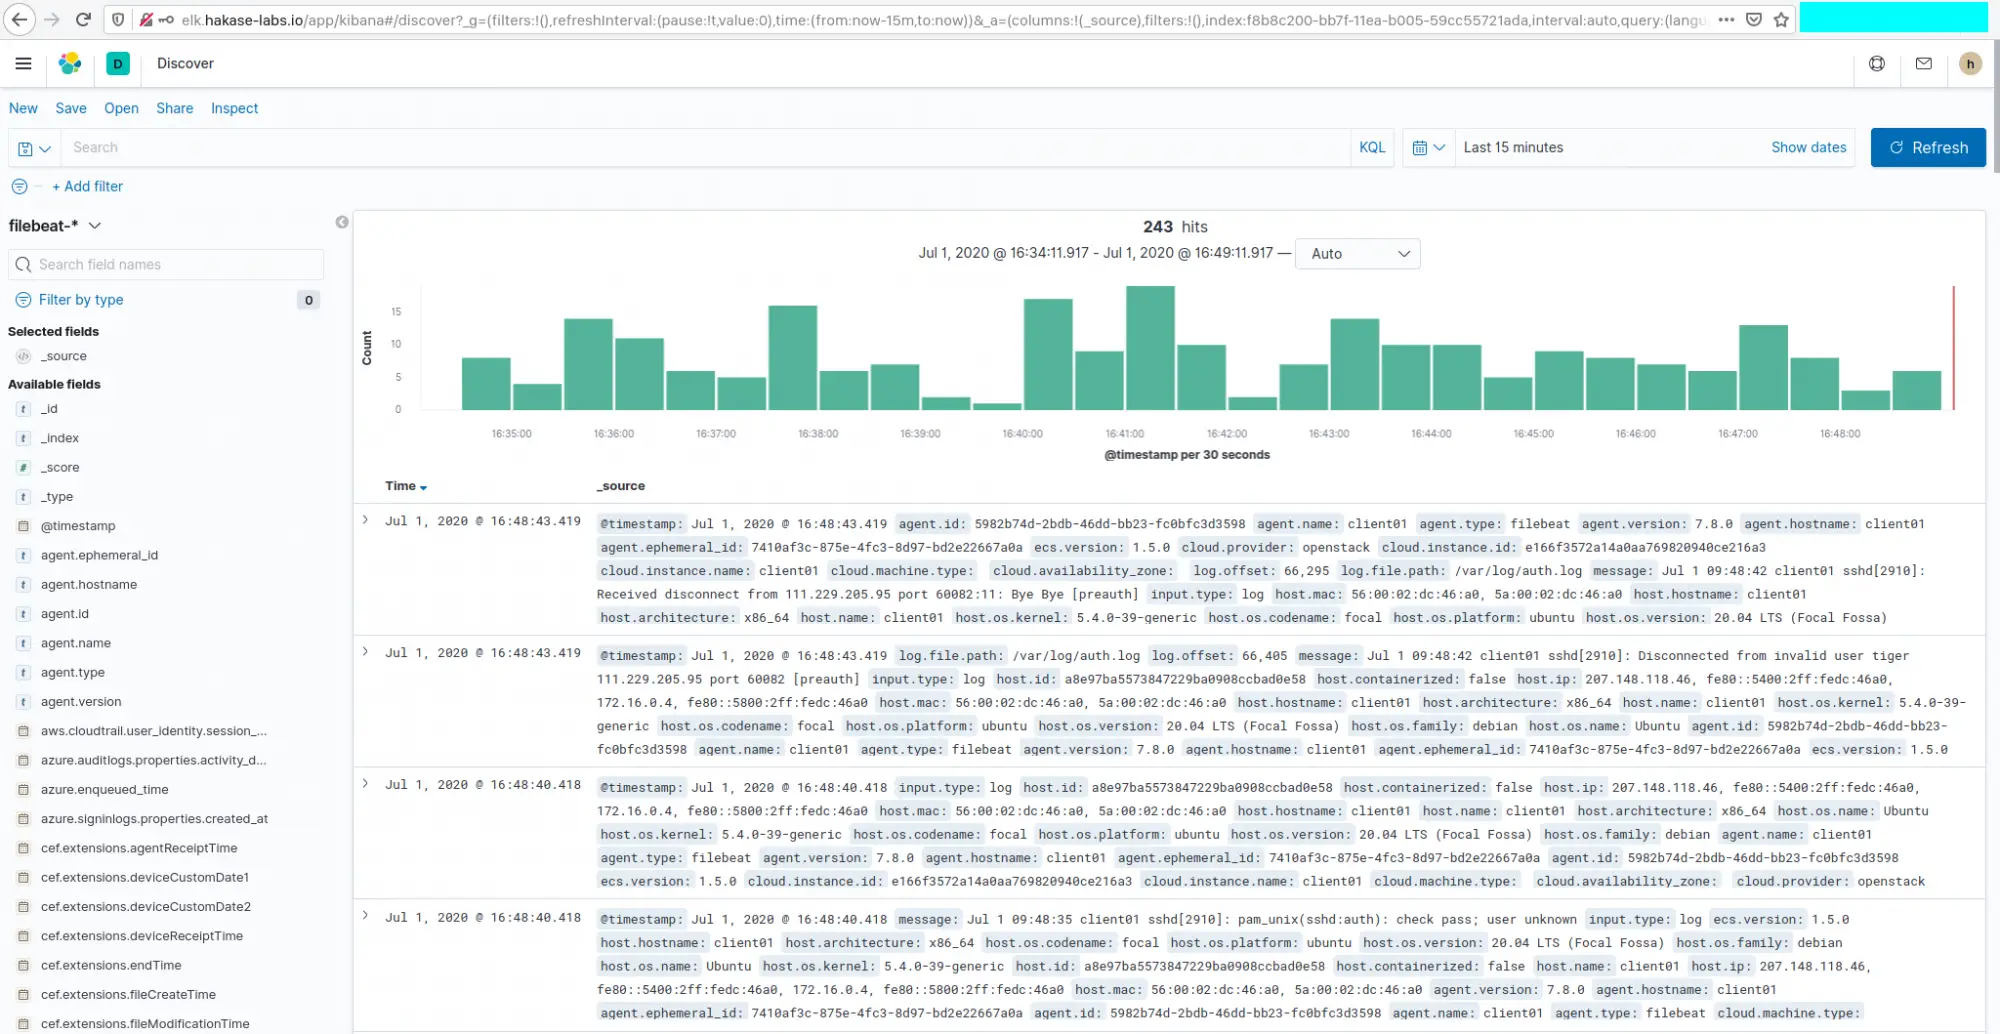
To show data gathered by filebeat, click the options menu on the top left, then click “Discover“.
And you will get all data gathered by filebeat from the “client01” machine.
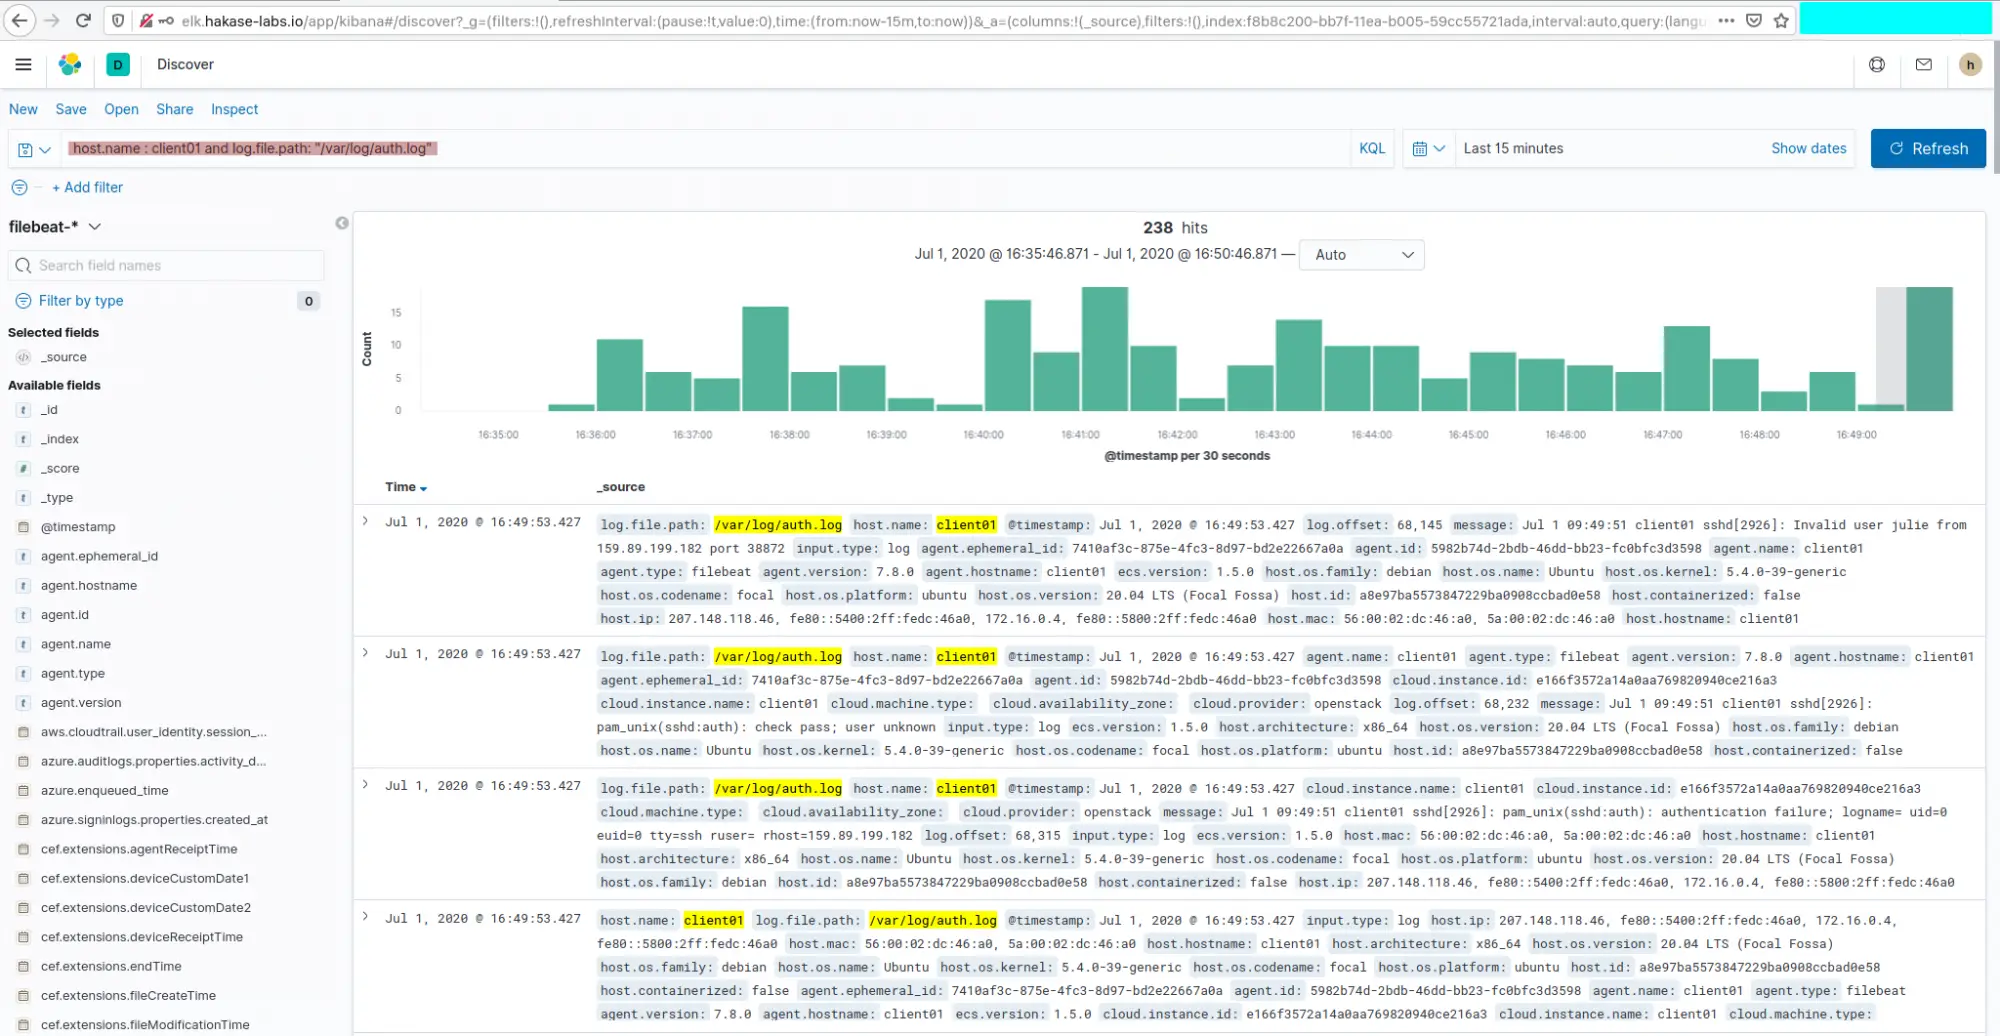
To show data based on your filter, you can use the “KQL” or Kibana Query Language.
Type the following query on the “KQL” field.
host.name : client01 and log.file.path: "https://www.howtoforge.com/var/log/auth.log"
And you will get all information about the SSH authentication on the “client01” machine.
As a result, the installation of Elastic Stack with security enabled on Ubuntu 20.04 has been completed successfully.


 on Ubuntu 24.04")