
Prometheus is an open-source monitoring and alerting platform. Originally, Prometheus was created by Soundcloud in 2012. Since then, the Prometheus project adopted by some famous companies abe become a bigger project with very active developers and community. In 2016, the Prometheus project was graduated under the Cloud Native Computing Foundation (CNCF).
This guide will show you how to install Prometheus and Node Exporter on the Debian 12 server.
Prerequisites
To get started, ensure you have the following:
- A Debian 12 server.
- A non-root user with sudo administrator privileges.
Basic Concepts You Must Know
Basically, Prometheus collects data and metrics through HTTP endpoints from target servers and then stores all data as times series. In Prometheus, time-series data are identified by metric name and key/value pairs.
Prometheus provides flexibility through the Prometheus Query Language (PromQL). You can use PromQL to query the Prometheus time-series database.
On the target servers, you must install the ‘exporter’ application that exposes all data and metrics to Prometheus. ‘Node Exporter’ is a commonly used exporter to monitor Linux machines.
Node exporter exposes hardware and kernel-related matrics from Linux machines. It comes as a single binary file that will expose data end metrics to the Prometheus server.
Installing Prometheus and Node Exporter
Prometheus is an open-source monitoring system for collecting systems metrics. Prometheus uses an exporter for collecting system metrics, such as Node Exporter which allows you to collect metrics for your system.
On the latest Debian version, both Prometheus and Node Exporter are available on the repository and can be installed using the APT package manager.
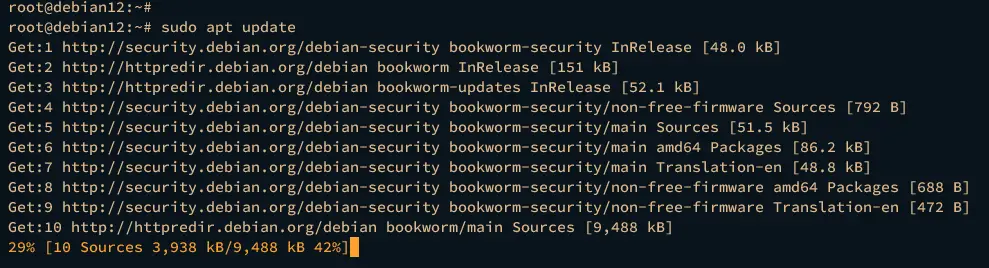
First, update and refresh your Debian package index by executing the following command.
sudo apt update
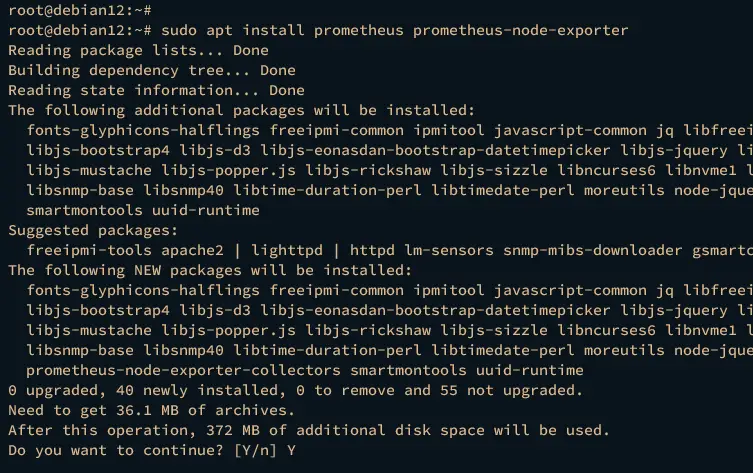
Now install Prometheus and Node Exporter via the apt command below. The Debian repository provides Prometheus 2.42.0 and Node Exporter 1.5.0.
sudo apt install prometheus prometheus-node-exporter
Type Y to proceed with the installation.
After installation is finished, both Prometheus and Node Exporter will be running as a systemd service and enabled automatically. The prometheus will have the service prometheus, and the Node Exporter will have the service prometheus-node-exporter.
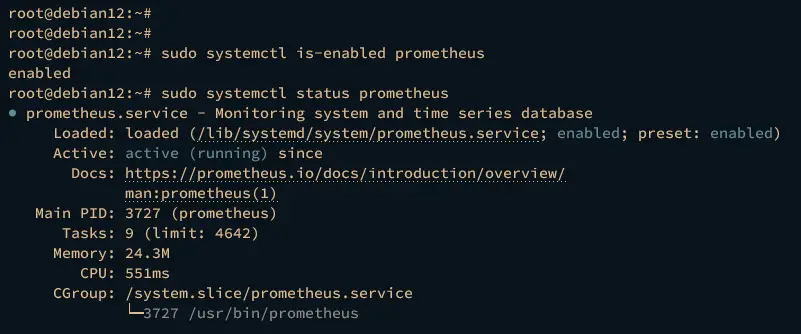
Verify the prometheus service using the following command.
sudo systemctl is-enabled prometheus
sudo systemctl status prometheus
The displayed output below reveals that the prometheus service is running and enabled. And by default, it is running on port 9090.
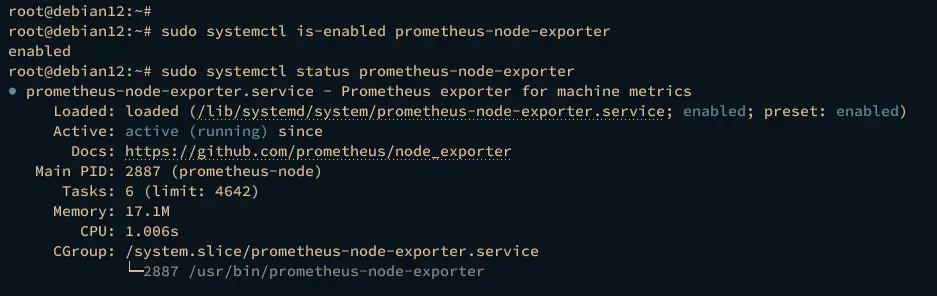
Now verify the prometheus-node-exporter service by executing the following command.
sudo systemctl is-enabled prometheus-node-exporter
sudo systemctl status prometheus-node-exporter
The displayed output will be similar, which reveals the prometheus-node-exporter service is running and enabled. The default port for Node Exporter is 9100.
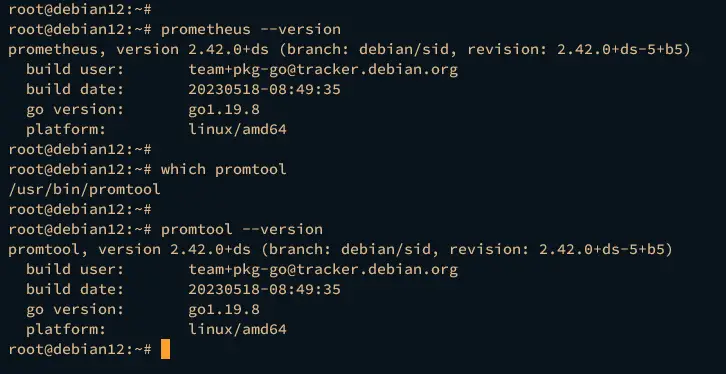
Next, run the prometheus command below to verify the Prometheus version.
prometheus --version
Then, check the binary path of promtool and its version like this. The promtool is a command line for managing the Prometheus monitoring system.
which promtool
promtool --version
Based on the displayed output, Prometheus and promtool 2.42.0 are installed.
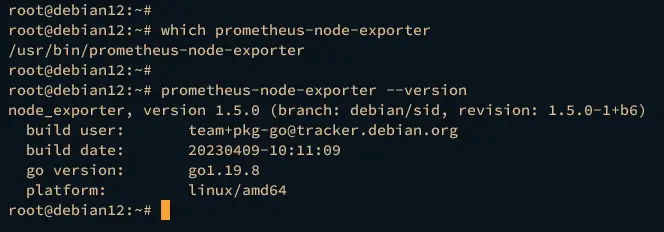
Lastly, verify the Node Exporter binary path prometheus-node-exporter and its version using the following command.
which prometheus-node-exporter
prometheus-node-exporter --version
The displayed output below confirms that Node Exporter 1.5 is installed.
Configuring Prometheus
After installing Prometheus and Node Exporter, the next step you will configure Prometheus by editing the default configuration file prometheus.yml which is located in the prometheus configuration directory /etc/prometheus.
Open the default Prometheus configuration /etc/prometheus/prometheus.yml using the following nano editor command.
sudo nano /etc/prometheus/prometheus.yml
Within the scrape_configs section, add a new job prometheus with the target endpoint 192.168.10.15:9090, which is the Prometheus server itself.
# A scrape configuration containing exactly one endpoint to scrape:
# Here it's Prometheus itself.
scrape_configs:
# The job name is added as a label `job=` to any timeseries scraped from this config.
- job_name: "prometheus"# metrics_path defaults to '/metrics'
# scheme defaults to 'http'.static_configs:
- targets: ["192.168.10.15:9090"]
Save the file and exit the editor when you’re finished.
Now run the systemctl command below to restart the prometheus service and apply the changes you’ve made.
sudo systemctl restart prometheus
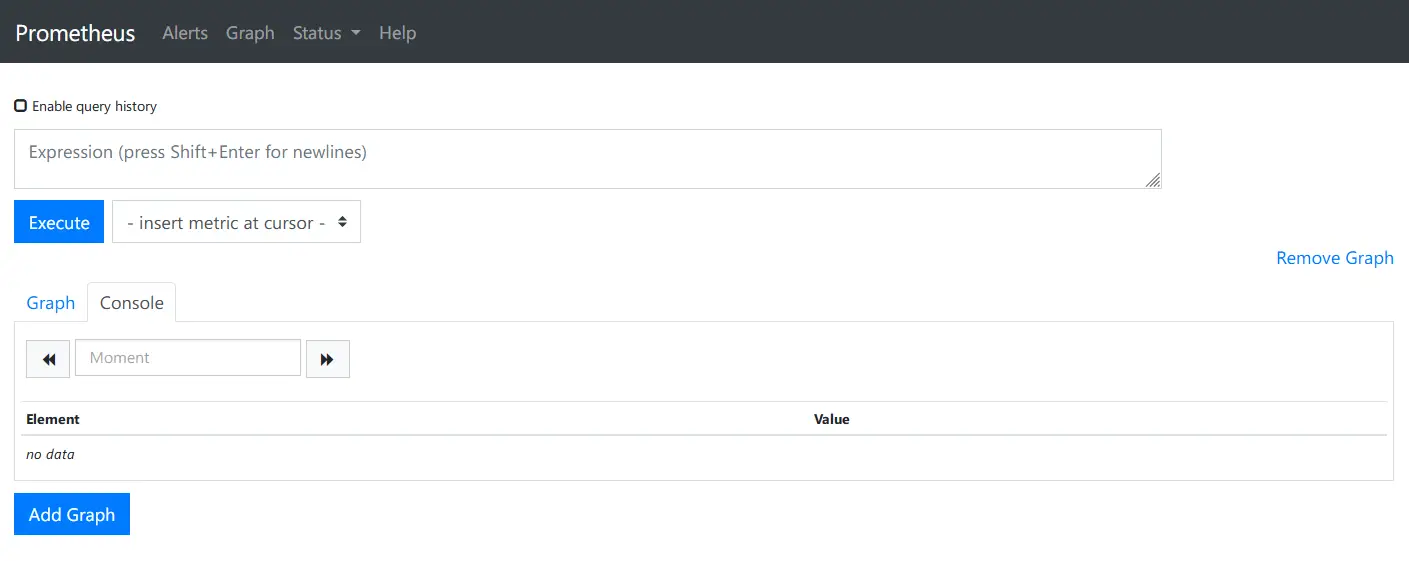
Now launch your web browser and visit your Prometheus installation, such as http://192.168.10.15:9090. If everything is working correctly, you should see the Prometheus dashboard in the following command.
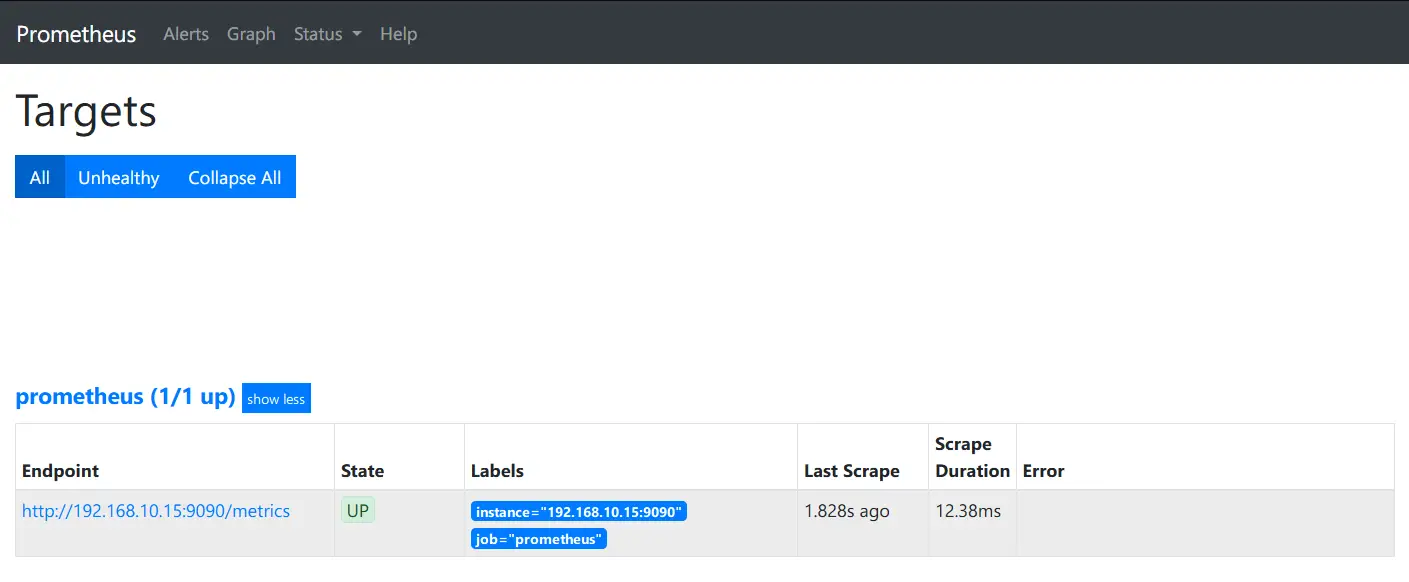
Click on the menu Status > Targets to get the list of endpoints of the target monitoring system. You should see the endpoint prometheus with the status Up.
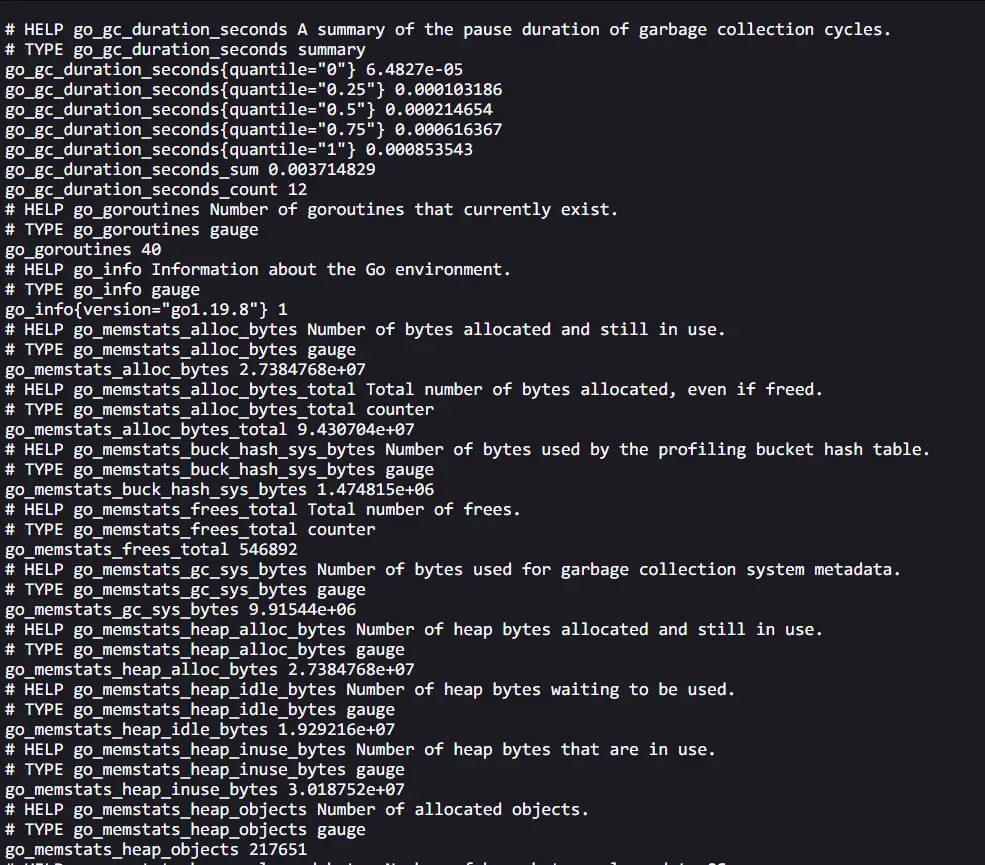
Lastly, you can also verify the Prometheus metrics by visiting the path URL /metrics, such as http://192.168.10.15:9090/metrics. You should see similar metrics data generated by Prometheus.
Adding Node Exporter to Prometheus
Now that you’ve configured Prometheus, the next step is to add Node Exporter to your Prometheus installation. The Node Exporter will gather metrics from your server. To achieve that, you must complete the following:
- Checking Node Exporter Status: This will ensure that Node Exporter is running before going further.
- Adding New Job to Prometheus: This will show you how to add a target monitoring system to Prometheus.
Now let’s begin.
Checking Node Exporter Status
Before adding Node Exporter to Prometheus, you must ensure that Node Exporter is running without any errors. This can be achieved by checking the prometheus-node-exporter service status, checking the port 9100 that is used by Node Exporter, and accessing the Node Exporter metrics from your browser.
Check the prometheus-node-exporter service status by executing the following command.
sudo systemctl status prometheus-node-exporter
If running, the prometheus-node-exporter service status should be like this:
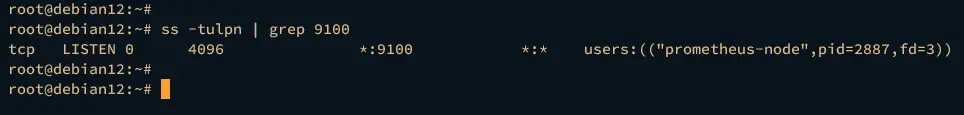
Now run the command below to ensure port 9100 is in the LISTEN state, which the Node Exporter uses.
ss -tulpn | grep 9100
The following output confirms that Node Exporter uses port 9100.
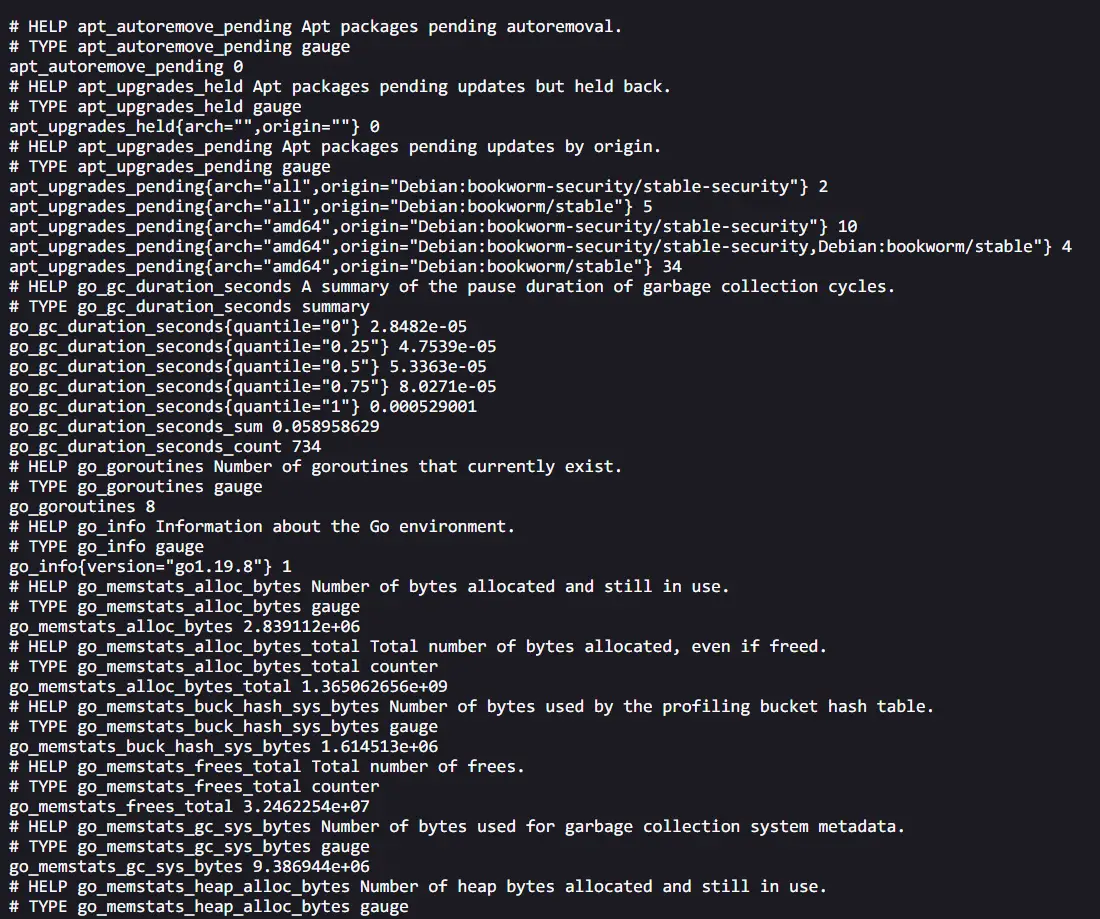
Lastly, open your web browser and visit the Node Exporter metrics URL, such as http://192.168.10.15:9100/metrics. You should see the generated metrics by Node Exporter like the following:
Adding New Job to Prometheus
Now that the Node Exporter is running, you’re ready to add Node Exporter to the Prometheus.
Open the Prometheus configuration /etc/prometheus/prometheus.yml using the following nano editor command.
sudo nano /etc/prometheus/prometheus.yml
Within the scrape_configs section, add a new job prometheus-node-exporter with the endpoint of the Node Exporter metrics like the following.
  - job_name: 'prometheus-node-exporter'
    scrape_interval: 5s
    static_configs:
      - targets: ['192.168.10.15:9100']
Save the file and exit the editor when finished.
Next, execute the following systemctl command to restart the prometheus service and apply the changes.
sudo systemctl restart prometheus
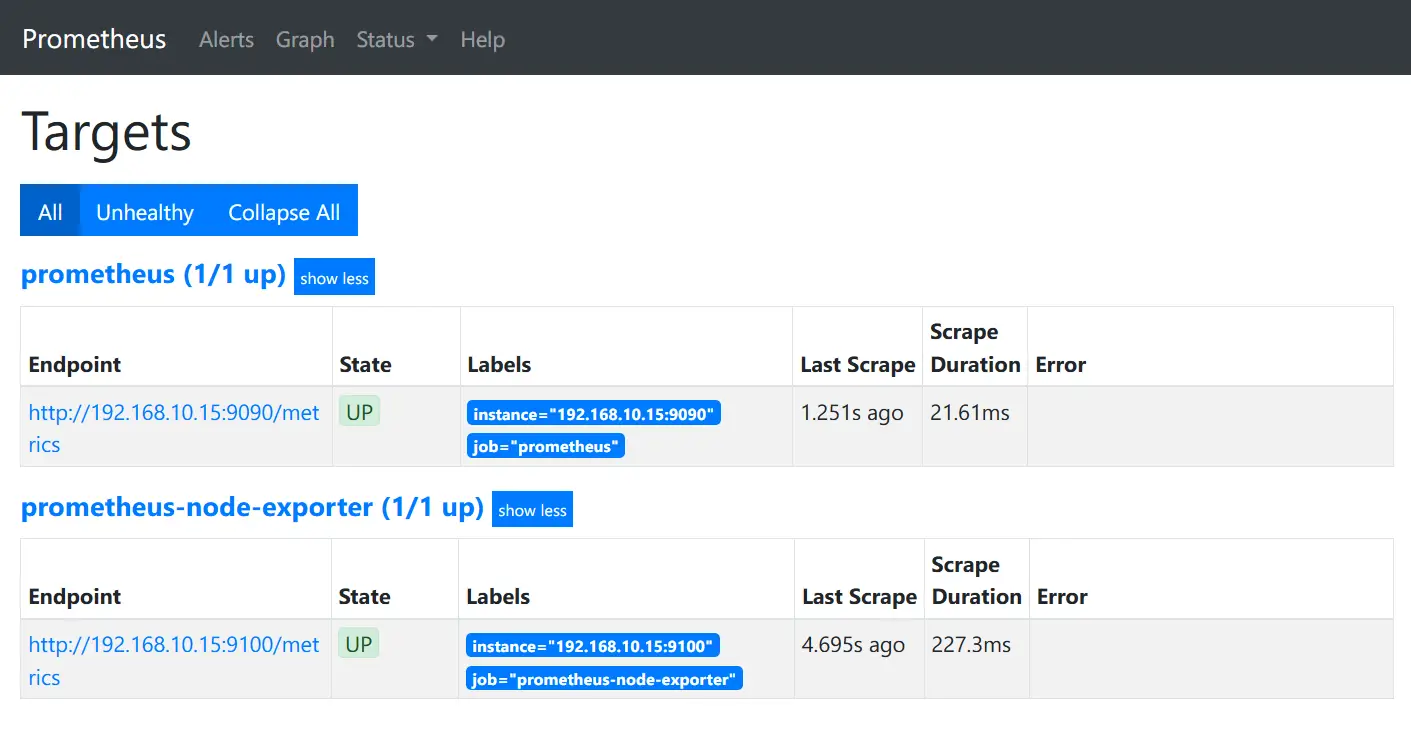
Lastly, back to the Prometheus dashboard, then click Status > Targets menu. If everything goes well, you should see the Node Exporter on the target endpoint.
Basic Usage of Prometheus Dashboard
In this section, you will learn the basic query of Prometheus and Node Exporter, which can be executed from the Prometheus dashboard.
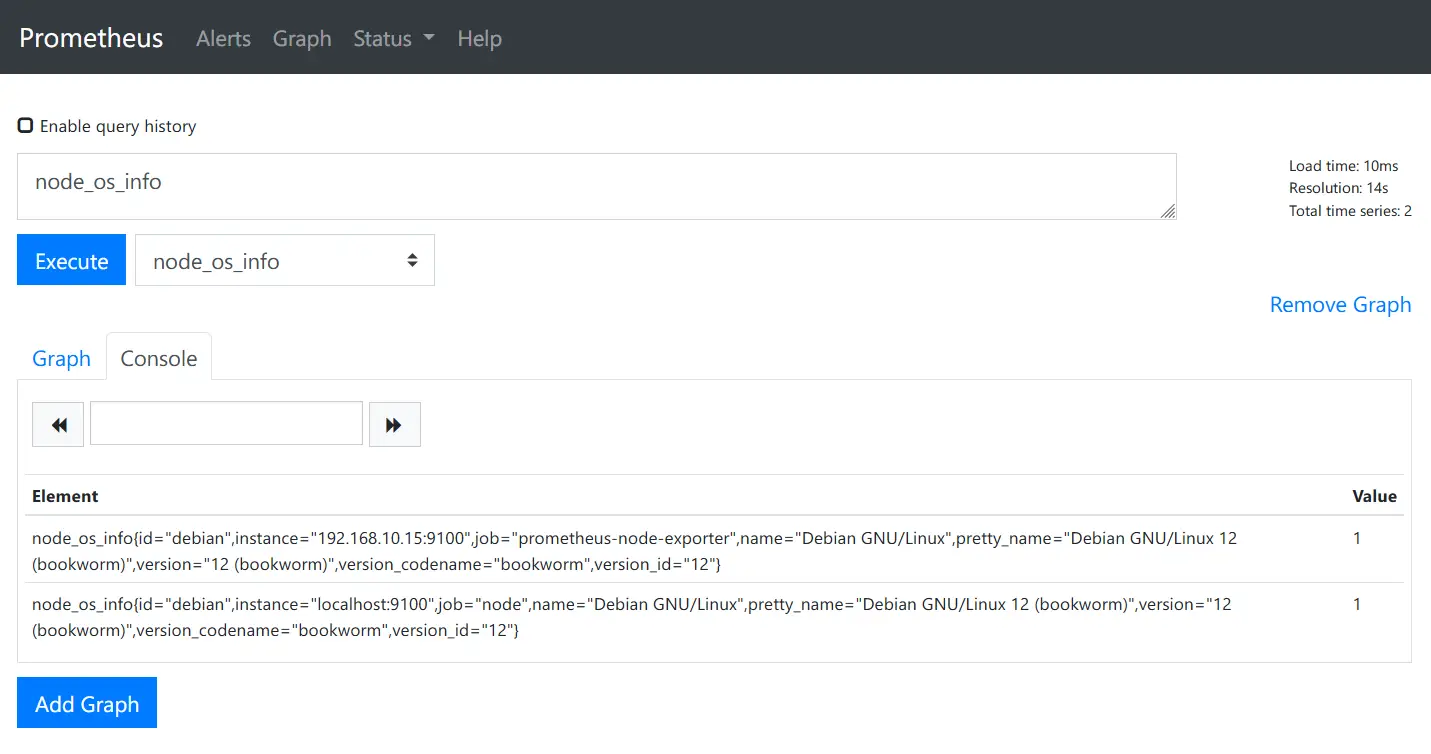
Type the query node_os_info and click the Execute button. The node_os_info is a query language provided by Node Exporter for checking operating system details.
On the Console section, you should see detailed host informations like the following:
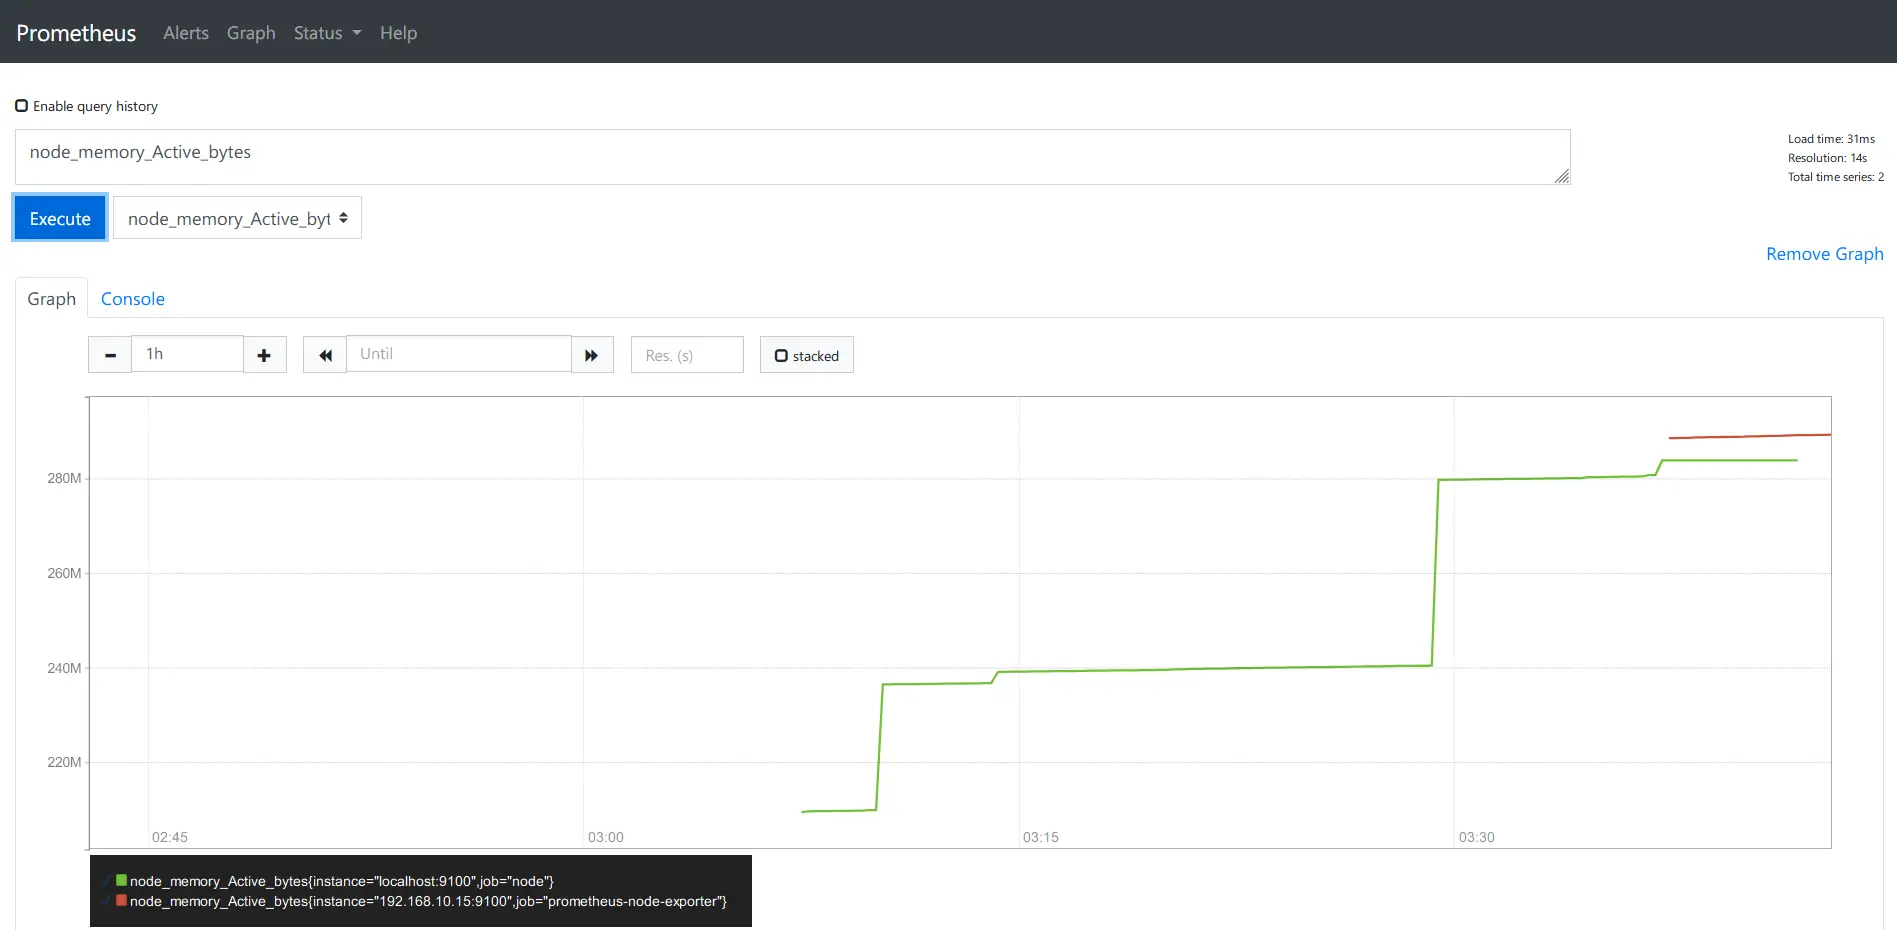
Next, type another query such as node_memory_Active_bytes to check active memory on the target server. In the Graph section, you should see similar results like the following:
Furthermore, you can also use PromQL (Prometheus Query Language) to get specific data, such as node_memory_Active_bytes[5] that will show you data for the last 5 minutes.
Conclusion
To wrap up, you’ve completed the installation of Prometheus and Node Exporter on the Debian 12 server step-by-step. You’ve installed Prometheus and Node Exporter via APT from the official Debian repository. You’ve also learned the basic usage of the Prometheus dashboard for testing queries. You can now install additional components such as Alert Manager and Grafana to your monitoring system.


