
Using a monitoring tool gives you a great opportunity to increase the uptime and the reliability of your infrastructure. In fact, monitoring is essential for any organization. In my previous tutorial, I already mentioned the importance of monitoring and showed how to install Checkmk on a Linux server. Now, I am using a normal PC running on Windows 10 to run Checkmk in Docker and want to show you how you can run Checkmk on a normal computer. You do not need any monitoring or Linux experience. This tutorial is also suited for Windows users and gives you an easy introduction to the professional monitoring world.
Requirements
You need a host system that can run Docker containers. This tutorial will use Docker Desktop Version 4.3.2 for Windows, which you will have to install as the first step, unless you use another Docker engine. In case you also use Docker under Windows, make sure that your host system has enough hardware resources: As a Linux-based tool, Checkmk has fairly low system requirements, but the combination of Windows as host system and container virtualization does add quite a bit of overhead. Besides that, the host needs to be connected to the internet. This tutorial is based on the Checkmk Raw Edition version 2.0.0p17.
Getting started
As a first step, you need to download and install Docker Desktop for Windows or another Docker Engine of your choice. I used Docker Desktop, because it is free for private users and easy to use.
- Download and install Docker Desktop for Windows.
- Depending on your Windows version you also have to download and install the WSL2 Linux kernel update for Windows after installing Docker Desktop.
- After you have downloaded and installed the WSL2 Linux kernel update package, open the command prompt. You find that under the Start menu and search for “cmd”.
- You have to set WSL 2 as the default version when installing Linux-based systems such as Docker Desktop. Use the command:
wsl --set-default-version 2
Installing Checkmk Raw Edition on Windows
I am going to use the Checkmk Raw Edition for this tutorial, the community GPLv2 edition that is also available on Docker Hub. As an alternative, there is a trial version of the Checkmk Enterprise Edition. The Enterprise Edition comes with several extra features and the trial version allows you to use them all for 30 days free of charge. The tutorial will be fairly similar for the Enterprise Edition, the main difference is the fact that you cannot pull the Enterprise Edition from Docker hub, but have to download it from the Checkmk website before taking the next step. If you use the Checkmk Raw Edition, you can stay on stay in the Windows terminal and use the following command to pull the Raw Edition:
docker container run -dit -p 8080:5000 --tmpfs /opt/omd/sites/cmk/tmp:uid=1000,gid=1000 -v monitoring:/omd/sites --name cmk_demo -v /etc/localtime:/etc/localtime:ro --restart always checkmk/check-mk-raw:2.0.0-latest
In the command, I added the parameters recommended by the Checkmk guide for Docker. You are free to adjust them, of course, but before you do so, you should read the guides page. Wait for Docker to pull the Checkmk images. You have now created a container (named “cmk_demo” in my case) running Checkmk. You also have bound the data from the site in this container to a persistent location in the Docker node file system. I named the volume “monitoring”, you can choose different names, if you like.
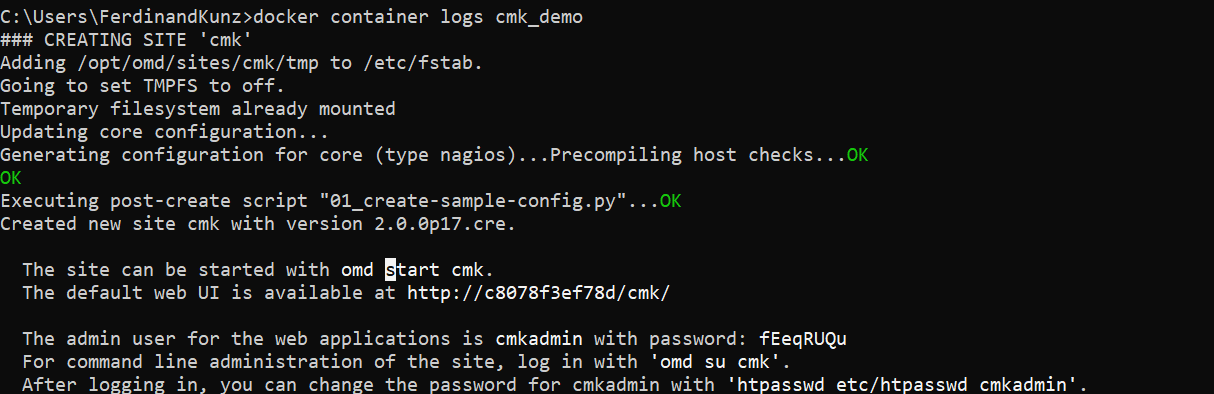
Your monitoring is now already running, but you need to know the randomly-generated password for the cmkadmin user. By default, Checkmk generates a first user “cmkadmin” with a random password for your Checkmk site. You find that password in the container logs. Use the command docker container logs and add the name of your Checkmk site in your Windows command prompt:
docker container logs cmk_demo
Don’t worry about the terminal command to change your password. You could open the CLI of this container in Docker Desktop (not the Windows command prompt), and use the commands “omd su cmk” and “htpasswd etc/htpasswd cmkadmin”. But it is easier to do that in the user interface of Checkmk.
Copy the password, you will need it in the next step. If the installation worked out correctly, Checkmk will be able to access your Checkmk site by using the link http://localhost:8080/cmk/check_mk/ in your browser.
Change you password in Checkmk
- Log-in to Checkmk with the user “cmkadmin” and your password that you copied from the command prompt before.
- You will see an empty dashboard, because your monitoring does not contain any hosts yet. Before you add them, first go to “User” on the menu on the left and click on Change password.
- Enter your old password and confirm the new one.
Add the localhost as first host to Checkmk
As a first host, you should add your monitoring host, which in this case is a docker container. Checkmk as a sophisticated Docker and Kubernetes monitoring, but to get started the easiest version in this case is to use the Checkmk Linux agent that is already running in your Checkmk container.
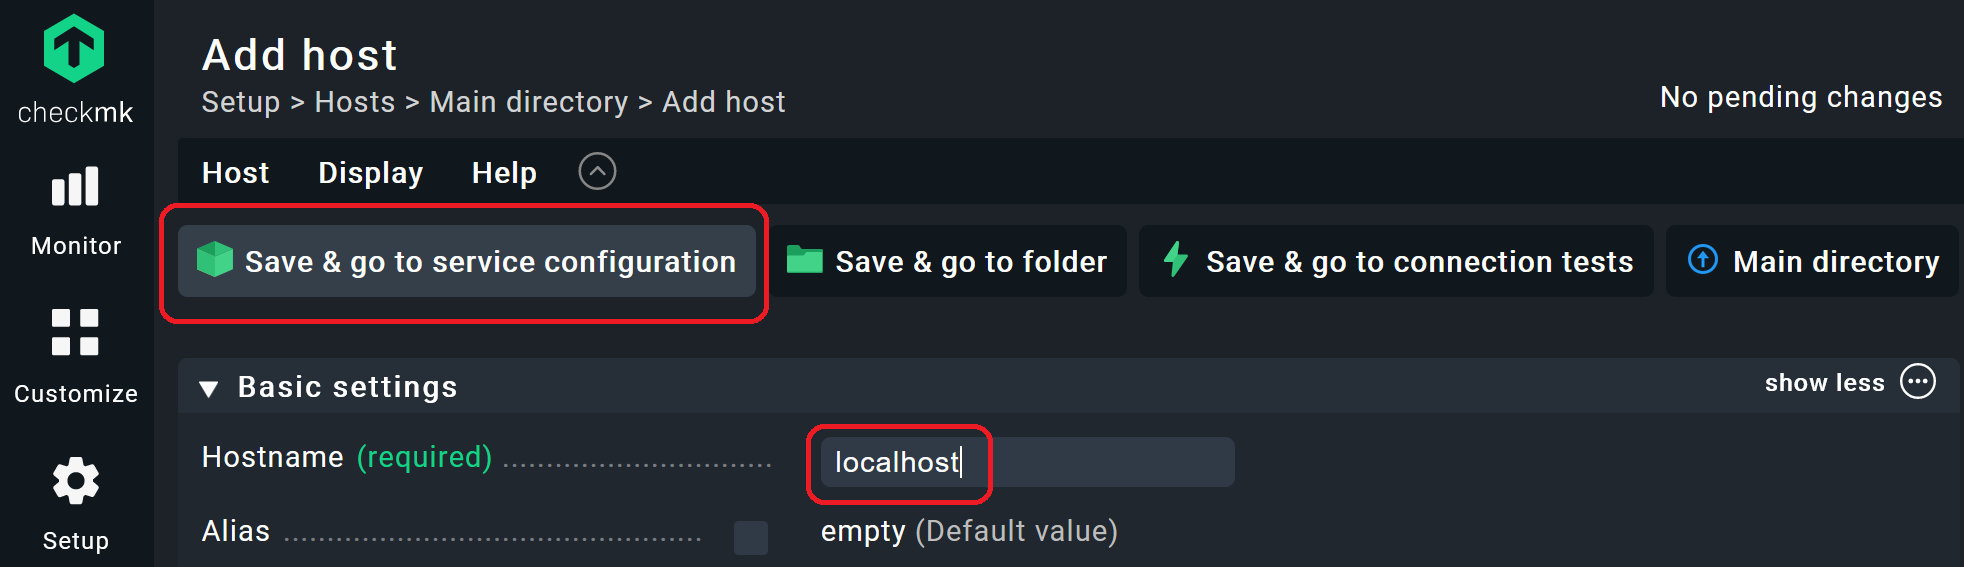
- In the sidebar on the left, go to Setup -> Hosts and click on “Add host”.
- Enter “localhost” under “Hostname” and click on “Save& go to service configuration”
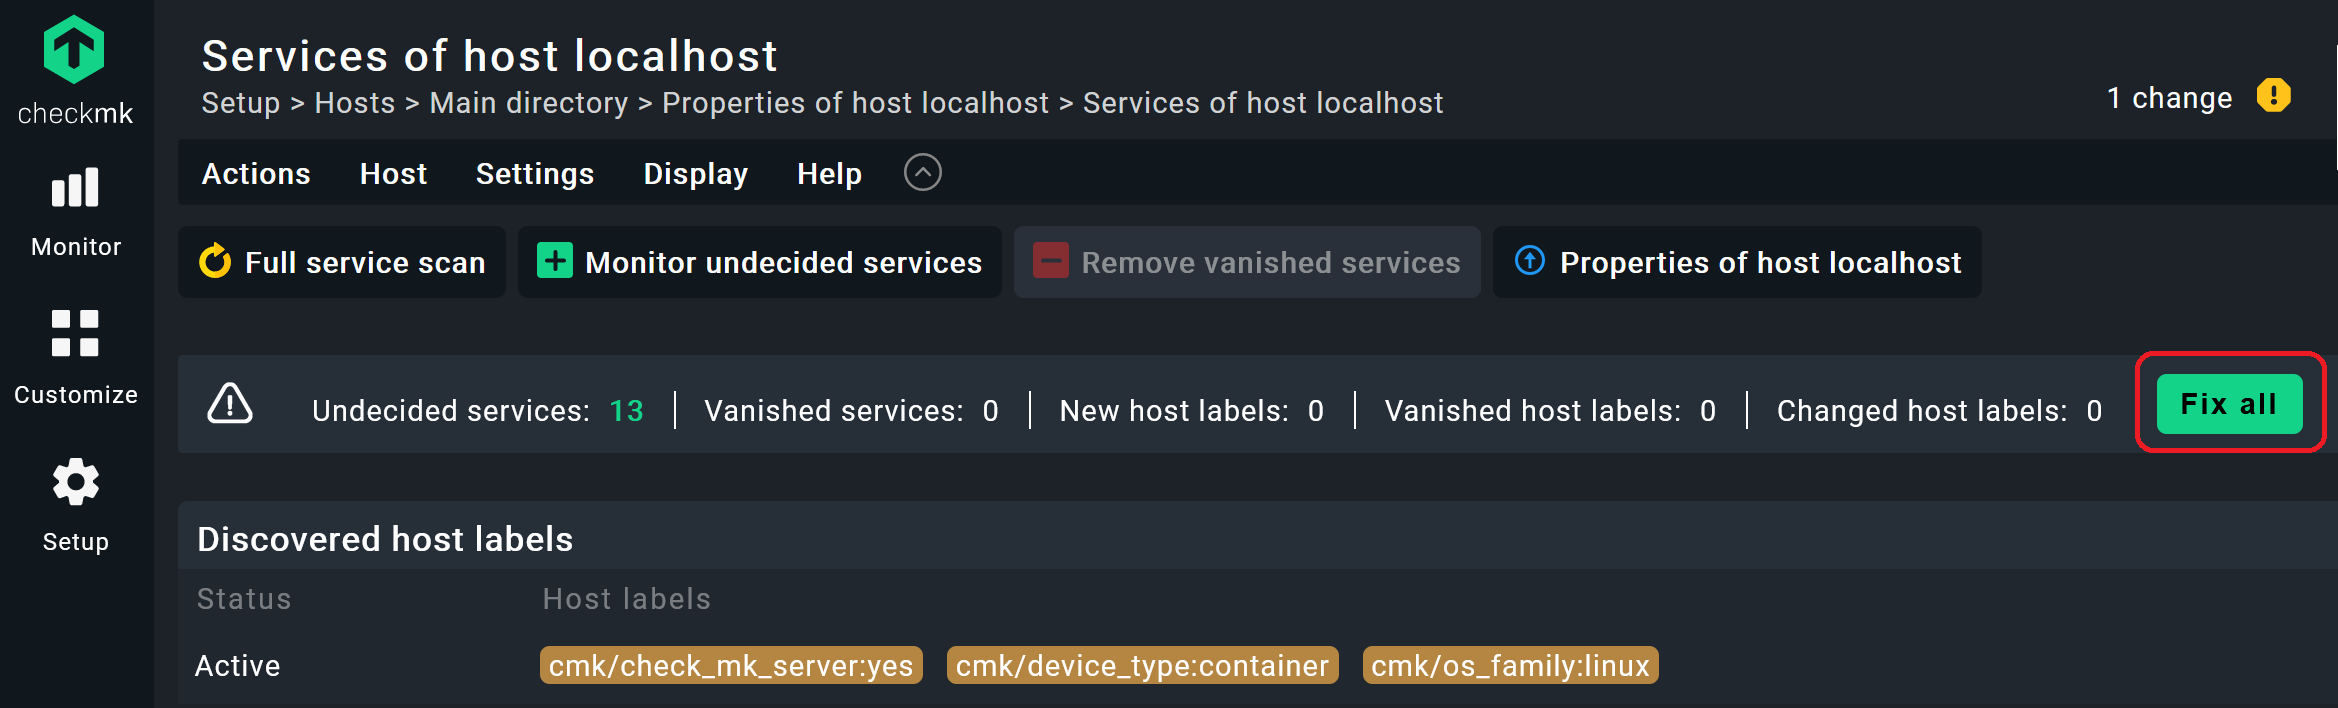
- Wait for the automated service discovery. Checkmk is now checking, if it can pull data from the agent and if there are new monitoring services.
- In my case, Checkmk detected 13 services and also a couple of labels. Click on the “Fix all” button to add all of these services into your monitoring.
In this case, Checkmk discovered the services on the container provided by the Checkmk agent, but the automated service discovery also work with SNMP or other protocols, which makes Checkmk good tool for network monitoring. The auto-detection of labels is a good way to manage different kinds of devices and you can add your own labels, as well, of course. The “Fix all button” adds all detected services and host labels to your monitoring dashboard and removes services that have vanished. Of course, you can manage the services manually, but the fix all function makes it a lot easier.
Monitoring Windows systems with Checkmk
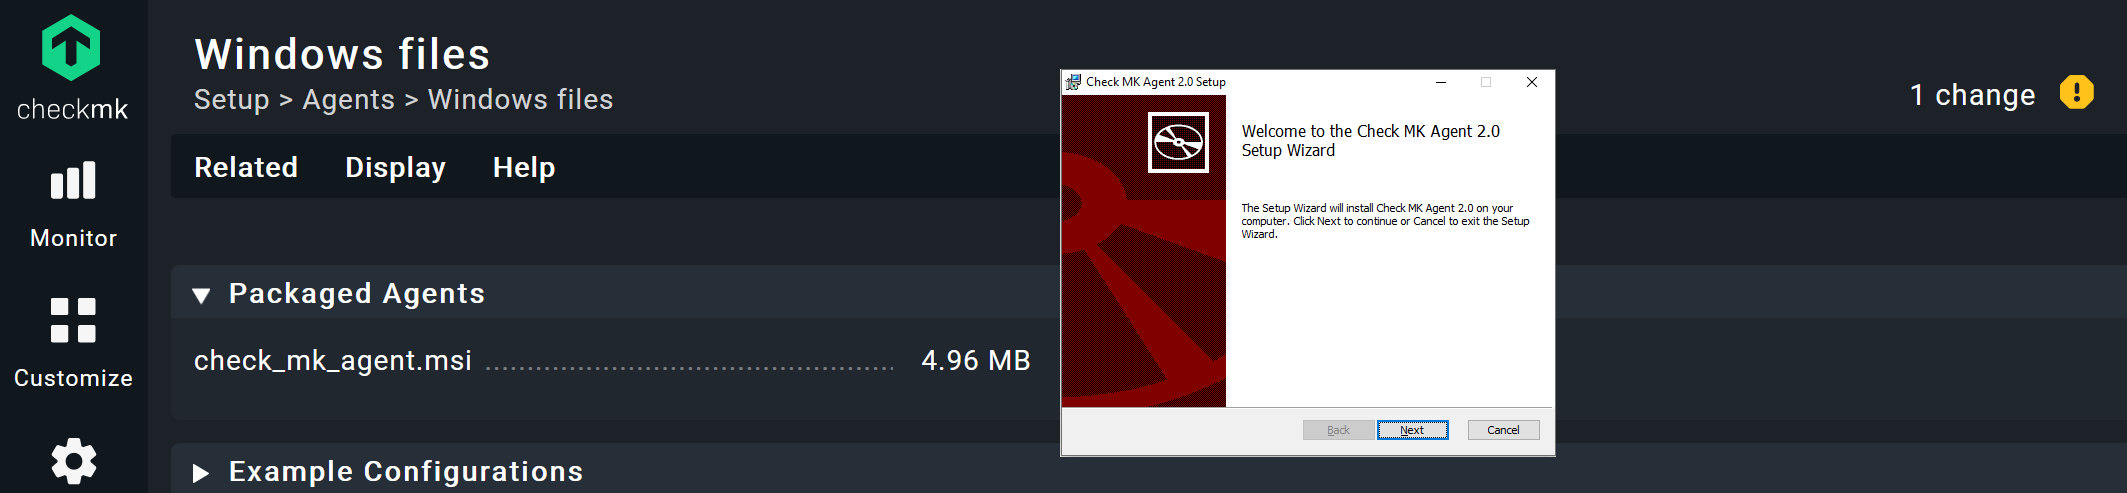
Because the container runs on my Windows laptop, I want to show you how to monitor Windows systems with Checkmk. The best way to monitor Windows devices is the Checkmk agent for Windows. While the Linux agent was already running in the Checkmk container, you have to install it on your Windows machine first, before adding the host into your monitoring.
- Go to Setup -> Agents and select the appropriate package for your operating system. In my case Setup -> Agents -> Windows -> check_mk_agent.msi
- Download and install the agent by clicking on it. Run the .msi file.
- Click on Setup -> Hosts and “Add host” like before
- Add the name of your Windows host under “Hostname” in the “Basic settings” and the IP address of the host under “Network address” in the field next to “IPv4 address”. If you are not sure about the IP address of your Windows host, you can use the command ipconfig in the Windows command prompt.
- Leave the other areas unchanged and click on “Save & go to service configuration”. Wait for the automated service discovery and click “Fix all”.
Last step: Activate changes in Checkmk
Now, there are two hosts in your monitoring, but Checkmk has a safety mechanism. All changes made are listed first under “Pending changes”, so you can review any changes before they affect your monitoring
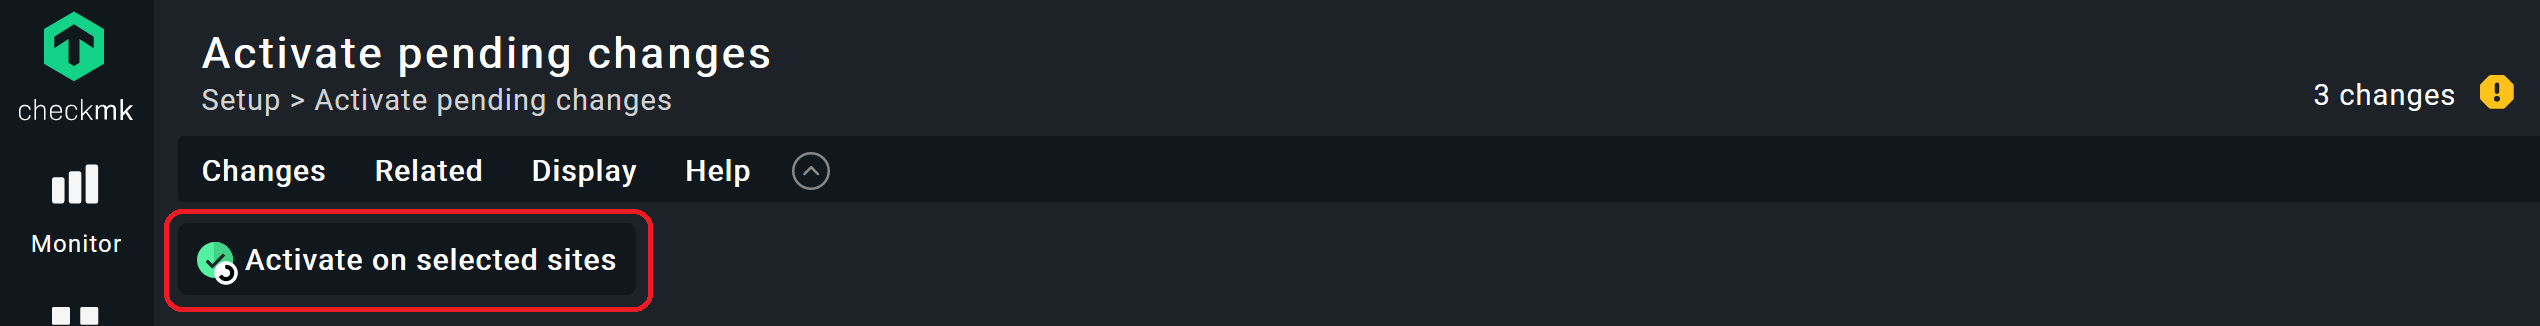
- Activate your changes by clicking on the highlighted field with the yellow exclamation point (!) at the top right corner.
- Click on “Activate on selected sites”, and you’ve successfully added your hosts to your monitoring.
Checkmk differentiates between Setup as a configuration environment, in which you manage the hosts, services, and settings, and the area called Monitor, in which the actual operational monitoring takes place. New hosts and other changes in the configuration initially do not affect the monitoring. You must activate these before they go into production.
And that was it. In the menu on the left click on Monitor -> All hosts to find your hosts. The combination of Docker under Windows is fairly unconventional, but is great for testing Checkmk or for monitoring servers in Windows environments. If you want to monitor larger environments and only have Windows servers, you should think about using the virtual or physical Checkmk appliance for monitoring.


