ngxtop is a free, open-source, flexible and real-time monitoring tool for Nginx web servers. It can parse the Nginx access log and print the information about request count, requested URI, the number of requests by status code, and much more. It is a simple and easy-to-use tool to monitor the requests coming to an Nginx web server.
In this article, I will show you how to install and use ngxtop monitoring tool on Ubuntu 20.04.
Prerequisites
- A server running Ubuntu 20.04.
- A root password is configured on your server.
Install ngxtop
ngxtop is a python-based tool so you will need to install Python and PIP packages to your system. You can install them with the Nginx using the following command:
apt-get install nginx python3 python3-pip -yOnce installed, you can install the ngxtop package using the PIP as shown below:
pip3 install ngxtopOnce ngxtop is installed, you can verify the version of ngxtop using the following command:
ngxtop --versionYou should get the following output:
xstat 0.1
How to Use ngxtop
In this section, we will show you how to use ngxtop to monitor the Nginx web server.
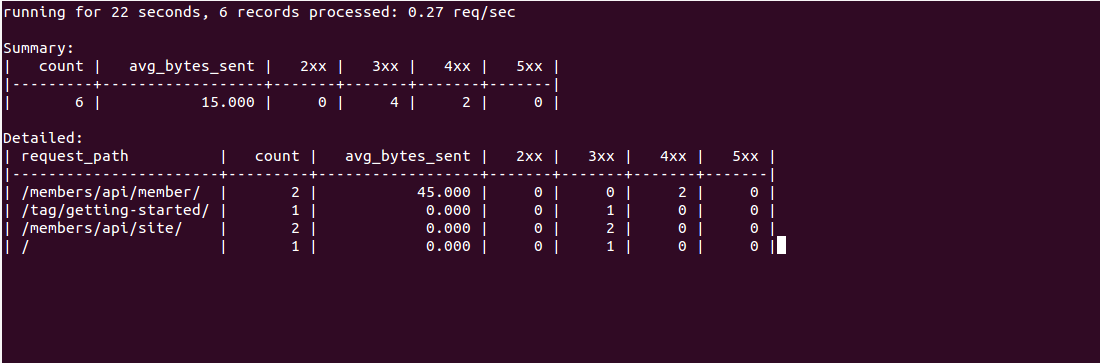
Run the ngxtop command without any argument will display the summary of request count, requested URI, the number of requests by status code.
ngxtopYou should see the following screen:
You can use the -l option to specify the access log you want to analyze.
ngxtop -l /var/log/nginx/access.logYou should see the following screen:
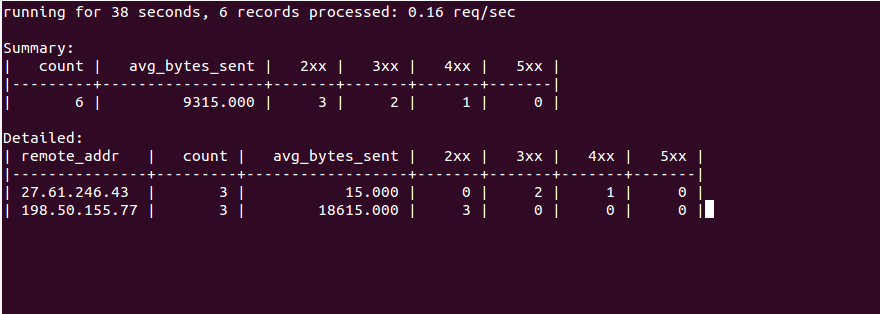
To list the top IP’s that are accessing your Nginx server, run the following command:
ngxtop --group-by remote_addr -l /var/log/nginx/access.logYou should see the following screen:
You can print 10 requests with the highest total bytes sent using the following command:
ngxtop --order-by 'avg(bytes_sent) * count' -l /var/log/nginx/access.logYou should see the following screen:
ngxtop also allows you to parse the Apache log file from a remote server. You can do it with the following command:
ssh [email protected] tail -f /var/log/apache2/access.log | ngxtop -f commonTo get a list of all option available with ngxtop, run the following command:
ngxtop --helpYou should see the following output:
ngxtop - ad-hoc query for nginx access log.

Usage:
    ngxtop [options]
    ngxtop [options] (print|top|avg|sum)  ...
    ngxtop info
    ngxtop [options] query  ...

Options:
    -l , --access-log   access log file to parse.
    -f , --log-format   log format as specify in log_format directive. [default: combined]
    --no-follow  ngxtop default behavior is to ignore current lines in log
                     and only watch for new lines as they are written to the access log.
                     Use this flag to tell ngxtop to process the current content of the access log instead.
    -t , --interval   report interval when running in follow mode [default: 2.0]

    -g , --group-by   group by variable [default: request_path]
    -w , --having   having clause [default: 1]
    -o , --order-by   order of output for default query [default: count]
    -n , --limit   limit the number of records included in report for top command [default: 10]
    -a  ..., --a  ...  add exp (must be aggregation exp: sum, avg, min, max, etc.) into output

    -v, --verbose  more verbose output
    -d, --debug  print every line and parsed record
    -h, --help  print this help message.
    --version  print version information.

    Advanced / experimental options:
    -c , --config   allow ngxtop to parse nginx config file for log format and location.
    -i , --filter   filter in, records satisfied given expression are processed.
    -p , --pre-filter  in-filter expression to check in pre-parsing phase.

Examples:
    All examples read nginx config file for access log location and format.
    If you want to specify the access log file and / or log format, use the -f and -a options.

    "top" like view of nginx requests
    $ ngxtop

    Top 10 requested path with status 404:
    $ ngxtop top request_path --filter 'status == 404'

    Top 10 requests with highest total bytes sent
    $ ngxtop --order-by 'avg(bytes_sent) * count'

    Top 10 remote address, e.g., who's hitting you the most
    $ ngxtop --group-by remote_addr

    Print requests with 4xx or 5xx status, together with status and http referer
    $ ngxtop -i 'status >= 400' print request status http_referer

    Average body bytes sent of 200 responses of requested path begin with 'foo':
    $ ngxtop avg bytes_sent --filter 'status == 200 and request_path.startswith("foo")'

    Analyze apache access log from remote machine using 'common' log format
    $ ssh remote tail -f /var/log/apache2/access.log | ngxtop -f common
Conclusion
In the above guide, you learned how to install and use ngxtop on Ubuntu 20.04. I hope you can now monitor your Nginx log easily from the command-line interface.
About Hitesh Jethva
Over 8 years of experience as a Linux system administrator. My skills include a depth knowledge of Redhat/Centos, Ubuntu Nginx and Apache, Mysql, Subversion, Linux, Ubuntu, web hosting, web server, Squid proxy, NFS, FTP, DNS, Samba, LDAP, OpenVPN, Haproxy, Amazon web services, WHMCS, OpenStack Cloud, Postfix Mail Server, Security etc.


