
Netdata is a free, open-source, and real-time server monitoring tool that visualize and monitor real-time data like CPU usage, RAM usage, Load, SWAP usage, Bandwidth usage, Disk usage, etc. It helps the system administrator to get an overview of what is happening and what has just happened in your system or application. It can be installed on any physical servers, Virtual Machines, containers, and IoT devices. It provides an interactive web interface to see your server metrics with support for various data stores for persistent storage.
In this tutorial, we will show you how to install the Netdata monitoring tool on Alma Linux 8.
Prerequisites
- A server running Alma Linux 8.
- A valid domain name pointed with your server IP.
- A root password is configured on the server.
Install Required Dependency
First, you will need to install the EPEL repo and other dependencies required for installing Netdata. You can install all of them by running the following command:
dnf install epel-release -y
dnf install git libuuid-devel autoconf automake pkgconfig zlib-devel curl findutils libmnl gcc make -y
Once all the packages are installed, you can proceed to the next step.
Install Netdata
By default, Netdata is not included in the Alma Linux default repo. So you will need to install it from the source.
First, download the latest version of Netdata from the Git repository using the following command:
git clone --recurse-submodules https://github.com/netdata/netdata.git --depth=100
Once the download is completed, change the directory to netdata and install all required dependencies using the following command:
cd netdata
./packaging/installer/install-required-packages.sh --non-interactive --dont-wait netdata
Next, install other packages with the following command:
dnf --enablerepo=powertools install libuv-devel
Next, run the Netdata installation script to start the installation.
./netdata-installer.sh
You will get the following output:
 --- real-time performance monitoring, done right! ---

  You are about to build and install netdata to your system.

  The build process will use /tmp for
  any temporary files. You can override this by setting $TMPDIR to a
  writable directory where you can execute files.

  It will be installed at these locations:

   - the daemon     at /usr/sbin/netdata
   - config files   in /etc/netdata
   - web files      in /usr/share/netdata
   - plugins        in /usr/libexec/netdata
   - cache files    in /var/cache/netdata
   - db files       in /var/lib/netdata
   - log files      in /var/log/netdata
   - pid file       at /var/run/netdata.pid
   - logrotate file at /etc/logrotate.d/netdata

  This installer allows you to change the installation path.
  Press Control-C and run the same command with --help for help.


  NOTE:
  Anonymous usage stats will be collected and sent to Netdata.
  To opt-out, pass --disable-telemetry option to the installer or export
  the environment variable DISABLE_TELEMETRY to a non-zero or non-empty value
  (e.g: export DISABLE_TELEMETRY=1).

Press ENTER to build and install netdata to your system >
Press the Enter key to install Netdata to your system. Once the Netdata is installed, you will get the following output:
Setting netdata.tarball.checksum to 'new_installation'

 --- We are done! ---

  ^
  |.-.   .-.   .-.   .-.   .-.   .  netdata  .-.   .-.   .-.   .-.   .-.   .-
  |   '-'   '-'   '-'   '-'   '-'               '-'   '-'   '-'   '-'   '-'
   ---- ----- ----- ----- ----- ----- ----- ----- ----- ----- ----- ----- --->

 --- is installed and running now! ---
  enjoy real-time performance and health monitoring...
systemctl start netdata
systemctl enable netdata
You can now check the status of the Netdata using the following command.
systemctl status netdata
You will get the following output:
? netdata.service - Real time performance monitoring
   Loaded: loaded (/usr/lib/systemd/system/netdata.service; enabled; vendor preset: disabled)
   Active: active (running) since Sat 2022-03-19 04:22:22 UTC; 4min 16s ago
 Main PID: 58935 (netdata)
    Tasks: 50 (limit: 11412)
   Memory: 103.1M
   CGroup: /system.slice/netdata.service
           ??58935 /usr/sbin/netdata -P /var/run/netdata/netdata.pid -D
           ??58938 /usr/sbin/netdata --special-spawn-server
           ??59063 /usr/libexec/netdata/plugins.d/apps.plugin 1
           ??59064 /usr/libexec/netdata/plugins.d/ebpf.plugin 1
           ??59065 /usr/libexec/netdata/plugins.d/go.d.plugin 1

Mar 19 04:22:22 linux systemd[1]: Starting Real time performance monitoring...
Mar 19 04:22:22 linux systemd[1]: Started Real time performance monitoring.
Mar 19 04:22:22 linux netdata[58935]: CONFIG: cannot load cloud config '/var/lib/netdata/cloud.d/cloud.conf'. Running with internal defaults.
Mar 19 04:22:22 linux netdata[58935]: 2022-03-19 04:22:22: netdata INFO  : MAIN : CONFIG: cannot load cloud config '/var/lib/netdata/cloud.d/>
Mar 19 04:22:22 linux netdata[58935]: 2022-03-19 04:22:22: netdata INFO  : MAIN : Found 0 legacy dbengines, setting multidb diskspace to 256MB
Mar 19 04:22:22 linux netdata[58935]: 2022-03-19 04:22:22: netdata INFO  : MAIN : Created file '/var/lib/netdata/dbengine_multihost_size' to >
Mar 19 04:22:22 linux netdata[58935]: Found 0 legacy dbengines, setting multidb diskspace to 256MB
Mar 19 04:22:22 linux netdata[58935]: Created file '/var/lib/netdata/dbengine_multihost_size' to store the computed value
Mar 19 04:22:23 linux ebpf.plugin[59064]: Does not have a configuration file inside `/etc/netdata/ebpf.d.conf. It will try to load stock file.
Mar 19 04:22:23 linux ebpf.plugin[59064]: Cannot read process groups configuration file '/etc/netdata/apps_groups.conf'. Will try '/usr/lib/n>
At this point, Netdata is running and listens on port 19999. You can check it with the following command:
ss -antpl | grep netdata
You will get the following output:
LISTEN 0      128        127.0.0.1:8125       0.0.0.0:*    users:(("netdata",pid=58935,fd=29))
LISTEN 0      128          0.0.0.0:19999      0.0.0.0:*    users:(("netdata",pid=58935,fd=6))
LISTEN 0      128            [::1]:8125          [::]:*    users:(("netdata",pid=58935,fd=28))
LISTEN 0      128             [::]:19999         [::]:*    users:(("netdata",pid=58935,fd=7))
Once you are finished, you can proceed to the next step.
Configure Firewall
If you are using firewalld firewall on your system then you will need to allow ports 19999 and 80 through the firewalld. You can allow them with the following command:
firewall-cmd --permanent --add-port=19999/tcp
firewall-cmd --permanent --add-port=80/tcp
Next, reload the firewalld daemon to apply the changes:
firewall-cmd --reload
Once you are finished, you can proceed to the next step.
Configure Nginx as a Reverse Proxy for Netdata
It is always a good idea to install and configure Nginx as a reverse proxy to access the Netdata. First, install the Nginx server using the following command:
dnf install nginx httpd-tools -y
Next, generate a password file with the following command:
htpasswd -c /etc/nginx/.htpasswd netadmin
Set your admin password as shown below:
New password:
Re-type new password:
Adding password for user netadmin
Next, create an Nginx virtual host configuration file with the following command:
nano /etc/nginx/conf.d/netdata.conf
Add the following lines:
upstream backend {
server 127.0.0.1:19999;
keepalive 64;
}

server {
listen 80;
server_name netdata.example.com;

    location / {

    proxy_set_header X-Forwarded-Host $host;
    proxy_set_header X-Forwarded-Server $host;
    proxy_set_header X-Forwarded-For $proxy_add_x_forwarded_for;
    proxy_pass http://backend;
    proxy_http_version 1.1;
    proxy_pass_request_headers on;
    proxy_set_header Connection "keep-alive";
    proxy_store off;
    auth_basic "Private Property";
    auth_basic_user_file /etc/nginx/.htpasswd;
}
}
Save and close the file then verify the Nginx for any syntax configuration error:Advertisement
nginx -t
If everything is fine, you will get the following output:
nginx: the configuration file /etc/nginx/nginx.conf syntax is ok
nginx: configuration file /etc/nginx/nginx.conf test is successful
Next, restart the Nginx service to apply the configuration changes:
systemctl restart nginx
You can also check the Nginx status with the following command:
systemctl status nginx
You should see the following output:
? nginx.service - The nginx HTTP and reverse proxy server
   Loaded: loaded (/usr/lib/systemd/system/nginx.service; disabled; vendor preset: disabled)
   Active: active (running) since Sat 2022-03-19 04:28:44 UTC; 4s ago
  Process: 61706 ExecStart=/usr/sbin/nginx (code=exited, status=0/SUCCESS)
  Process: 61705 ExecStartPre=/usr/sbin/nginx -t (code=exited, status=0/SUCCESS)
  Process: 61703 ExecStartPre=/usr/bin/rm -f /run/nginx.pid (code=exited, status=0/SUCCESS)
 Main PID: 61708 (nginx)
    Tasks: 2 (limit: 11412)
   Memory: 3.7M
   CGroup: /system.slice/nginx.service
           ??61708 nginx: master process /usr/sbin/nginx
           ??61709 nginx: worker process

Mar 19 04:28:44 linux systemd[1]: Starting The nginx HTTP and reverse proxy server...
Mar 19 04:28:44 linux nginx[61705]: nginx: the configuration file /etc/nginx/nginx.conf syntax is ok
Mar 19 04:28:44 linux nginx[61705]: nginx: configuration file /etc/nginx/nginx.conf test is successful
Mar 19 04:28:44 linux systemd[1]: nginx.service: Failed to parse PID from file /run/nginx.pid: Invalid argument
Mar 19 04:28:44 linux systemd[1]: Started The nginx HTTP and reverse proxy server.
Once you are finished, you can proceed to the next step.
Access Netdata Dashboard
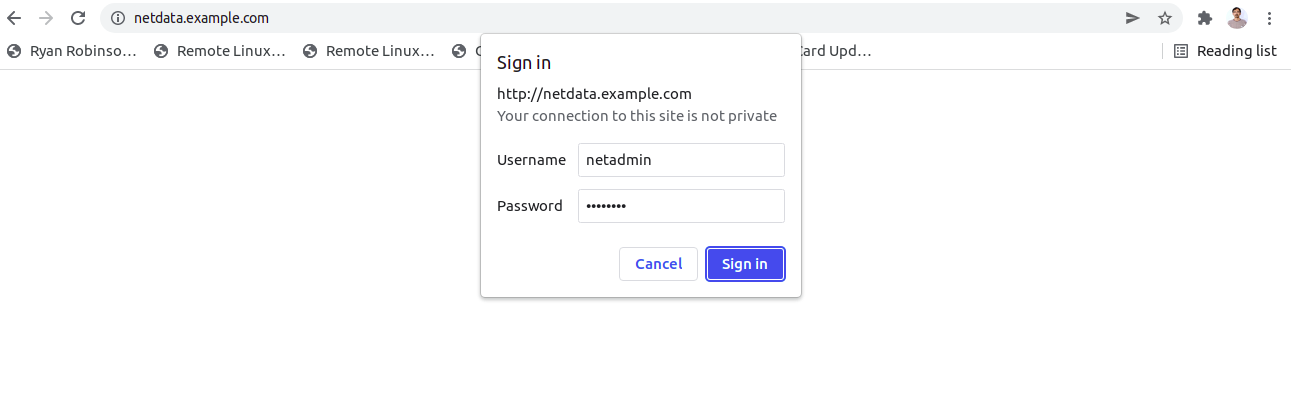
Now, open your web browser and access the Netdata dashboard using the URL http://your-server-ip. You should see the Netdata login page:
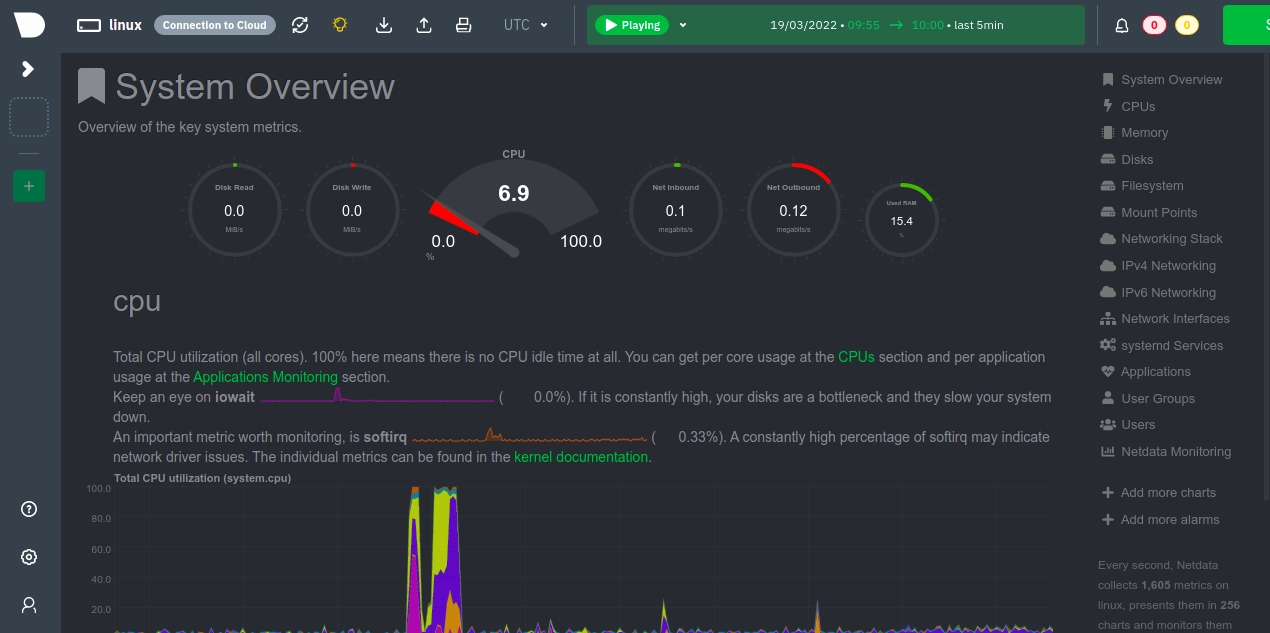
Provide your admin username, password and click on the Sign in button. You should see the Netdata dashboard on the following page:
Conclusion
Congratulations! you have successfully installed Netdata monitoring tool on Alma Linux 8. You can now start monitoring your server matrics in real-time from the Netdata dashboard. Feel free to ask me if you have any questions.Advertisement


