
Zeek (formerly Bro) is a free and open-source platform for network security monitoring. It is a powerful passive network traffic analyzer to investigate suspicious or malicious activity. Zeek can be used as a network security monitor (NSM) and supports a wide range of traffic analysis, from the security domain to performance measurement and troubleshooting.
In this guide, I will show you how to install Zeek network Security Monitoring on the Debian 12 server step-by-step. You will install Zeek, and configure Zeek in cluster mode, then you will learn how to parse Zeek TSV log format via the zeek-cut command line. Furthermore, you will learn how to set up Zeek log output as JSON and parser Zeek JSON log via the jq command line.
Prerequisites
Before commencing, confirm that you have the following:
- A Debian 12 server.
- A non-root user with administrator privileges.
Adding Repository
Zeek can be installed on the Linux system by compiling it manually or by using a third-party repository. In this guide, you will install Zeek using a third-party repository via APT.
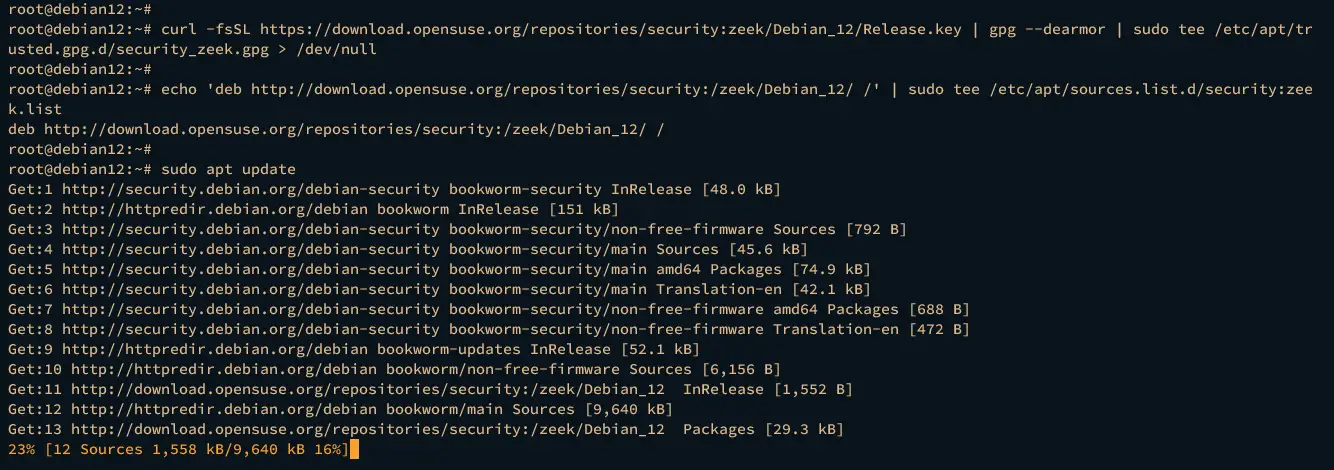
First, run the following command to add the GPG key and repository for the Zeek package.
curl -fsSL https://download.opensuse.org/repositories/security:zeek/Debian_12/Release.key | gpg --dearmor | sudo tee /etc/apt/trusted.gpg.d/security_zeek.gpg > /dev/null
echo 'deb http://download.opensuse.org/repositories/security:/zeek/Debian_12/ /' | sudo tee /etc/apt/sources.list.d/security:zeek.list
Now update and refresh your Debian repository by executing the following apt update command.
sudo apt update
Installing Zeek
After adding the Zeek repository, you can now start Zeek installation on your Debian machine. In the following step, you will install Zeek and add the Zeek installation directory to the system PATH.
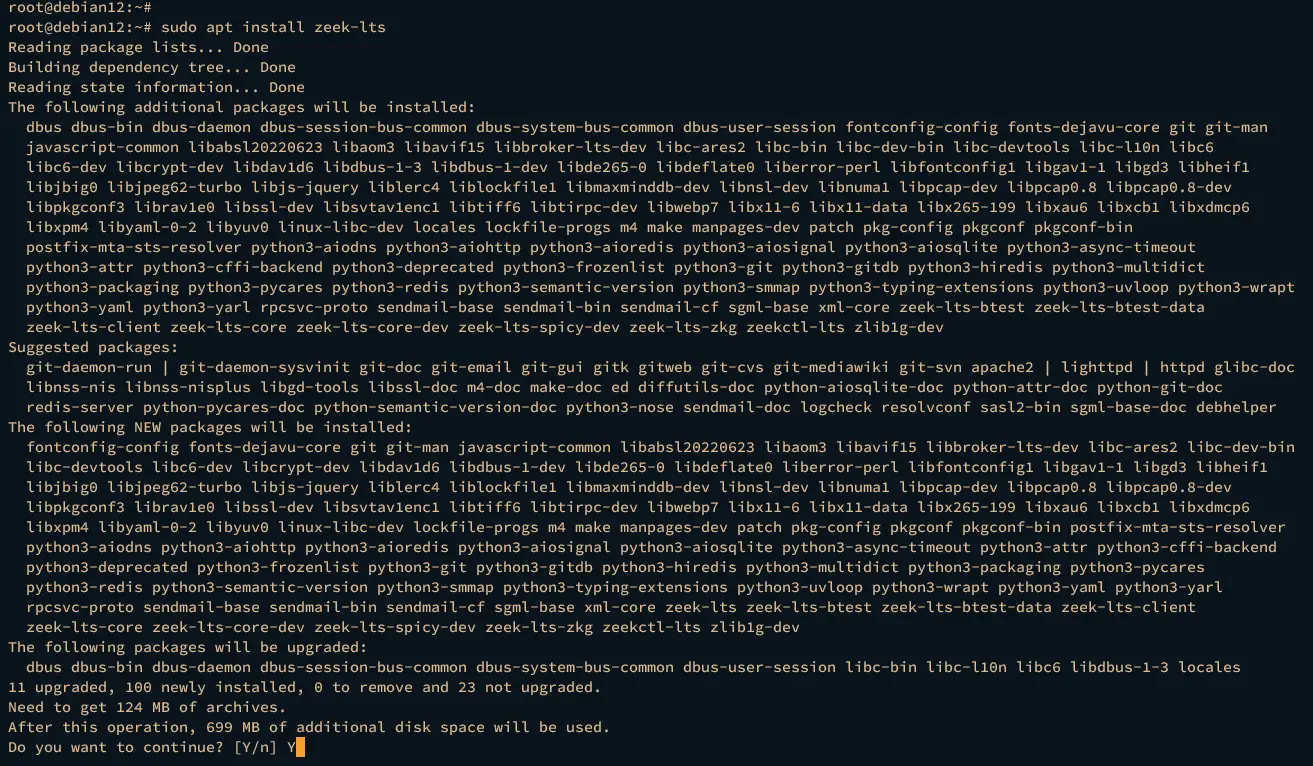
Execute the apt install command below to install Zeek to your Debian machine. There are multiple versions of Zeek available, such as the latest release, LTS, and nightly. In this example, you will install zeek-lts.
sudo apt install zeek-lts
Type y to proceed with the installation.
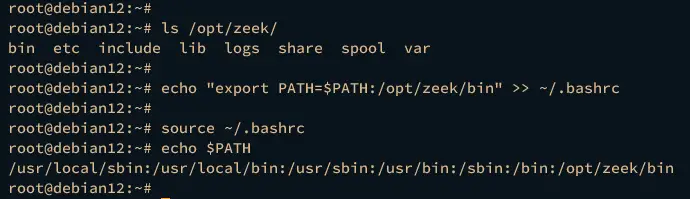
After zeek is installed, which is by default to the target directory /opt/zeek. Execute the following command to add the /opt/zeek/bin directory to the system PATH via ~/.bashrc file.
echo "export PATH=$PATH:/opt/zeek/bin" >> ~/.bashrc
Next, reload the ~/.bashrc file and check the system PATH variable using the following command. You should see the /opt/zeek/bin directory within the system PATH.
source ~/.bashrc
echo $PATH
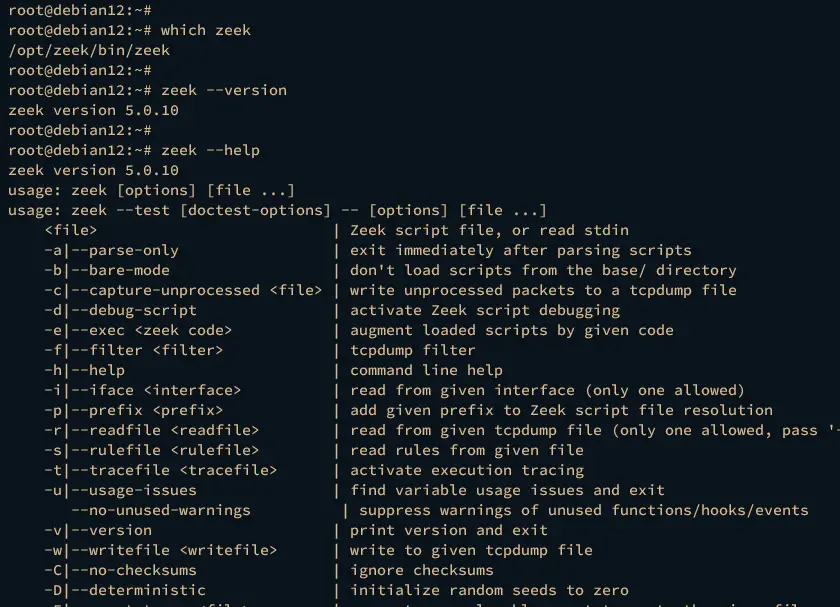
Lastly, verify Zeek by executing the following command. With this, you will check the location of the Zeek binary file, check the Zeek version, and print the Zeek help message.
which zeek
zeek --version
zeek --help
In the following output, you should see that zeek 5.0 is installed at /usr/zeek/bin/zeek. Also, you should options for the Zeek command.
Configuring Zeek
Now that Zeek is installed, the next step is to configure Zeek installation. You can run Zeek in multiple modes, such as command-line mode, standalone mode, and cluster mode.
In the following example, you will learn how to run Zeek in cluster mode using a single server.
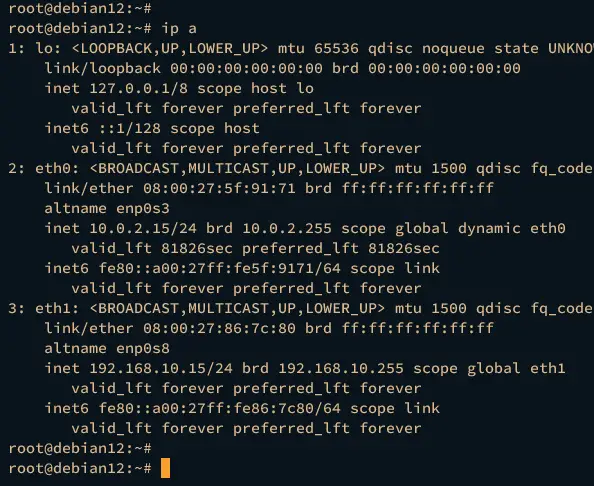
Before configuring Zeek, execute the following command to check your network interfaces and IP address.
ip a
You should the list available interfaces on your system with detailed information on a server IP address like the following:
Open the network configuration for Zeek /opt/zeek/etc/networks.cfg using the following nano editor command.
sudo nano /opt/zeek/etc/networks.cfg
Insert your internal network subnet like the following. You can also add multiple subnets to it.
10.0.0.0/8          Private IP space
172.16.0.0/12       Private IP space
192.168.0.0/16      Private IP space
Save the file and exit the editor when you’re done.
Now open zeek configuration /opt/zeek/etc/node.cfg using the nano editor command below.
sudo nano /opt/zeek/etc/node.cfg
By default, Zeek is running in a standalone mode. Add the # to disable Zeek standalone mode.
#[zeek]
#type=standalone
#host=localhost
#interface=eth0
Insert the following configuration to run Zeek in the cluster mode with a single server. Be sure to change the server IP address with your information.
With the following configuration, you will be running Zeek in cluster mode, which has multiple components, such as zeek-logger, zeek-manager, zeek-proxy, and zeek-worker.
# logger
[zeek-logger]
type=logger
host=192.168.10.15# manager
[zeek-manager]
type=manager
host=192.168.10.15# proxy
[zeek-proxy]
type=proxy
host=192.168.10.15# worker
[zeek-worker]
type=worker
host=192.168.10.15
interface=eth0# worker localhost
[zeek-worker-lo]
type=worker
host=localhost
interface=lo
Save and close the fine when finished.
Next, run the following command to access the Zeek control shell.
zeekctl
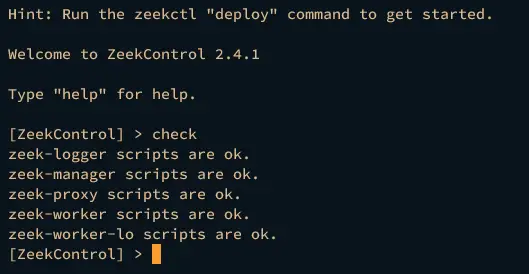
Run the check command to validate your Zeek configuration.
check
If everything goes well, you should see each component of the Zeek script is ok:
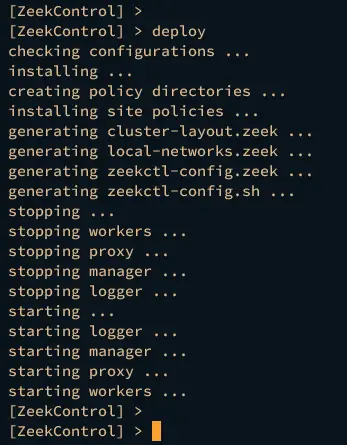
Next, run the deploy command to start and run Zeek on your machine. The deploy command is equivalent to the install and start command on Zeek.
deploy
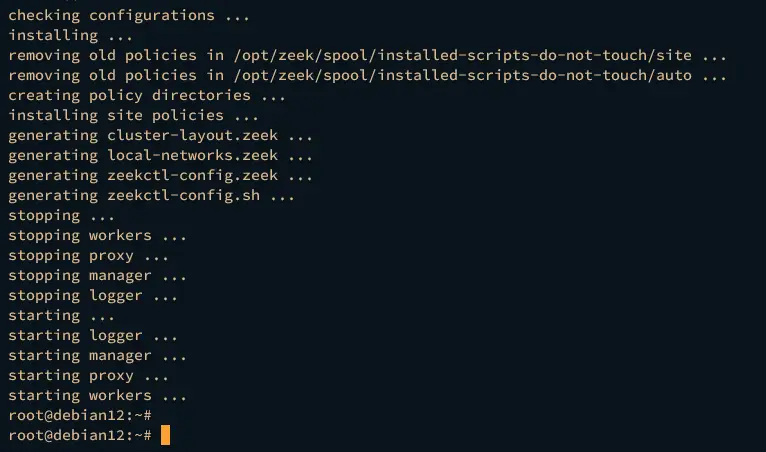
You should see each component of the Zeek cluster is starting:
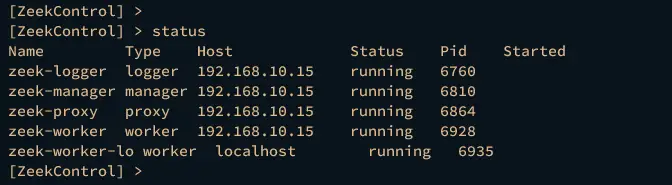
Lastly, verify each component of your Zeek cluster by executing the status command below.
status
If your installation is successful, you should see each of the Zeek cluster components is running.
Type exit to log out from the Zeek control shell.
At this point, the Zeek cluster is running. It also monitors the target network interface and subnet and generates log files to the /opt/zeek/logs directory.
Guide to Zeek Logs
After configuring Zeek, the next step is to explore log files that are generated by Zeek, which is located at /opt/zeek/logs/current directory. By default, zeek generates log files with the TSV (Tab-separated values) format.
When Zeek is running, it will monitor the target network interface on your system and generate log files to /opt/zeek/logs/current/ directory.
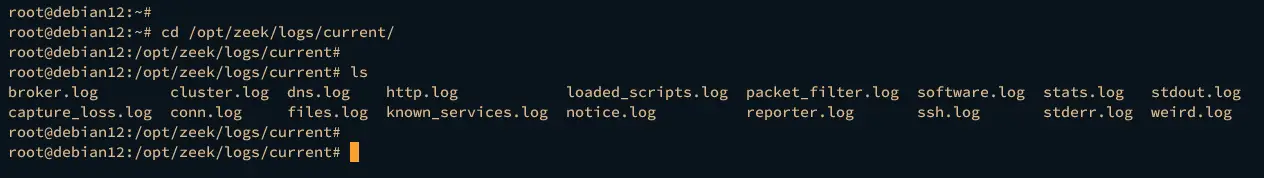
Move your working directory to /opt/zeek/logs/current/ directory and run the ls command below.
cd /opt/zeek/logs/current/
ls -ah
You should see multiple log files generated by Zeek. You may see some log files are missing on your system because the target service is not available.
Below are some of the important log files that you must know:
- conn.log: The connection log for both TCP and UDP. This log file provides the most useful information such as timestamp, connection duration, service, and many more.
- dns.log: The DNS (Domain Name System) log.
- http.log: The HyperText Transfer Protocol (HTTP) log.
- ssh.log: The Secure Shell (SSH) log for tracking SSH connections.
- ssl.log: The Secure Socket Layer (SSL) log that also contains the HTTPS log.
Analyzing Zeek Logs TSV (Tab-separated values) via Zeek-cut
By default, zeek generates log files with TSV (Tab-separated values) format. In the following step, you will analyze Zeek log files with TSV format via the zeek-cut command line.
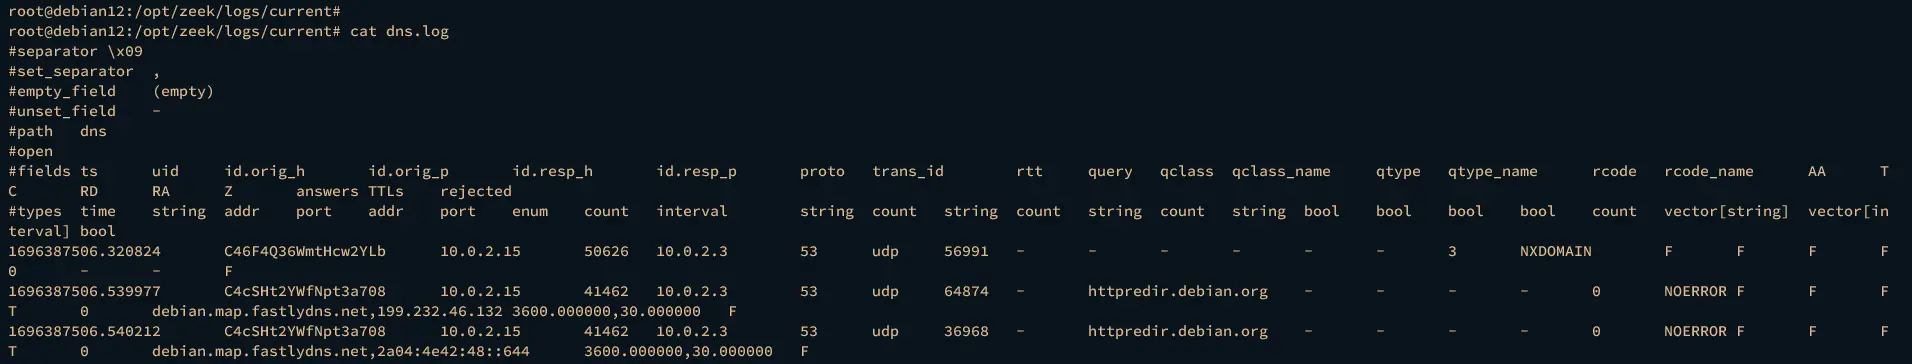
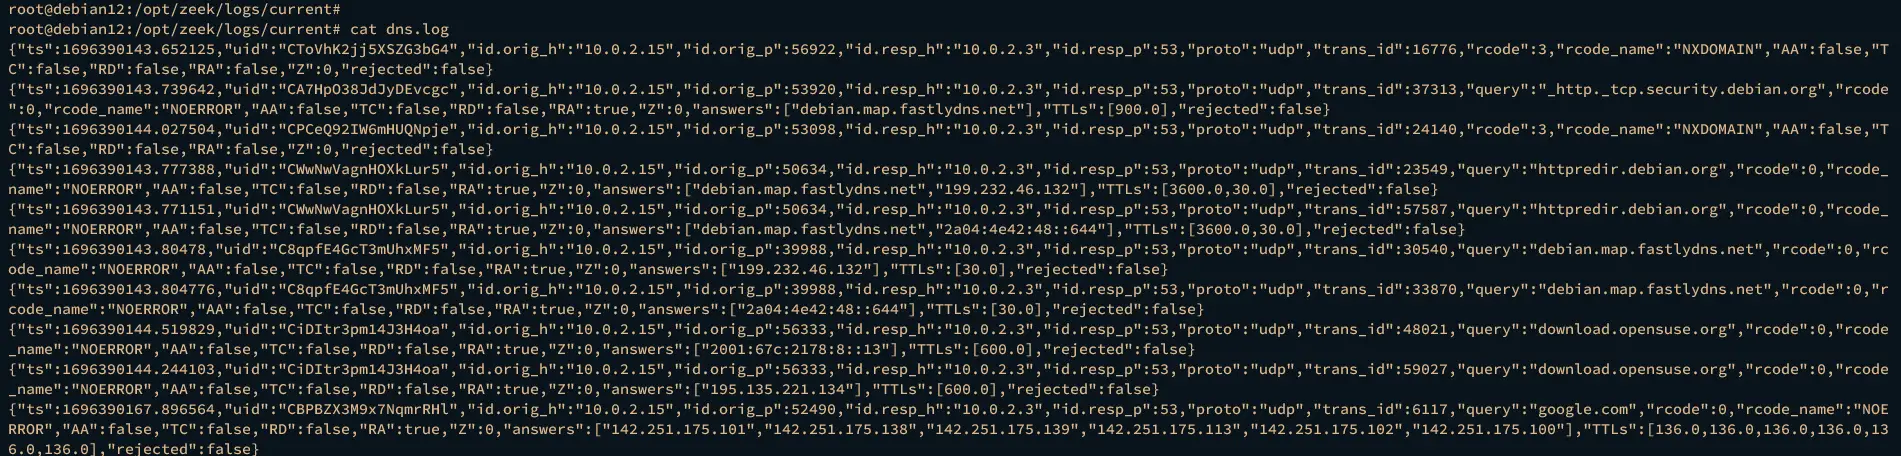
Execute the cat command below to view the log file dns.log.
cat dns.log
In the following output, you should see multiple fields such as ts, uid, id.orig_p, id.resp_h, id.resp_p, proto, and many more.
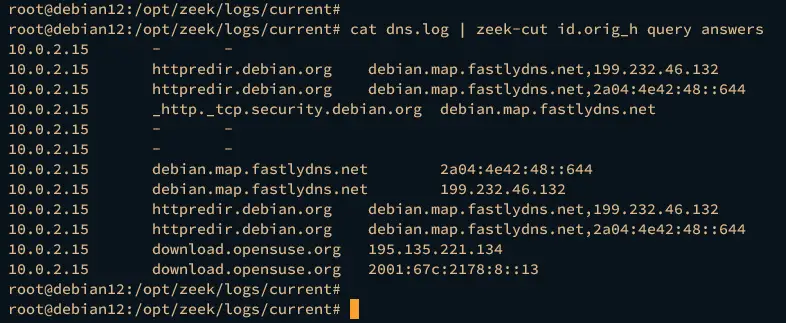
Next, execute the following command to parse the Zeek TSV log format. With this, you will send the output via pipe “|” to the zeek-cut command.
In this example, you will three fields from the log file, such as id.orig_h, query, and answers.
cat dns.log | zeek-cut id.orig_h query answers
cat dns.log | zeek-cut query answers id.orig_h
You should see the similar output like the following:
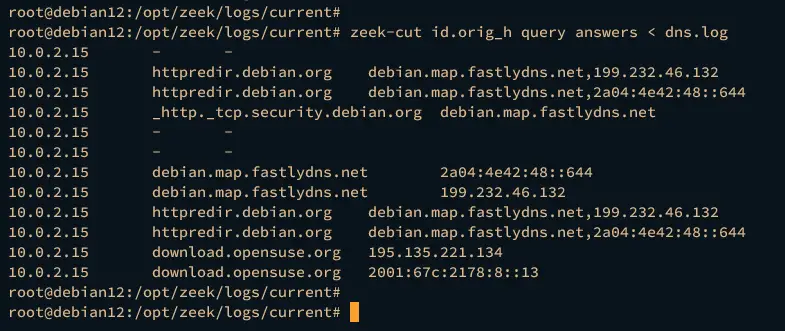
You can also use the redirect symbol to process the TSV log file via zeek-cut like the following command.
zeek-cut id.orig_h query answers < dns.log
The output should be similar.
Configuring Zeek Log Files to JSON
In the following step, you will configure Zeek to generate output log files with JSON format. To achieve that, you must modify local.zeek file and load the zeek script tuning/json-logs to your zeek installation.
Open the file /opt/zeek/share/zeek/site/local.zeek using the following nano editor command.
sudo nano /opt/zeek/share/zeek/site/local.zeek
Insert the following configuration to the bottom of the line.
@load tuning/json-logs
Save and close the file when you’re done.
Now run the zeekctl command below to redeploy your zeek installation.
zeekctl deploy
You should see zeek is now reinstalling. Once the process is finished, zeek will generate JSON log files.
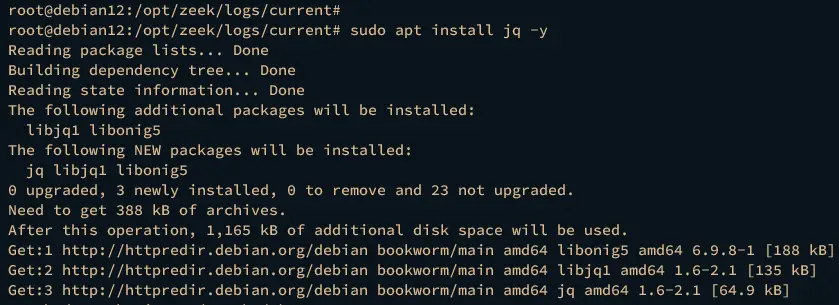
Before analyzing the JSON log format, install jq to your machine by executing the following apt command.
sudo apt install jq -y
Once jq is installed, move to the /opt/zeek/logs/current/ directory. The directory /opt/zeek/logs/current contains zeek log files in JSON format, and it’s automatically generated by zeek.
cd /opt/zeek/logs/current/
Run the cat command below to view the log file dns.
cat dns.log
The JSON output will be displayed on your terminal screen.
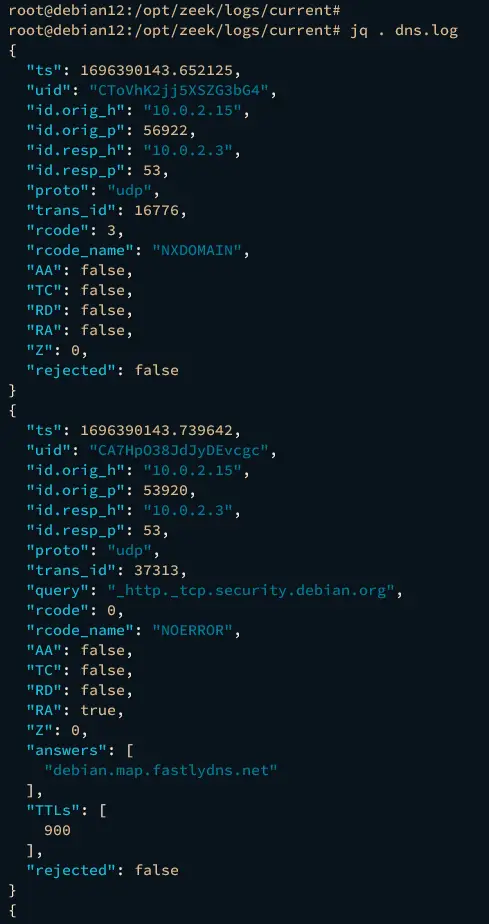
Next, run the jq command below to process the JSON log dns.log.
jq . dns.log
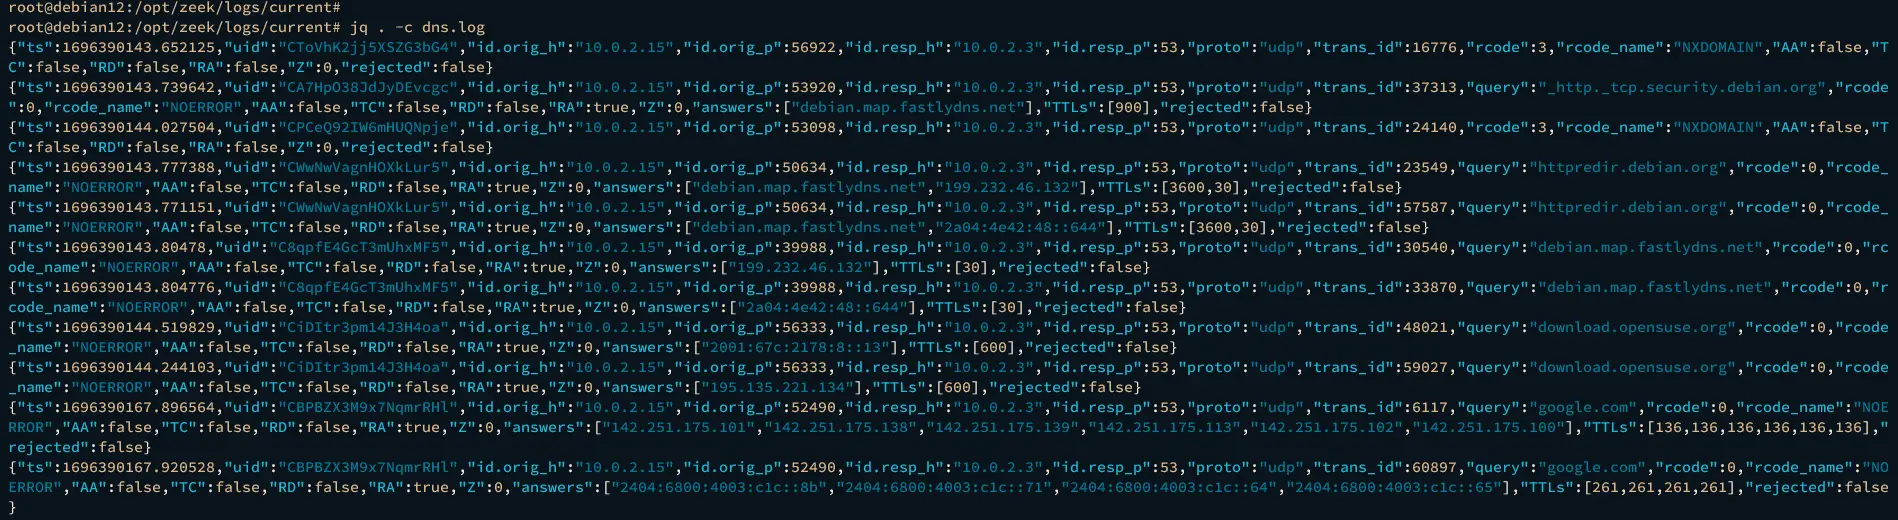
Or you can display the compact format via the -c option like the following.
jq . -c dns.log
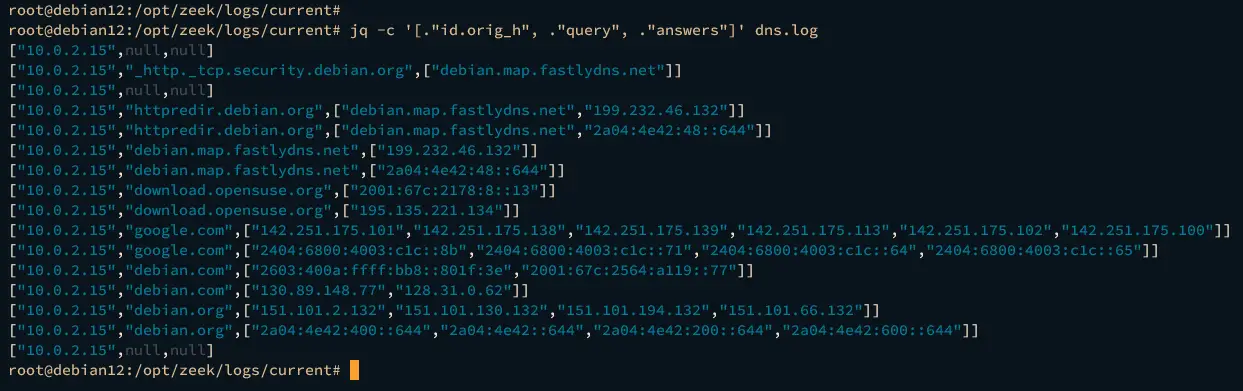
Lastly, execute the following command to display a specific key/value from the JSON file dns.log.
jq -c '[."id.orig_h", ."query", ."answers"]' dns.log
You should see the output like the following.
Conclusion
Congratulations! You’ve now successfully installed the Zeek network monitoring tool on the Debian 12 server. You’ve installed Zeek, run Zeek in the cluster mode, learned some zeek log files, and also learned how to parse zeek log files with TSV format via zeek-cut. Furthermore, you’ve also changed the zeek log to JSON and learned how to parse Zeek log JSON format via jq command lines.


