In this article, you will learn how to monitor the global performance of a website with Grafana and worldPing.
What is worldPing?
worldPing is a Grafana plugin that can continuously store, test, and alert on the global performance of Internet applications and uptime of your website. It allows you to monitor the uptime, response time of DNS, ICMP, HTTP, and HTTPS from all over the world, even inside your datacentre.
With worldPing, you can do 1 million checks every month for free. With these many checks free every month, you can easily monitor of 2 websites.
But if you are an enterprise and need more to monitor, you can go for the paid plan.
Features of worldPing:
- Tests the performance of your applications and uptime
- With the advanced alerting system, it notifies you about any issue.
- Gives comparative performance metrics of your competitors
- Easily shares interactive snapshots with anyone you wish
- Have multiple metrics on a single dashboard
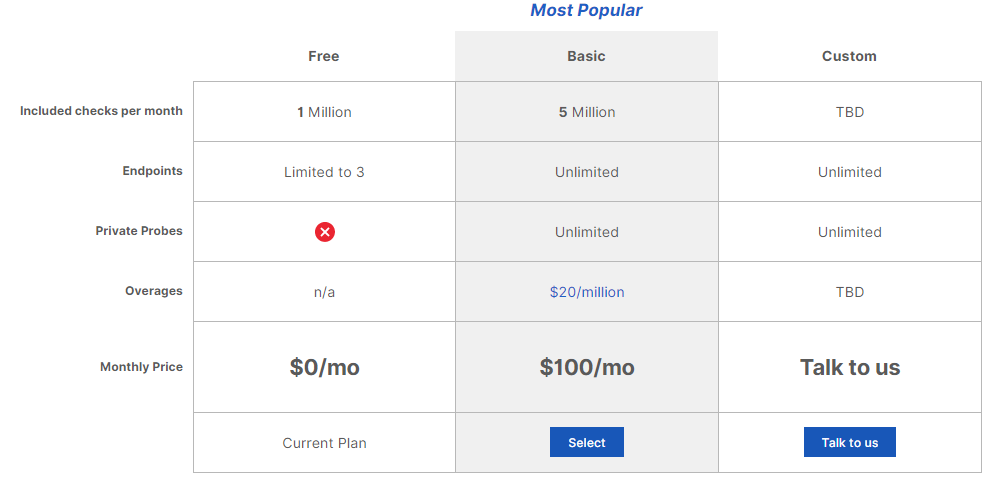
Below is the pricing structure of worldPing. You pay for the number of checks worldPing performs for you every month. One million checks on up to 3 endpoints are completely free. An endpoint is anything that you want worldPing to monitor, for example, URL, IP address, hostname.
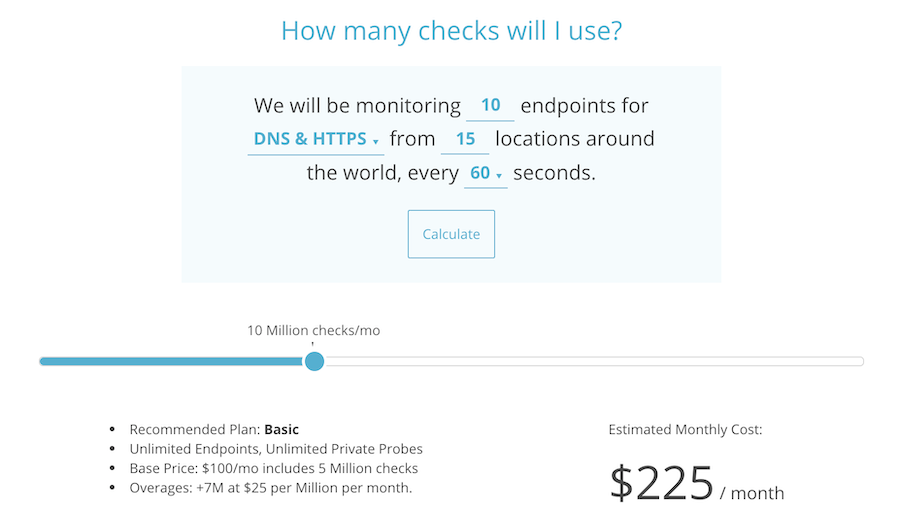
In case your organization spread across multiple locations with multiple endpoints, you can use the price calculator to calculate the monthly price.
For example, monitoring ten endpoints from 25 locations every 60 seconds would cost $225 per month.
There are ways to use worldPing.
Cloud-based
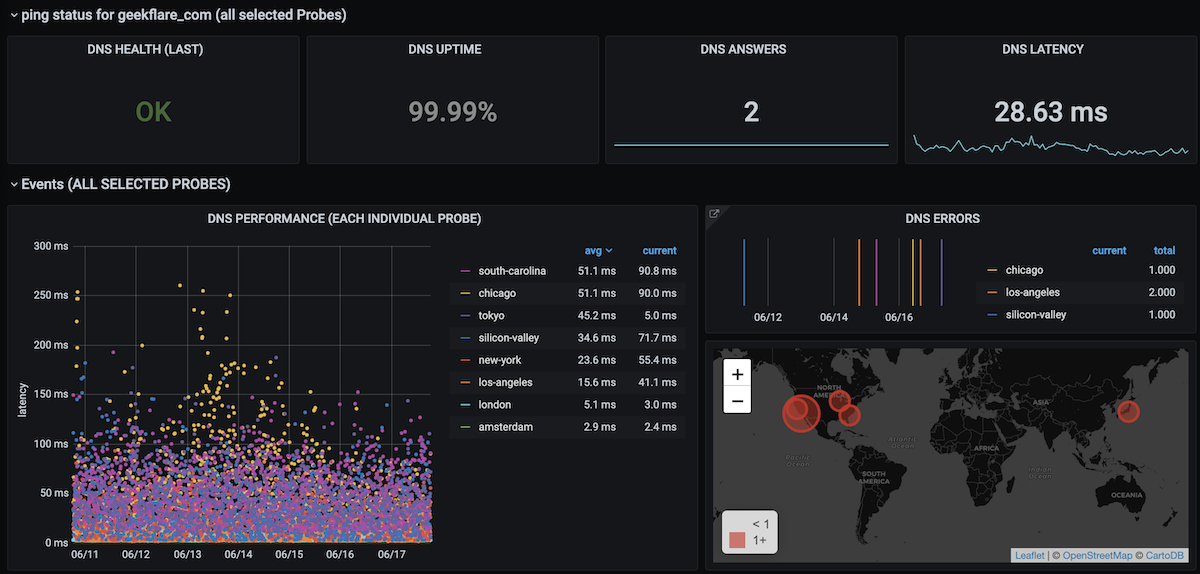
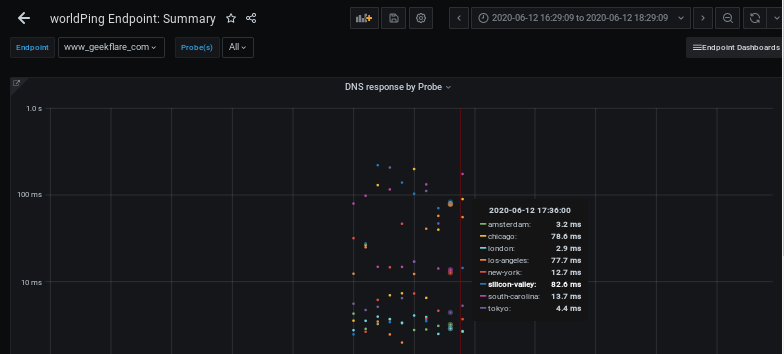
You can leverage Grafana Cloud to add your endpoints to get it started. The procedure is very straightforward, and I was able to get it up and running within 10 minutes. As its SaaS model, you don’t need to install Grafana on your server. The below snapshot is from the DNS metrics dashboard.
Self-hosted
you can integrate worldPing with your on-premises Grafana. You need to install the necessary plugins and configuration. Let’s explore this in detail.
Prerequisite
Grafana should be installed on your machine. In case you do not have Grafana installed, follow this blog to install Grafana.
worldping Installation
- You can install worldping by a
grafana-clitool.
[[email protected] ~]$ sudo grafana-cli plugins install raintank-worldping-app
installing raintank-worldping-app @ 1.2.7
from: https://grafana.com/api/plugins/raintank-worldping-app/versions/1.2.7/download
into: /var/lib/grafana/plugins

✔ Installed raintank-worldping-app successfully

Restart grafana after installing plugins . - Restart Grafana, for Worldping to list inside Plugins.
[[email protected] ~]$ sudo systemctl restart grafana-server
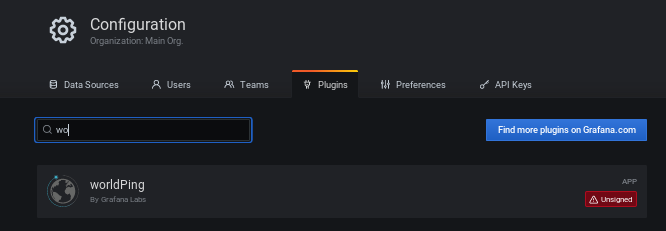
[[email protected] ~]$ sudo systemctl status grafana-server- Go to the Grafana configuration window and check if worldPing is appearing.
Create API Key and Enable worldPing
- Click on the worldPing plugin listed and generate a new API key.
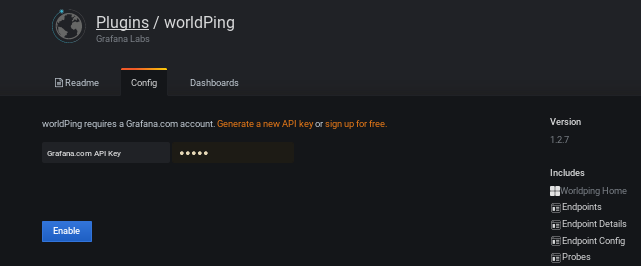
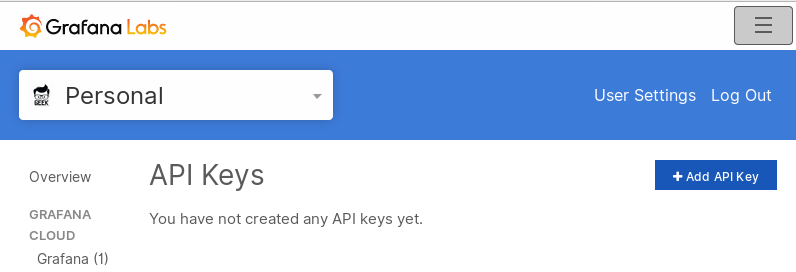
- You will be directed to the Grafana page. If you do not have an account on Grafana, you need to sign up and create API Key. Click on Add API Key.
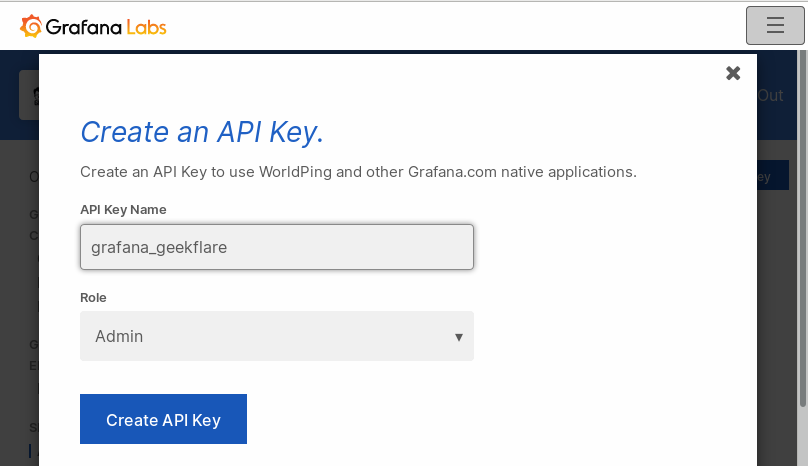
- Enter the key name and role, click on Create API Key.
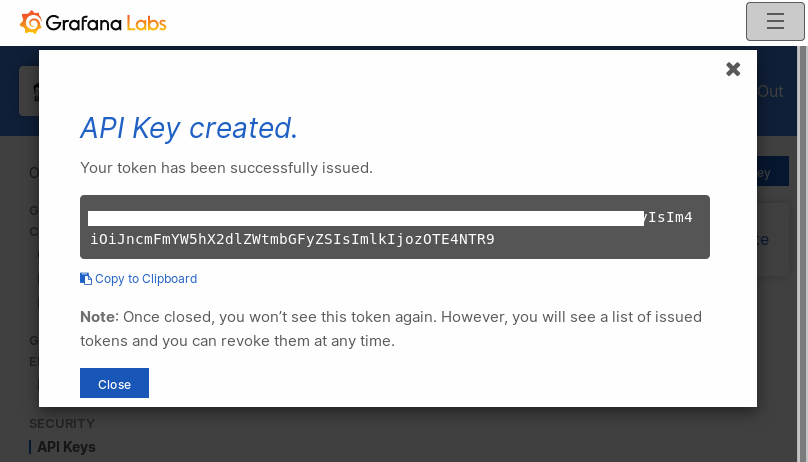
- The API Key will get created, copy this key.
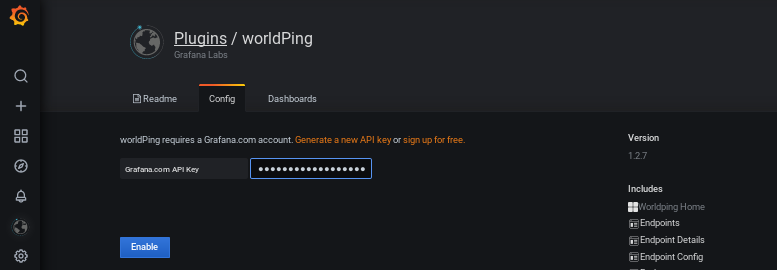
- Go to Grafana worldPing plugins page and paste the key generated and click on Enable.
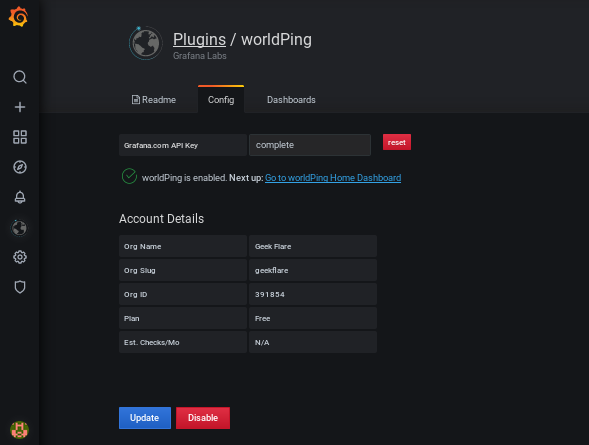
- Once the worldPing is enabled, you will be able to get the account details.
Adding Endpoints to Monitor
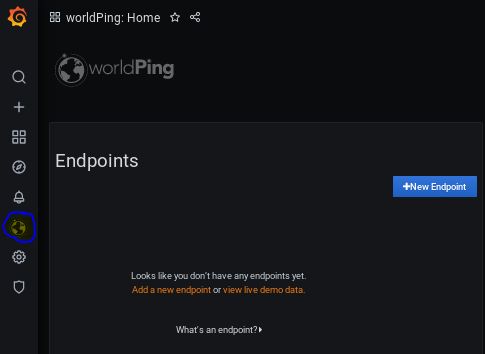
- Click on the sign shown in the snapshot below and then click on the New Endpoint button.
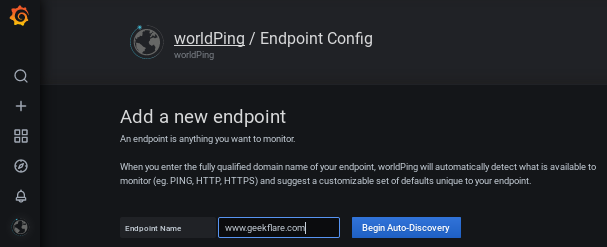
- Enter the fully qualified domain you want to monitor; I am monitoring www.geekflare.com.
- Click on Begin Auto-Discovery.
- You can choose to monitor DNS, Ping, HTTP, HTTPS as per your need.
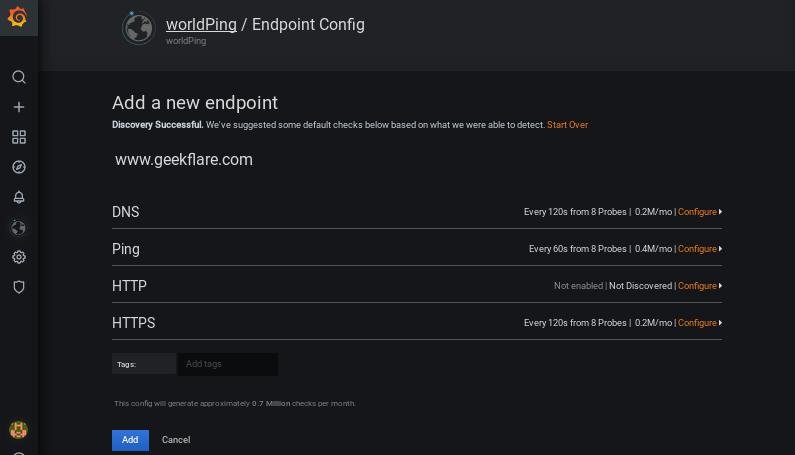
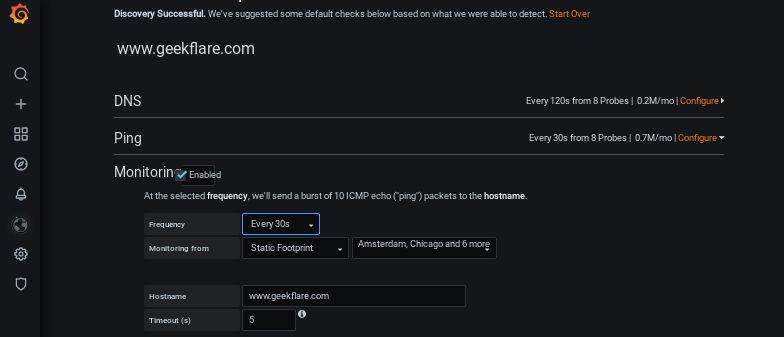
- Here, I am configuring Ping for every 30 seconds from 60 seconds. Click on the Add button.
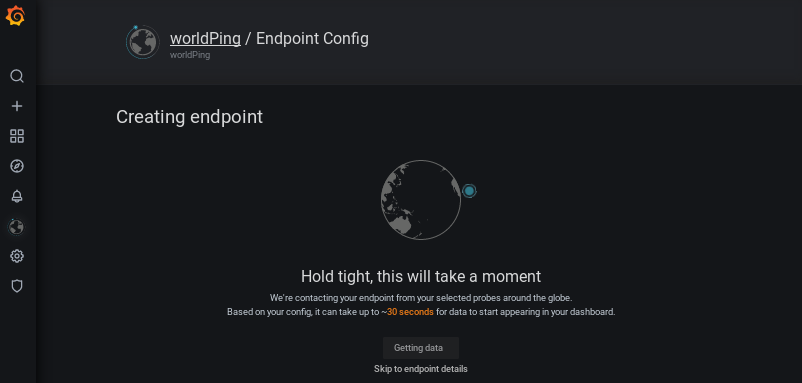
- It might take a couple of minutes to create an endpoint.
- Finally, you will be able to see the uptime, status, and performances in the dashboard.
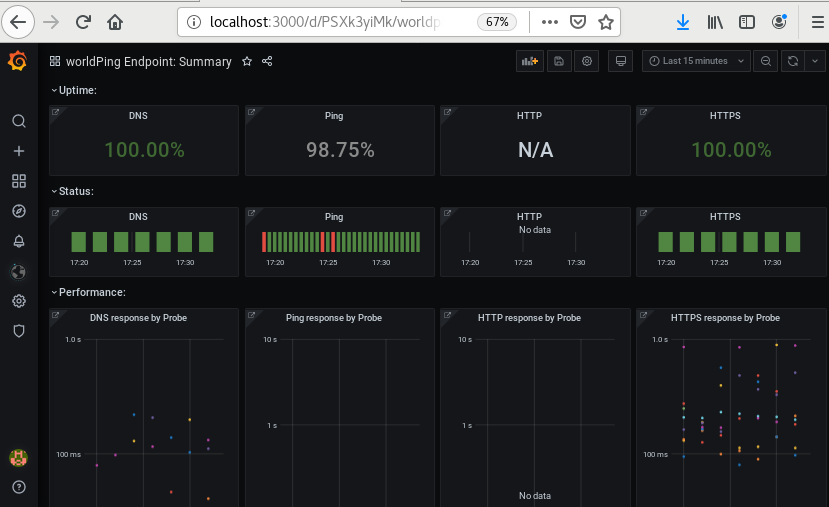
- You can explore all the metrics by clicking on the panel.
Conclusion
worldPing looks fantastic to observe website and DNS performance globally. Grafana is an enterprise-ready solution, and if you are interested in learning in-depth, then check out this course.


