Grafana Loki is a tool that gives you a panel for indexing of your systems’ logs and visualizing them on a dashboard. Grafana Loki does not index the contents of the logs but only indexes the labels of the logs. This reduces the efforts involved in processing and storing logs.
Promtail, just like Prometheus, is a log collector for Loki that sends the log labels to Grafana Loki for indexing.
In this post, we shall cover the following:
- Installation of Grafana
- How to install Loki
- How to install Promtail
- How to configure Loki Data source and Explore
Quickly let’s start the installation steps:
Step 1 – Install Grafana Monitoring Tool
In this section we will cover installation of Grafana on Ubuntu. Use the links below that will guide you on how to install Grafana on different systems:
How To Install Grafana 7 on CentOS 7
How To Install Grafana on CentOS 8 / RHEL 8
Install Grafana on Kubernetes for Cluster Monitoring
Update your Ubuntu system and reboot:
sudo apt-get update
sudo apt-get upgrade
sudo reboot
Add Grafana GPG key then install Grafana APT repository:
## Add gpg key
sudo apt-get install -y gnupg2 curl
curl https://packages.grafana.com/gpg.key | sudo apt-key add -

## Add Grafana APT repository
sudo add-apt-repository "deb https://packages.grafana.com/oss/deb stable main"
Install Grafana
sudo apt-get update
sudo apt-get -y install grafana
Start Grafana-service
sudo systemctl start grafana-server
sudo systemctl enable grafana-server
Grafana is now installed and can be accessible via the server’s IP and port 3000. (http://server_IP:3000)
You need to allow port 3000 through the firewall.
For Ubuntu:
sudo ufw allow proto tcp from any to any port 3000You can then access Grafana web dashboard,

Step 2 – Install Grafana Loki Log aggregation System
We now proceed to installing Loki with the steps below:
- Go to Loki’s Release Page and choose the latest version of Loki
- Navigate to Assets and download the Loki binary zip file to your server. During the release of this article, v2.0.0 is the latest.
curl -s https://api.github.com/repos/grafana/loki/releases/latest | grep browser_download_url | cut -d '"' -f 4 | grep loki-linux-amd64.zip | wget -i -Install unzip
# Ubuntu / Debian
$ sudo apt install unzip

# CentOS / Fedora / RHEL
$ sudo yum -y install unzip
3. Unzip the binary file to /usr/local/bin
unzip loki-linux-amd64.zip
sudo mv loki-linux-amd64 /usr/local/bin/loki
Confirm installed version:
$ loki --version
loki, version 2.0.0 (branch: HEAD, revision: 6978ee5d)
  build user:       [email protected]
  build date:       2020-10-26T15:54:56Z
  go version:       go1.14.2
  platform:         linux/amd64
4. Create a YAML file for Loki under /usr/local/bin
Create required data directories:
sudo mkdir -p /data/lokiCreate new configuration file.
sudo vim /etc/loki-local-config.yamlAdd the following configuration to the file:
auth_enabled: false

server:
  http_listen_port: 3100

ingester:
  lifecycler:
    address: 127.0.0.1
    ring:
      kvstore:
        store: inmemory
      replication_factor: 1
    final_sleep: 0s
  chunk_idle_period: 5m
  chunk_retain_period: 30s
  max_transfer_retries: 0

schema_config:
  configs:
    - from: 2018-04-15
      store: boltdb
      object_store: filesystem
      schema: v11
      index:
        prefix: index_
        period: 168h

storage_config:
  boltdb:
    directory: /data/loki/index

  filesystem:
    directory: /data/loki/chunks

limits_config:
  enforce_metric_name: false
  reject_old_samples: true
  reject_old_samples_max_age: 168h

chunk_store_config:
  max_look_back_period: 0s

table_manager:
  retention_deletes_enabled: false
  retention_period: 0s
5. Create Loki service:
Create the following file under /etc/systemd/system to daemonize the Loki service:
sudo tee /etc/systemd/system/loki.service<<EOF
[Unit]
Description=Loki service
After=network.target

[Service]
Type=simple
User=root
ExecStart=/usr/local/bin/loki -config.file /etc/loki-local-config.yaml

[Install]
WantedBy=multi-user.target
EOF
6. Reload system daemon then start Loki service:
sudo systemctl daemon-reload
sudo systemctl start loki.service
You can check and see if the service has started successfully:
$ sudo systemctl status loki
● loki.service - Loki service
     Loaded: loaded (/etc/systemd/system/loki.service; disabled; vendor preset: enabled)
     Active: active (running) since Mon 2020-12-21 11:49:49 UTC; 2min 37s ago
   Main PID: 15223 (loki)
      Tasks: 7 (limit: 1137)
     Memory: 13.6M
     CGroup: /system.slice/loki.service
             └─15223 /usr/local/bin/loki -config.file /etc/loki-local-config.yaml

Dec 21 11:49:49 ubuntu loki[15223]: level=info ts=2020-12-21T11:49:49.330959628Z caller=table_manager.go:476 msg="creating table" table=index_2658
Dec 21 11:49:49 ubuntu loki[15223]: level=info ts=2020-12-21T11:49:49.331092225Z caller=table_manager.go:476 msg="creating table" table=index_2549
Dec 21 11:49:49 ubuntu loki[15223]: level=info ts=2020-12-21T11:49:49.331220486Z caller=table_manager.go:476 msg="creating table" table=index_2562
Dec 21 11:49:49 ubuntu loki[15223]: level=info ts=2020-12-21T11:49:49.331347316Z caller=table_manager.go:476 msg="creating table" table=index_2615
Dec 21 11:49:49 ubuntu loki[15223]: level=info ts=2020-12-21T11:49:49.331471475Z caller=table_manager.go:476 msg="creating table" table=index_2643
Dec 21 11:49:49 ubuntu loki[15223]: level=info ts=2020-12-21T11:49:49.327278535Z caller=module_service.go:58 msg=initialising module=ring
Dec 21 11:49:49 ubuntu loki[15223]: level=info ts=2020-12-21T11:49:49.331950866Z caller=module_service.go:58 msg=initialising module=distributor
Dec 21 11:49:49 ubuntu loki[15223]: level=info ts=2020-12-21T11:49:49.332140208Z caller=module_service.go:58 msg=initialising module=ingester-querier
Dec 21 11:49:49 ubuntu loki[15223]: level=info ts=2020-12-21T11:49:49.332342162Z caller=loki.go:227 msg="Loki started"
Dec 21 11:51:49 ubuntu loki[15223]: level=info ts=2020-12-21T11:51:49.311922692Z caller=table_manager.go:324 msg="synching tables" expected_tables=141
You can now access Loki metrics via http://server-IP:3100/metrics
Step 3 – Install Promtail Agent
Promtail is an agent which ships the contents of local logs to a private Loki instance or Grafana Cloud.
- Download Promtail binary zip from the release page
curl -s https://api.github.com/repos/grafana/loki/releases/latest | grep browser_download_url | cut -d '"' -f 4 | grep promtail-linux-amd64.zip | wget -i -Once the file is downloaded extract it to /usr/local/bin
unzip promtail-linux-amd64.zip
sudo mv promtail-linux-amd64 /usr/local/bin/promtail
Check version:
$ promtail --version
promtail, version 2.0.0 (branch: HEAD, revision: 6978ee5d)
  build user:       [email protected]
  build date:       2020-10-26T15:54:56Z
  go version:       go1.14.2
  platform:         linux/amd64
2. Create a YAML configuration file for Promtail in the /usr/local/bin directory:
sudo vim /etc/promtail-local-config.yaml3. Add the following content to the file:
server:
  http_listen_port: 9080
  grpc_listen_port: 0

positions:
  filename: /data/loki/positions.yaml

clients:
  - url: http://localhost:3100/loki/api/v1/push

scrape_configs:
- job_name: system
  static_configs:
  - targets:
      - localhost
    labels:
      job: varlogs
      __path__: /var/log/*log
4. Create a service for Promtail:
sudo tee /etc/systemd/system/promtail.service<<EOF
[Unit]
Description=Promtail service
After=network.target

[Service]
Type=simple
User=root
ExecStart=/usr/local/bin/promtail -config.file /etc/promtail-local-config.yaml

[Install]
WantedBy=multi-user.target
EOF
5. Reload and start Promtail service
sudo systemctl daemon-reload
sudo systemctl start promtail.service
Confirm if service is in running state:
$ systemctl status promtail.service
● promtail.service - Promtail service
     Loaded: loaded (/etc/systemd/system/promtail.service; disabled; vendor preset: enabled)
     Active: active (running) since Mon 2020-12-21 11:57:41 UTC; 3s ago
   Main PID: 15381 (promtail)
      Tasks: 6 (limit: 1137)
     Memory: 8.8M
     CGroup: /system.slice/promtail.service
             └─15381 /usr/local/bin/promtail -config.file /etc/promtail-local-config.yaml

Dec 21 11:57:41 ubuntu systemd[1]: Started Promtail service.
Dec 21 11:57:41 ubuntu promtail[15381]: level=info ts=2020-12-21T11:57:41.911186079Z caller=server.go:225 http=[::]:9080 grpc=[::]:35499 msg="server listening on>
Dec 21 11:57:41 ubuntu promtail[15381]: level=info ts=2020-12-21T11:57:41.911859429Z caller=main.go:108 msg="Starting Promtail" version="(version=2.0.0, branch=H>
At this point, we have installed Grafana, Loki and Promtail.
The next step is to configure Grafana Dashboard and visualize the logs using Loki.
Step 4 – Configure Loki Data Source
- Login to Grafana web interface and select ‘Explore’. You will be prompted to create a data source.

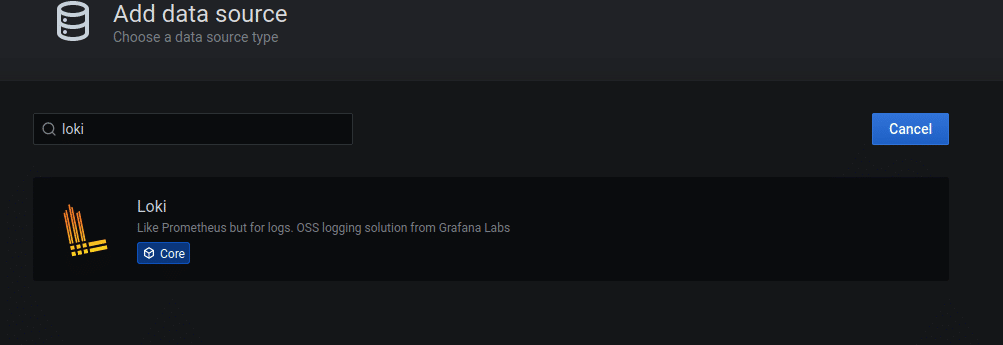
2. Click on Add data source then select Loki from the available options:

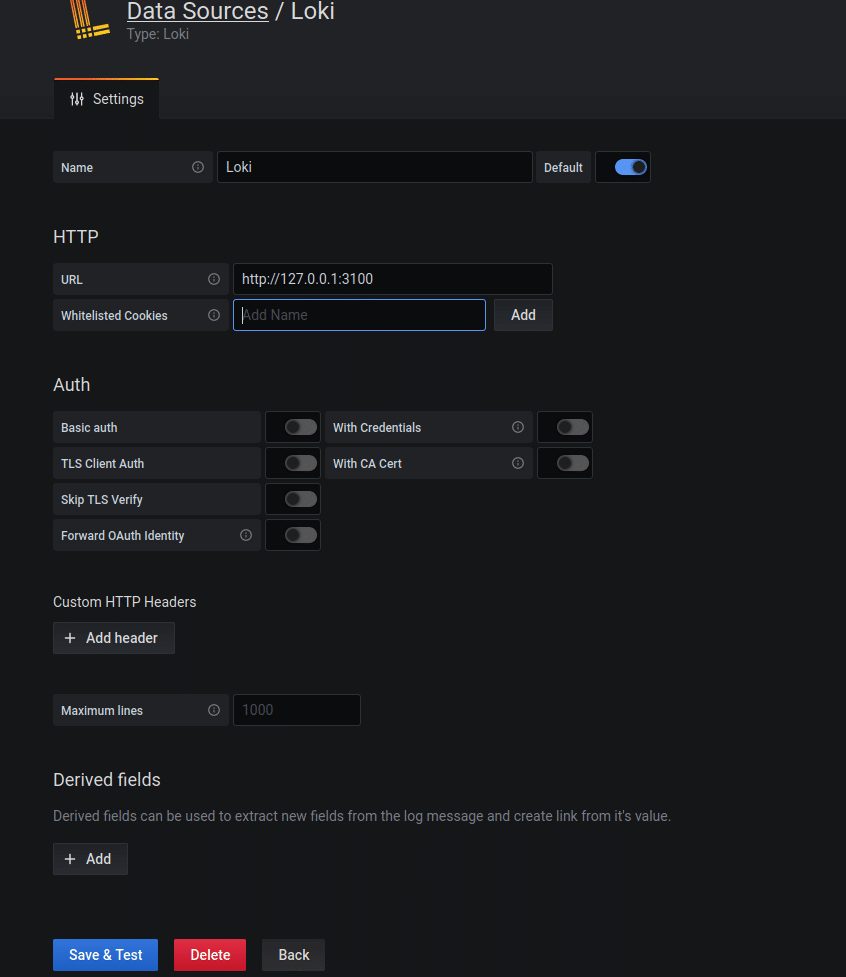
4. Input the following values for Loki:
Name: Loki
URL: http://127.0.0.1:3100
See below screenshot.

5. Click Save&Test. You should see a notification that the data source was added successfully.
Step 5 – Visualize Logs on Grafana with Loki
We can now visualize logs using Loki.
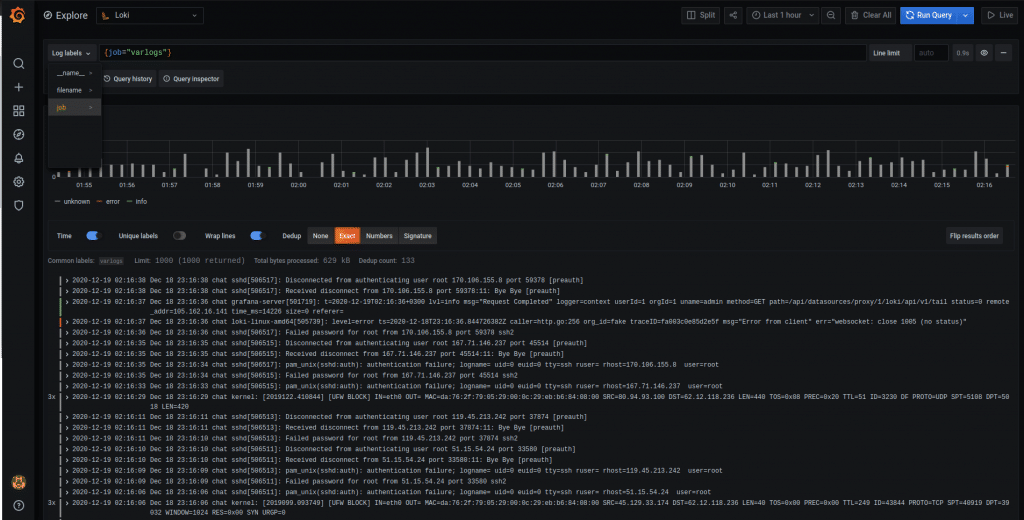
Click on Explore then select Loki at the Data source

You can now easily visualize the logs by selecting the Log labels options.
Conclusion
We have successfully installed Grafana Loki with Promtail and have been able to visualize the logs on a Grafana dashboard.
Grafana Loki can use many more log forwarding tools other than Promtail, e.g FluentBit. You can also use Grafana Loki to monitor your Kubernetes cluster. Enjoy!


